
Abstract
To elucidate the roles of oral keratinocytes in the adaptive immune response of oral mucosa, global gene expression analysis was performed by microarray technique and integrating computational methods, including hierarchical clustering, biological process Gene Ontology analysis, Kyoto Encyclopedia of Genes and Genomes pathway analysis, self-organizing maps (SOMs) and biological association network analysis (BAN). Raw data from microarray experiments were uploaded to the Gene Expression Omnibus Database,
Introduction
Keratinocytes are the major constituent of epithelial cells at mucosal surfaces and skin, which cover organs, internal cavities and the body. Traditionally, keratinocytes have been considered as an inert component of the multilayered epithelium to protect the subepithelial compartments from the pathogenic microorganisms, toxic stimuli and physical trauma. However, accumulated researches of the airway, gastrointestinal tract and skin have demonstrated that keratinocytes function in the development of the immune system, promotion of pathological inflammation and even impose diverse decisions on immune cells. 1–4 On the other hand, compelling evidence has indicated that the dysregulation of immune cells may stem from inappropriate keratinocyte response. 2,5,6 As a new subject ‘epimmunome’, which aims to define all the epithelial molecules that direct the actions of immune cells, has emerged, the novel and pleiotropic roles of keratinocytes in the initiation, regulation and resolution of immune responses at several mucosa sites and skin will be disclosed. 2
Oral mucosa is the mucous membrane lining the inside of the oral cavity, which is the entry portion of the alimentary canal. A lot of inflammatory/autoimmune-associated diseases occurred in the oral mucosa, including oral lichen planus (OLP), discoid lupus erythematosus, pemphigus and recurrent aphthous ulcer. The etiology and pathogenesis of these diseases, which have histopathological features of immune cells and keratinocyte disorder, are still unclear. Previous studies, which aimed to elucidate the mechanisms underlying these diseases, mainly focused on immune cells whereas the role of keratinocytes has long been underestimated. 7,8 In recent years, more and more research has indicated the implication of keratinocytes in oral inflammatory/immunol diseases. For instance, Youngnak-Piboonratanakit et al. 9 found that keratinocytes in OLP lesion expressed B7-H1, the ligand of immune regulatory molecule PD-1, suggesting that the induction of B7-H1 on keratinocytes may play an important role in tolerance induction in the inflamed oral mucosa. Immunohistochemical analysis revealed that OLP lesional keratinocytes overexpressed CXCL9, CXCL10 and CXCL11 while the infiltrating T-cells expressed their ligand of CXCR3. 10 Obviously, it is reasonable to hypothesize that oral keratinocytes play active and distinct roles in the oral mucosal adaptive immune response. In this pilot study, the global gene expression analysis was performed to disclose the transcriptional profiles of oral keratinocytes from an animal model with some features of oral mucosal adaptive immunity developed in our lab. Moreover, the identification of some functional modules that were influenced by differentially expressed genes will provide a framework for further study and may be of practical relevance for future treatment of oral mucosal immune diseases.
Materials and methods
Animals
Male C57BL/6J mice and BALB/c mice were obtained from the Guangdong Medical Laboratory Animal Center (Guangzhou, China). These mice were maintained in accredited animal facilities at the Ophthalmic Animal Laboratory, Zhongshan Ophthalmic Center, Sun Yat-sen University (Guangzhou, China). The study was approved by the Animal Use and Care Committees of Sun Yat-sen University. The mice were acclimated for at least one week prior to use in these experiments at 7–8 weeks of age weighing about 20 g.
Animal model
BALB/c mice were sacrificed and the tongues, inner part of the cheeks and plates were obtained. After trimming submucosal tissue attached to the oral mucosa, the tongues, plates and cheeks were immersed in Dispase II (1.2 U/mL; Roche, Lewes, UK) to be digested at 4°C overnight. Subsequently, the epithelial layer was enzymatically and mechanically separated from the underlying connective tissue and was further incubated in 0.25% trypsin/0.02% ethylenediamine tetraacetic acid (EDTA; Gibco, Grand Island, NY, USA) for 3–5 min with vigorous pipetting to achieve cell dispersion. After trypsin was inactivated by 10% fetal bovine and washing, the cell suspension was re-suspended in phosphate-buffered saline to the concentration of 1 × 10⁷ cells/mL. After being intraperitoneally anesthesized with chloral hydrate, C57BL/6J mice were given a subcutaneous injection with 50 μL cell suspension obtained from BALB/c mice into the foreneck. Seven days later, 25 μL cell suspension was injected to the same C57BL/6J mouse into tongue submucosa under anesthesia.
Histology and immunohistochemistry
Two groups of six C57BL/6J mice at 48 and 96 h after tongue submucosal injection and control group without any manipulation were sacrificed. Tongues were excised and fixed in 10% buffered formalin, embedded in paraffin, cut into 4-μm sections and stained with hematoxylin–eosin for histological staining. The immuno-histochemical staining was carried out based on the manufacturer's instructions (R&D Systems, Minneapolis, MN, USA). Briefly, the sections were incubated with a rat IgG monoclonal anti-mouse CD3 antibody (1:50; MAB4841; R&D Systems) at 4°C overnight. Cell and Tissue Staining Kits (R&D Systems) was applied to locate and visualize the antigen–antibody complex with diaminobenzidine. Tissue sections were counterstained with Mayer's hematoxylin.
Oral keratinocyte collection
Groups of six C57BL/6J mice at 48 and 96 h after tongue submucosal injection and control without any manipulation were sacrificed. Tongues were excised and subcutaneous tissue and blood were trimmed. The epithelia were obtained after being digested in Dispase II (1.2 U/mL; Roche) at 4°C overnight. Subsequently, the epithelial layer was enzymatically and mechanically separated from the underlying connective tissue. The epithelial layer was further incubated in 0.25% trypsin/0.02% EDTA (Gibco) at 37°C for 3–5 min with vigorous pipetting to achieve cell dispersion. After trypsin neutralization by fetal calf serum and washing, the keratinocytes were collected for the following experiments.
RNA isolation and purification
Oral keratinocytes of three groups of C57BL/6J mice at 48, 96 h and control group were collected for gene microarray and reverse transcriptase polymerase chain reaction (RT-PCR) analysis. Total RNA was extracted with Trizol reagent (Invitrogen, Gaithersburg, MD, USA) according to the manufacturer's instructions. The RNA quality was assessed by formaldehyde agarose gel electrophoresis and quantitated spectrophotometrically. The mRNA sample for chip hybridization was prepared by mixing the mRNA samples of every mouse from the same group in equal quantities.
Microarray experiment
The oral keratinocyte gene expression profile of each sample was examined by use of the mouse genome oligonuleotide microarray (Affymetrix Gene Chip Mouse Genome 430 2.0 Array; Affymetrix, Santa Clara, CA, USA) at Capitalbiochip Corporation (Beijing, China) in which the gene chip microarray service is certificated by Affymetrix. The chip measures the expression of over 45,000 probe sets representing over 34,000 well-substantiated mouse genes. The protocol for microarray processing was carried out according to the GeneChip® Expression Analysis Technical Manual (Affymetrix, 701021, Rev.5). The hybridized microarrays were then scanned using the GeneChip® Scanner 3000 and converted into TIFF images in preparation for analysis.
Data processing and analysis
The expression values for each gene were acquired using the GeneChip® operating system (GCOS 1.4, Affymetrix). Data normalization and filtering were conducted with a DNA-Chip analyzer (dChip). In the present study, significant fold changes among genes were determined by taking the ratio of the expression between the 48- and 96-h groups versus control groups. A differentially expressed gene was defined as a variation in gene expression no less than two-fold and a detection P value <0.05. Significance Analysis of Microarray (SAM) software was used to determine statistically significant genes. Following SAM analysis, hierarchical clustering with average linkage was carried out by Cluster 3.0 and the cluster data were visualized by the Java Treeview software. The differentially expressed genes were mapped to Gene Ontology (GO) terms and the Kyoto Encyclopedia of Genes and Genomes (KEGG) pathway based on the mouse accession ID, using the molecule annotation system (MAS;
Quantitative realtime PCR
Oral keratinocyte RNA preparations used for the microarray were also subjected to realtime PCR validation assays using primers specific for a randomly selected cohort of those genes. The primer sets for these genes were designed to amplify about 100 bp segments and primers specific for S26 ribosomal protein (RPS26) were used as a house-keeping gene control. 11 All primers were custom-designed from GenBank mRNA sequences and prepared by DaAn Gene Company (Guangzhou, China). Their sequences are listed in Table 1. cDNA was synthesized from 4 μg RNA samples using oligo dT to prime the reverse transcriptase reaction. RT-PCR was carried out on the ABI 9700 instrument (ABI company, Foster City, CA, USA) with the QPCR SYBR green detection reagent (ABI company) for three minutes at 93°C for the initial denaturing, followed by 40 cycles of 93°C for 30 s, 55°C for 45 s and 72°C for 45 s. Cell threshold values for each gene were determined and fold induction compared with RPS26 was calculated using the ΔΔCT method. 12 RT-PCR results were recorded for each gene as fold change versus control. PCR products were evaluated by dissociation curves to confirm single amplication and the absence of significant primer-dimer contamination.
Primer designed for quantitative realtime polymerase chain reaction analysis
Biological association network analysis
Biological association network (BAN) analysis was constructed with the aid of GeneSpring GX software v11.0 (Agilent Technologies, Santa Clara, CA, USA). This software package generates interaction networks starting with the differential expressed gene list, taking into account the information present in a database of known molecular interactions. Details of this network construction were described in a previous study. 13
Protein isolation and Western blot
Oral keratinocytes of three groups from mice at 48 and 96 h after tongue submucosal injection, and control group, were collected, respectively, for Western blot analysis. Proteins from keratinocytes were extracted using RIPA buffer with addition of Protease inhibitor Cocktail and Phosphatase inhibitor Cocktail (Beyotime Institute of Biotechnology, Haimen, Jiangshu, China) according to the commercial protocol. The soluble supernatant was normalized for total protein concentration using the bicinchoninic acid method and the sample was stored at −20°C. Cell protein extracts were boiled for 5 min in 2× sample buffer and were separated on 10% sodium dodecyl sulfate-polyacrylamide gel and transferred onto Immuno-Blot polyvinylidene fluoride membrane. After blocking in 5% non-fat dry milk in TBST (Tris-buffered saline Tween-20), the membrane was incubated with antibodies specific for anti-mouse interleukin (IL)-1α antibody (1:1000, AF-400-NA), CXCL1 antibody (1:800, MAB4531), CXCL10 antibody (1:1000, MAB466) from R&D Systems and glyceraldehyde phosphate dehydrogenase antibody (1:1000, 2118) from Cell Signaling Technology (Danvers, MA, USA) overnight at 4°C. After washing in TBST, the membrane was incubated in horseradish peroxidase conjugated goat secondary antibodies (Beyotime Institute of Biotechnology) at 1:5000 dilution for one hour at 37°C. Incubation with BeyoECL plus reagents (Beyotime Institute of Biotechnology) was performed before exposure to X-ray films. After the films were developed and dried, the images were digitized using an HP Deskscan II® flat bed scanner, exported into Quantity One (Bio-Rad Laboratories Inc, Hercules, CA, USA). Gray levels were measured over a line in the middle of each strip. The greatest gray level in the peak was assigned to each band.
Results
Histology and immunohistochemistry
Sections of the mouse tongue biopsy from different experimental groups revealed that in the 48-h group there was an extensive, dense mononuclear cell infiltration in the tongue submucosal area (Figure 1a). Immunohistochemical staining showed the infiltrated mononuclear cells to be predominantly T-cells, positive for CD3 (Figure 1b).
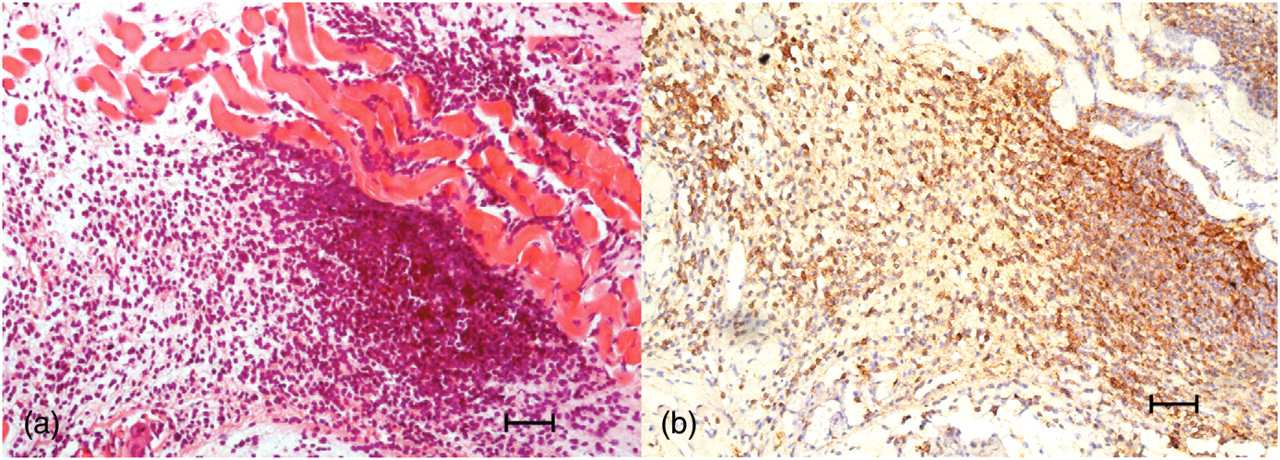
Histological and immunohistochemical studies of the 48-h group tongue biopsy. (a) The extensive, dense mononuclear cell infiltration was observed in the tongue submucosal area. Hematoxylin–eosin staining was performed at ×200 magnification high-power fields. Bar = 50 μm. (b) The infiltrated mononuclear cells were predominantly CD3-positive. Immunohistochemical staining was performed at ×200 magnification high-power fields. Bar = 50 μm
Differentially expressed genes in keratinocytes during oral mucosal adaptive immune response
Nine groups of oral keratinocyte RNA samples, three groups from control mice and three groups from experimental mice at two time points (48 and 96 h after oral submucosal injection) each, were collected for gene microarray hybridization (six mice per group). Affymetrix Mouse Genome 430 2.0 microarrays containing over 45,000 probe sets representing over 34,000 well-substantiated mouse genes were employed in this experiment. After the microarray experiment, data were normalized and analyzed by SAM software as described in Materials and methods. In the 48-h groups, 666 probe sets were identified as differentially expressed (591 up-regulated and 75 down-regulated), while in the 96-h groups, 993 probe sets were found to express differentially (90 increased and 903 decreased). The highest regulated probe sets are listed in Table 2. Obviously, some genes whose expression increased highly at 48 h down-regulated significantly at 96 h, such as adrenomedullin (ADM), prostaglandin-endoperoxide synthase 2 (PTGS2), chemokine (C-X-C motif) ligand 1 (CXCL1) and thymic stromal lymphopoietin (Tslp). These data revealed that hundreds of genes in keratinocytes were activated during the oral mucosal adaptive immune response.
Fold change expression of genes up/down-regulated in keratinocytes during oral mucosal immune response (microarray data)
Verification of microarray data by realtime PCR
A randomly selected subset of nine genes was used to validate the microarray results. Quantitative realtime PCR was used to evaluate the relative abundance of these nine genes in keratinocyte samples from control and experimental mice. The fold change gene expression of experimental groups versus control groups measured by RT-PCR was then compared directly to the fold change obtained by Affymetrix hybridization. The result presented a high level of agreement between the fold change measured by RT-PCR and by Affymetrix (Table 3). Taken together, the results of these RT-PCR studies validated the microarray data.
Realtime polymerase chain reaction verification of microarray data
RT-PCR, reverse transcriptase polymerase chain reaction; TGFβ, transforming growth factor beta; IL, interleukin
Hierarchical clustering of genes in oral keratinocytes
In the present study, a total of nine microarray hybridizations were available for analysis. To explore differences in mRNA abundance among samples in this experiment, an unsupervised cluster analysis of probe sets differentially expressed during the oral mucosal adaptive immune response was presented (Figure 2). The samples from the same group (control, 48 or 96 h) clustered together. The experimental groups’ gene expression differed considerably from that of the control groups and the experimental groups in two time points also differed substantially from each other. This result confirmed that keratinocyte gene expression varied at two time points during oral mucosal immune response.

Hierarchical clustering analysis of differentially expressed genes in keratinocytes during the oral mucosal immune response at different time points. After conducting Significance Analysis of Microarray analysis, we identified 1148 probe sets whose hybridization signal intensities showed significant (P < 0.05) variation during the oral mucosal immune response in keratinocytes. An unsupervised cluster analysis of probe sets differentially expressed during the oral mucosal immune response was performed by Treeview software. Intensity in the red and green color spectrum denotes up-regulated and down-regulated genes, respectively. The black intensity denotes no changes in gene expression levels compared with the control group. The above column indicated samples from the same group clustered together and the gene expression from control, 48- and 96-h groups were different from each other
GO analysis for differentially expressed genes
The differentially expressed genes were uploaded to the MAS (
Biological processes enriched in differentially expressed genes in oral keratinocytes
MHC, major histocompatibility complex
Pathway analysis for differentially expressed genes
In addition, to facilitate the biological interpretation of differentially expressed genes, we perform KEGG analysis using the MAS (
Kyoto Encyclopedia of Genes and Genomes pathways enriched in differentially expressed genes in oral keratinocytes
MAPK, mitogen-activated protein kinase; TGF, transforming growth factor
SOM analysis of gene expression profiles at three time points
To obtain insight into the kinetics of keratinocyte's gene expression during the adaptive immune response, 1148 differentially expressed genes from the 48- and 96-h experimental groups were irrespectively organized into six clusters, C1 through C6, using SOM analysis (Figure 3). C1 contained 90 transcripts which peaked at 96 h, such as interleukin 1 family, member 6 (Il1f6), interleukin 2 receptor, gamma chain (Il2rg), CD3 antigen, gamma polypeptide (Cd3g) and chemokine (C-X-C motif) ligand 9 (CXCL9). C2, C5 and C6 contained 865 transcripts whose expression increased at 48 h and dramatically decreased to even lower than the control groups at 96 h, including Mapk6, suppressor of cytokine signaling 2 (Socs2), Tslp, keratin 7, 8 and 18. Those genes that showed a predominant decline in expression at 48 h were found in C3 (95 transcripts). Finally, C4 contained 98 transcripts such as CD83, histocompatibility 2, D region locus 1(H2-D1), IL-1α and intercellular adhesion molecule 1 (ICAM1), which increased at 48 h and slightly decreased at 96 h. To facilitate the biological interpretation of screened genes, we uploaded the genes from the same cluster to the MAS to perform GO analysis. Particularly, the cluster C4, which was up-regulated during the experiment and peaked at 48 h, had crucial relevance to the immune and inflammation response. The cluster C2, C5 and C6 are associated with epithelial cell differentiation, regulation of transcription and antiapoptosis (data not shown).

Self-organizing map analysis showing time-course changes of differentially expressed genes. A total of 1148 differentially expressed gene from the 48- and 96-h experimental groups were irrespectively organized into six clusters, including cluster 1 (C1) through cluster 6 (C6), using GeneCluster version 2.0
Detection of node genes upon generation of biological association networks
To provide a functional context to the genes shown to be differentially expressed over time, GeneSpringGX software v11.0 (Agilent Technologies) was employed to construct the BANs. One hundred and fifty-two network eligible genes and 454 interactions were involved in BANs of 48 h (Figure 4a). In BANs constructed with differentially genes from 96 h, 76 network eligible genes and 134 interactions were shown (Figure 4b). After the BANs were generated, several highly interconnected nodes were identified such as Cebpb, Myc and Jun, as well as Rel in 48 h, and Cdc2a and Stat1 in 96 h. PTGS2 and Stat3 were the mostly highly interconnected nodes in both 48 and 96 h. Among the BANs, a subnetwork of cytokine IL-1α and its regulated genes, including CXCL1, CXCL10, ADM, ICAM1 and PTGS2 was identified (Figure 4c). These nodes seemed to be important nodes of these newly constructed networks and may be selected for further study.

Biological association networks (BANs) of differentially expressed genes in keratinocytes at different time points during oral mucosal adaptive immune response. To provide a functional context to differentially expressed genes over time, GeneSpringGX software v11.0 was employed to aid in identifying BANs that were significantly altered during the immune response. (a) BANs of oral keratinocytes in 48 h. Microarray analysis revealed 666 differentially expressed genes in 48 h. One hundred and fifty-two network eligible genes (blue circle highlighted) and 454 interactions (edge) were involved in BANs. (b) BANs of oral keratinocytes in 96 h. Microarray analysis revealed 993 differentially expressed genes in 96 h. Seventy-six network eligible genes (blue circle highlighted) and 134 interactions (edge) were involved in BANs. (c) Subnetwork around interleukin (IL)-1α identified from BANs. From BANs, a subnetwork with IL-1α as the hub gene was identified. This subnetwork was composed of IL-1α and other five nodes including CXCL1, CXCL10, adrenomedullin (ADM), ICAM1 and prostaglandin-endoperoxide synthase 2 (PTGS2) which were positively regulated by IL-1α. (d) Node (gene) and edge (gene relationship) symbols were described in the legend. Red-labeled symbols indicated the genes that were found to be up-regulated by microarray analysis (P < 0.05) compared with control groups, while blue labeling indicated significant down-regulation
Validation of IL-1α subnetwork genes’ expression
In order to testify the IL-1α subnetwork, Western blot was employed to assay the protein expression of IL-1α and some of its target genes, including CXCL1 and CXCL10. IL-1α expression increased significantly at 48 h after submucosal injection and decreased 48 h later (Figur. 5a). The expression tendency of CXCL1 and CXCL10 was similar to that of IL-1α in time course (Figures 5b and c).
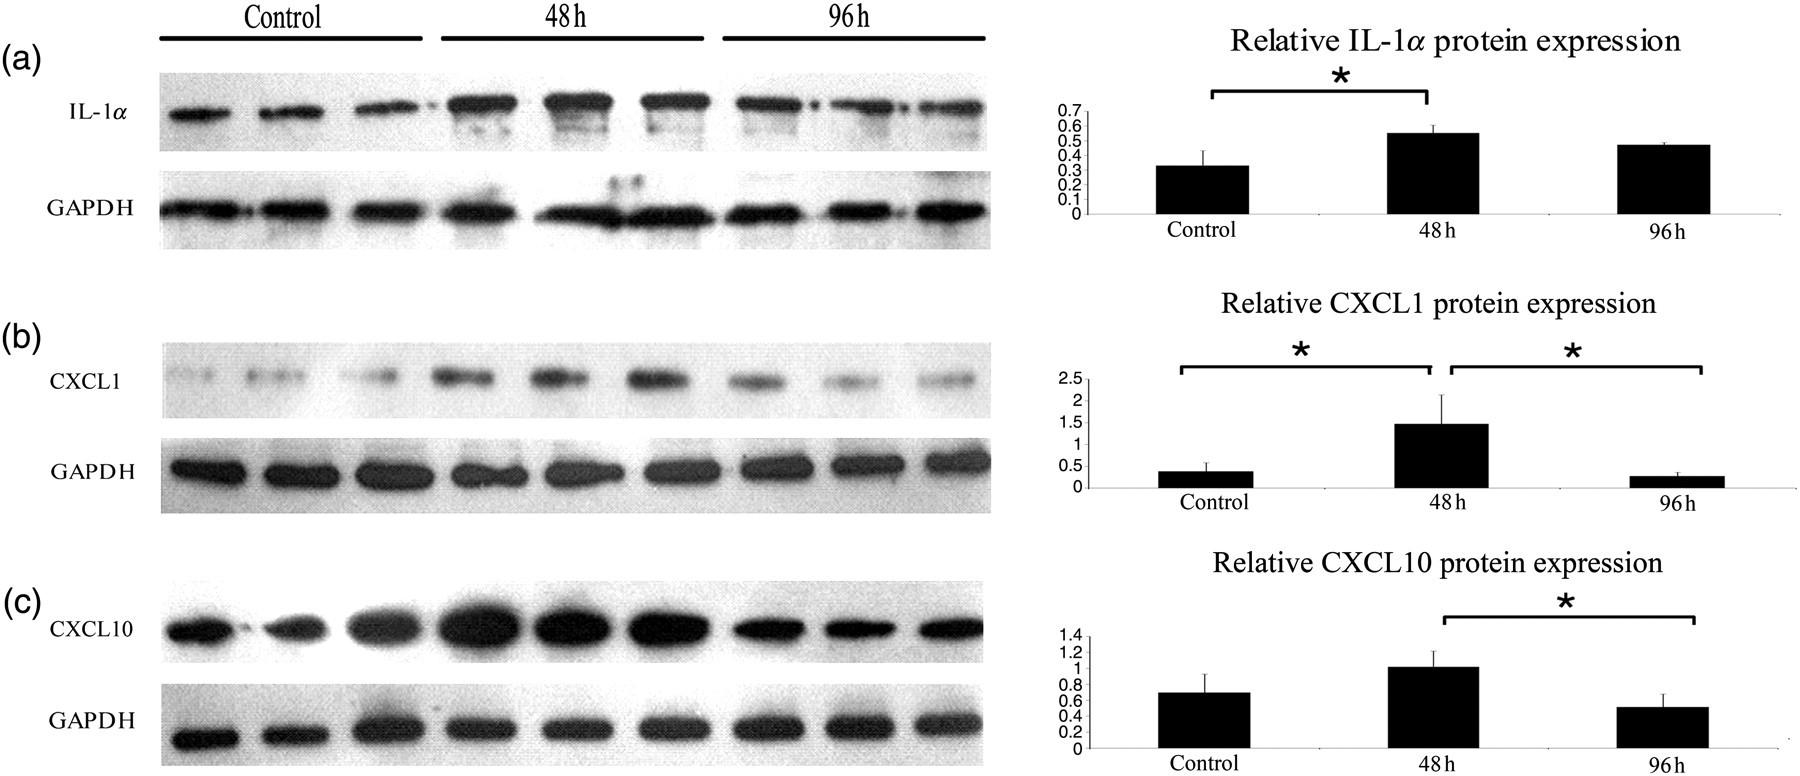
Western blot validation of interleukin (IL)-1α subnetwork genes’ protein expression. Oral keratinocytes of three groups from mice at 48, 96 h after tongue submucosal injection and control group were collected, respectively, for Western blot analysis. IL-1α expression increased at 48 h after oral submucosal injection and decreased at 96 h after that (a). CXCL1 and CXCL10, the target genes of IL-1α, had similar expression patterns of IL-1α (b, c). Protein concentration is expressed as the mean + SD of nine protein samples from three independent experimental groups. *P < 0.05
Discussion
It has been recognized for a long time that immune cells play active roles and have profound effects on keratinocytes, which were passive as the target in mucosal immune responses. However research accumulated during the last decades on the airway, gastrointestinal tract and skin has provided substantial evidence to support the active roles of keratinocytes in the generation and progression of protective immune responses and immunopathological reactions. 1–4 Compared with keratinocytes in other mucosa sites, relevant research on oral keratinocytes are scattered and how they participate in immune response is largely unknown. Therefore, the main objective of the present work was to testify the hypothesis that oral keratinocytes play active roles in the oral mucosal adaptive immune response and provide more in-depth and detailed information on their participation.
As described before, the existence of positive and negative acting feedback loops between keratinocytes and immune cells were thought to be responsible for the perpetuation of the inflammatory process. 2,5,6 Therefore, we testified our hypothesis on our delayed type hypersensitivity murine model induced by sensitization and elicitation of allogenic oral keratinocytes, which is characterized by predominantly T-cell-mediated tongue inflammation (Figure 1). Relevant study in our groups showed that in such populations of CD3-positive T-cells from the 48-h groups, CD4-positive T-cells constituted the major fraction and significantly increased the mRNA and protein expression level of IFN-γ in the tongue (data not shown). Therefore, in our experiment we collected keratinocytes at two specific time points, which were associated with the number of T-cells accumulated in oral mucosa. One was at 48 h after tongue submucosal injection, whose T-cell amount reached the highest level, and the other was at 96 h, whose T-cell diminished significantly. We anticipated that comparing microarray data from these two time points with control groups would provide us important information on keratinocyte gene variation in different stages of the oral mucosal adaptive immune response.
In order to testify our hypothesis, representative gene-expression profiles from two experimental groups of oral keratinocytes were compared with the control group. The results revealed that 591 probes sets were up-regulated and 75 down-regulated at 48 h while 90 were increased and 903 decreased in the 96-h groups. These results have been validated by RT-PCR (Table 3). To further evaluate the likeness of the gene expression profile in these two time points, hierarchical clustering analysis was employed as the first exploratory analysis to provide a useful visualized output after finishing the microarray hybridization. The result showed that samples from the same experimental groups clustered together and discrete differences in characteristic color patterns of gene expression among the control, 48- and 96-h groups were apparent (Figure 2). These results demonstrated that hundreds of genes were activated in this immune response. Furthermore, oral keratinocyte gene expression profiles varied significantly in different stages of oral adaptive immune response. At these two time points the number of T-cells accumulated in the oral mucosa diversed, which may partially account for the divergence of gene expression profiles and the distinct biological functions of oral keratinocytes at two stages of the oral mucosal adaptive immune response.
To explore more biological information about these differentially expressed genes, we uploaded these genes to the MAS to undergo GO analysis. The biological processes involved in 48 h were associated with immune response while that in 96 h were connected with cell proliferation (Table 4). As shown in previous studies, keratinocytes have the potential to act as non-professional antigen-presenting cells. Black et al. 14 found that under inflammatory conditions, human keratinocytes processed and presented endogenous and exogenous antigen to T-cells via expressing MHC class I, class II, ICAM1 and subsequently induced rapid effector function in antigen-specific memory CD4+ and CD8+ T-cells. This finding is consistent with our results in the present study. Differentially expressed genes from the 48-h groups fell into several biological processes associated with antigen presentation (Table 4a). Furthermore, our findings were supported by immunostaining-based studies on OLP showing that lesion keratinocytes expressed the immune regulatory molecules PD-1's ligand B7-H1, ICAM1, chemokine CXCL9, CXCL10, CXCL11 while the infiltrating T-cells expressed their ligands. 9,10,15 Altogether it is clear that oral keratinocytes have multiple biological functions in the adaptive immune response, hereinto, one of the most important immunological functions exerted by oral keratinocytes is antigen presentation.
In addition, to facilitate the biological interpretation of differentially expressed genes, we performed KEGG pathway analysis to obtain more details about the pathways involved in oral keratinocytes (Table 5). From GO analysis we knew that the biological processes in 48 h were connected with the immune response; accordingly we paid special attentions on pathways enriched in 48 h. Among them, the MAPK signaling pathway was the most significant over-represented pathway in 48 h. The MAPK pathway has been shown to be fundamental in inflammatory cytokine and chemokine gene expression at both transcriptional and post-transcriptional levels. 16 Research on skin showed that the mechanism of long-lasting inflammatory processes was related with the activation of the MAPK in keratinocytes, which play a crucial role in the immune responses. 17 In our experiment 23 genes including TGF-β, IL-1α, Myc and Jun participated in the MAPK pathway in 48 h; this pathway may be associated with the chemokine and cytokine expression in the oral mucosal immune process, suggesting the significant immunoregulator role of oral keratinocyte in this immune response.
It is believed that genes with the same expression kinetics may be involved in similar biological progression, so we employed an unsupervised learning neural network which was known as SOM to cluster genes by placing those with similar temporal gene expression profiles together. 18 In the present study, the differentially expressed genes in the control, 48 and 96-h groups were irrespectively organized into six clusters, C1 through C6, using SOM analysis (Figure 3). The expression patterns of the majority of differentially expressed genes, including C2, C4, C5 and C6 (peak at 48 h), were in concordance with the accumulated pattern of T-cell. Tslp was a case in point (7.2-fold up-regulated in 48 h, 0.06-fold down-regulated in 96 h) (Table 2). Tslp is an epithelial cell derived cytokine, which has been reported to be expressed in the gut, lung, skin and thymus. Signaling via the Tslp receptor, which is expressed on a wide range of cell types in immune system, Tslp exerts profound influence on dendritic cells, T-cells, B-cells and mast cells. Furthermore, Tslp has been reported to be associated with the immunopathological processes of inflammatory bowel disease, asthma, as well as atopic dermatitis. 19,20 Up to date, this is the first report about the expression of Tslp in oral keratinocytes. This finding gives a significant clue on oral keratinocytes as strong and active regulators in immune response, which are similar to their counterparts in other mucosa sites and skin.
Another aim of this study was to identify some pivotal functional modules influenced by the genes whose expressions were altered during the oral immune response. We believed that identification of these critical genes and networks would provide a framework for further study and may be of practical relevance for future treatment of oral mucosal immune diseases. In this study we used the genes differentially expressed in two time points in the oral mucosal adaptive immune response to construct the BANs (Figure 4). Through BANs, some highly interconnected nodes such as Stat3, PTGS2 and IL-1α were recognized to be targets in further studies on oral keratinocyte immunoregulatory roles. Stat3, the most highly interconnected nodes in both 48 and 96 h, has been confirmed to perform protective and anti-inflammatory function in the intestinal mucosa through its actions in epithelia, but its activation in oral keratinocyte was seldom reported. 21
The most striking observation we found in BANs was a subnetwork around IL-1α. This subnetwork was composed of hub gene IL-1α and other five nodes including CXCL1, CXCL10, ADM, ICAM1 and PTGS2, which were positive, regulated by IL-1α (Figure 4c). To further validate this subnetwork, we employed Western blot to testify the protein expression of IL-1α and some of its target genes, including CXCL1 and CXCL10 (Figure 5). The results show that there is no significant difference between the 48- and 96-h groups in IL-1α expression (Figure 5a) and also between the control and 48 h groups in CXCL10 expression (Figure 5c). A probable reason for no statistical significance showed is due to the small sample size of proteins. From these similar protein expression patterns, it is justifiable to believe that there is a biological regulatory mechanism between IL-1α and CXCL1 and CXCL10.
IL-1α is constitutively expressed on keratinocyte and has been known for a long time to promote T-cell responses. 22,23 It has autocrine actions to upregulate MHC class II expression, and stimulate cytokine and chemokine production. Besides, it also has juxtacrine actions to activate neutrophils, monocytes and T-cells which infiltrate under inflammatory conditions. 24 It has been reported that IL-1α was a general amplifier of T-cell responses in several epithelial tissue immune responses. 25–27 In mucosal inflammation such as asthma, inflammatory bowel disease and ulcerative colitis, increased expression of IL-1α was observed. 26–28 In particular, our previous study shown that in tissue transudate and whole unstimulated saliva from OLP patients, there was a significantly higher expression level of IL-1α compared with controls. 29,30 In this subnetwork, CXCL1, CXCL10, ADM, ICAM1 and PTGS2, which were regulated by IL-1α, have been reported to be inflammatory enhancers and promoters in mucosa immune associated diseases such as OLP, asthma and inflammatory bowel disease. 15,31–36 It is worth noting that IL-1α and its regulated genes have been reported expressed by epithelial cell under inflammatory condition; however, to our best of knowledge, this is the first time to report the regulatory network in mucosa site, especially in oral mucosa. A complete characterization of IL-1α subnetwork will illuminate the multiple regulatory functions of keratinocytes in oral mucosa or even in other mucosa sites.
Conclusion
The oral keratinocyte microarray data presented in this study demonstrated that oral keratinocytes play active roles and exert diverse immunological functions in the oral mucosal adaptive immune response. We also identified several putative node genes and interaction networks such as IL-1α and its subnetwork through BAN construction. Further characterization of these genes and interaction networks will shed light on the mechanisms of keratinocytes directing the initiation and progression of oral mucosal adaptive immune response. Studies of T-cells in the same animal models on gene expression are currently under way. The results will help to elucidate the cross-talk between keratinocytes and T-cells in the oral mucosa adaptive immune response.
Footnotes
ACKNOWLEDGEMENTS
This work was supported by grants from the National Natural Scientific Foundation of China (30672317, 30872874, 91029712), Specialized Research Foundation of the Doctoral Program of Higher Education of China (200805580082) and Provincial Natural Scientific Foundation of Guangdong (8151008901000080).