
Abstract
Bladder cancer-associated protein (BLCAP) is a novel candidate tumor suppressor gene identified from human bladder carcinoma and highly associated with the invasion of bladder cancer. We previously reported that it also plays a key role in the tumorigenesis and metastasis of human osteosarcoma. In the present study, we constructed a recombinant encoding BLCAP cDNA. Overexpression of BLCAP resulted in growth inhibition and induced apoptosis of human TC-135 Ewing's sarcoma cells in vitro. We further investigated the caspase-3/7 activity and expressions of the fusion transcription factor Ewing's sarcoma protein-friend leukemia virus integration 1 (EWS-FLI1) and the apoptosis regulator B-cell lymphoma 2 (BCL-2). Cell apoptosis was accompanied by the down-regulated expression of EWS-FLI1 and BCL-2. Our present results suggest that BLCAP may play a role not only in regulating cell proliferation but also in coordinating apoptosis through the down-regulation of BCL-2 and EWS-FLI1 in human Ewing's sarcoma cells.
Introduction
Ewing's sarcoma, the most frequent primary bone tumor in children, is characterized by an extremely aggressive clinical course that lacks an effective treatment. Although chemotherapeutic strategies have improved, the survival rate of patients who relapse has not changed in recent years. 1
Ewing's sarcoma is characterized by the presence of specific gene fusions such as the Ewing's sarcoma (EWS) gene on chromosome 22 and the friend leukemia virus integration 1 (FLI-1) gene on chromosome 11. 2 The chimeric EWS-FLI1 protein is hypothesized to function as a transcriptional activator and also a transcriptional repressor. 3 EWS-FLI1 inhibition through the use of antisense oligodeoxyribonucleotides, 4 small interfering RNAs 3,5 or short hairpin RNAs 6,7 reduced proliferation, tumorigenicity and caused a strong induction of apoptosis in Ewing's sarcoma and primitive neuroectodermal tumor cells.
The bladder cancer-associated protein (BLCAP) gene (Genbank: NM_006698), also known as bladder cancer-10 kDa protein (BC10), is located on chromosome 20q11.2–q12 and encodes a 10 kDa protein. It is highly conserved between mice and humans and mainly expressed in brain and B-cells. 8 Evans et al. 9 demonstrated that BLCAP is indeed widely expressed, at least in fetal tissues. BLCAP is down-regulated during bladder cancer progression, which indicates that it may play a role in tumor suppression. 10 Previous studies did not reveal gross DNA rearrangements within the BC10 genomic locus in invasive bladder carcinomas, suggesting that the differential expression of BLCAP most likely reflects alterations in messenger expression (transcription and/or mRNA decay). 11
In our previous studies we demonstrated BLCAP expression in osteosarcoma. Its expression in metastatic osteosarcoma cells was much lower than in primary ones. 12,13 Even though the precise function of BLCAP is unknown, the presence of a putative Ser-Pro-X-X motif and a proline-rich area resembling the proline-X-X-proline domain suggests a role of this protein in cell signaling, as proline-rich sequences are commonly found in proteins involved in processes such as initiation of transcription, signaling cascades or cytoskeletal rearrangement. 14
We hypothesized that BLCAP may play a role in signaling pathways in Ewing's sarcoma. In this study, we overexpressed BLCAP in human TC-135 Ewing's sarcoma cells and found that BLCAP inhibited cell growth and induced apoptosis through the down-regulation of B-cell lymphoma 2 (BCL-2) and EWS-FLI1. These results suggest that BLCAP plays an important role in the suppression of tumor progression.
Materials and methods
Construction of expression vector
The BLCAP expression plasmid (p3xFLAG-CMV-14-BLCAP) was constructed using a p3xFLAG-CMV-14 vector (Sigma-Aldrich, St Louis, MO, USA). The open reading frame of BLCAP was cloned into the vector between EcoR1 and BamH1. The BLCAP recombinant was expressed as a fusion protein of BLCAP with a C-terminal FLAG-tag.
Cell culture and transfection
The human Ewing's sarcoma cell line TC-135 was kindly supplied by Dr Timothy J Triche (University of Southern California, Los Angeles, CA, USA). TC-135 cells were cultured in RPMI-1640 with 10% fetal bovine serum, 100 units/mL penicillin G, 100 μg/mL streptomycin and 0.25 μg/mL amphotericin B at 37°C, and seeded at a concentration of 2.0 × 10⁵ cells/60 mm dish 24 h before treatment. The cells were then transfected with the BLCAP recombinant (p3xFLAG-CMV-14-BLCAP) or control vector (p3xFLAG-CMV-14) using Lipofectamine 2000 (Invitrogen, Carlsbad, CA, USA), following the manufacturer's instructions. The total RNA and protein samples were collected 48 h after transfection.
Cell growth curve
The (4,5-dimethylthiazol-2-yl)-2,5-diphenyltetrazolium bromide (MTT) assay was used to evaluate the cell growth. Cells were plated in 96-well plates (2 × 10³ cells/200 μL), After one-, two-, three-, four-, five- and six-day transfection, 20 μL of MTT solution (5 mg/mL in phosphate-buffered saline [PBS]; Sigma-Aldrich) was added, and the cells were incubated at 37°C for four hours. After the supernatant was removed, 150 μL of dimethyl sulfoxide was added to each well. The dark-blue crystals of MTT-formazan were dissolved by shaking the plates at room temperature for 10 min and the absorbance was then measured on a Bio-Rad Microplate Reader (Bio-Rad, Hercules, CA, USA) using a test wavelength of 490 nm and a reference wavelength of 630 nm. Each experiment was done in triplicate.
Apoptosis assay
The proportion of apoptotic cells was determined by Annexin V/propidium iodide (PI) double staining. Forty-eight hours after transfection, cells were incubated with fluorescein isothiocyanate (FITC)-conjugated Annexin V in binding buffer (0.01 mol/L HEPES, 0.14 mol/L NaCl and 2.5 mmol/L CaCl2, pH 7.4) for 20 min at 37°C in the dark. After incubation, the cells were washed and resuspended in 200 μL PBS with 1% fetal calf serum and additionally incubated with 10 μL of 1 mg/mL PI solution. The Annexin V-positive cells were detected using a FACS Calibur flow cytometer (BD Biosciences, San Jose, CA, USA), and the results were analyzed using Cell Quest software (BD Biosciences). Annexin V-FITC conjugates were detected with the FL1 channel of the FACS Calibur machine. PI was read on the FL2 channel.
Realtime quantitative polymerase chain reaction and data analysis
Forty-eight hours after transfection, the total RNA was extracted with TRIzol reagent (Invitrogen) and reverse transcribed into cDNA with a Rever Tra Ace-a kit (Toyobo, Shanghai, China). Realtime quantitative polymerase chain reaction (PCR) was performed with SYBR green PCR reagent (Takara Bio Inc, Otsu, Japan) and each set of primers was performed separately in a total volume of 50 μL containing 10 mmol/L Tris-HCl (pH 8.3), 50 mmol/L KCl, 1.5 mmol/L MgCl2, 0.1 mmol/L of each dNTP, 0.4 mol/L of each primer, 1.5 U of Taq DNA polymerase and 2 μL of the appropriate reverse transcription reaction sample. β-Actin mRNA from the same RNA preparation served as an internal standard. The following specific primers were used: BLCAP: forward 5′ GCC GAA TTC ANN ATG GAT GTA TTG CCT CCA GTG G 3′, reverse 5′ GGC GGA TCC GGT GCC CAC AAC GCC GGG ATC 3′; EWS-FLI1: forward 5′ GTG ATA CAG CTG GCG TTG GCG 3′, reverse 5′ GCT GCC CGT AGC TGC TGC TCT GTT 3′; BCL-2: forward 5′ GGT GCC ACC TGT GGT CCA CCT 3′, reverse 5′ CTT CAC TTG TGG CCC AGA TAG G 3′; caspase-3: forward 5′ CAT GGA GAA CAC TGA AAA CTC AGT G 3′, reverse 5′ GAT AAA AAT AGA GTT CTT TTG TG 3′; β-actin: forward 5′ GCC CCC CTG AAC CCC AAG GCC AAC CG 3′, reverse 5′ GAA GTC CAG GGC GAC GTA GCA CAG 3′. The PCR was carried out as follows: initial denaturation at 95°C for five minutes was followed by 95°C for 60 s; 55°C for 60 s; and 72°C for 60 s for 34 cycles with a 10 min final extension at 72°C. All PCR reactions were done in triplicate. The cycle threshold value (C T) was determined as the point at which the fluorescence exceeded a preset limit by the instrument's software (Opticon monitor, version 3.1; Bio-Rad Laboratories, Hercules, CA, USA). The relative expression of target gene mRNA was calculated by the ΔC T method (where ΔC T is the value calculated by subtracting the C T value of β-actin from the C T value of target gene mRNA in each samples). The amount of target gene mRNA relative to β-actin mRNA was expressed as 2−ΔCT.
Western blot
Forty-eight hours after transfection, cells were harvested into ice-cold lysis buffer (1% Nonidet P-40, 0.5% sodium cholate, 1 mmol/L EDTA, 1 mmol/L EGTA, 150 mmol/L NaCl, 20 mmol/L HEPES, 3 mmol/L MgCl2, 1 mmol/L phenylmethylsulfonyl fluoride, 20 μg/mL leupeptin, 20 mmol/L β-glycerophosphate, 1 mmol/L sodium fluoride and 1 mmol/L sodium orthovanadate, pH 7.4) and sonicated. Protein concentrations were assayed by the Bradford method (Bio-Rad). Equal amounts of proteins (100 μg protein) were subjected to sodium dodecyl sulfate-polyacrylamide gel electrophoresis (9% gel) and transferred to polyvinylidene fluoride membranes (Millipore, Bedford, MA, USA). The membranes were blocked with 5% fat-free milk. All proteins were determined by immunoblotting.
The EWS-FLI1 fusion protein was sensitively detected by using an anti-FLI-1 antibody (Santa Cruz Biotechnology, Santa Cruz, CA, USA). Anti-FLAG-M2, anti-BCL-2 and anti-caspase-3 antibodies were purchased from Santa Cruz Biotechnology. β-Actin protein was detected as an internal standard, and the anti-β-actin antibody was purchased from Sigma-Aldrich. Anti-rabbit antibodies conjugated with horseradish peroxidase and the chemiluminescence kit (ECL® system) were purchased from Amersham Biosciences (Little Chalfont, Buckinghamshire, UK). Quantitative changes in luminescence were estimated by densitometry (Kodak 1D Image Analysis Software, EDAS290, Version 3.5; Kodak, Rochester, NY, USA).
Caspase-3/7 activity assay
The caspase-3/7 activity was measured using a Caspase-Glo™3/7 Assay kit (Promega, Madison, WI, USA) following the manufacturer's recommended procedure. The luminescence of each sample was measured in the Veritas™ Microplate Luminometer (Promega).
Statistical analyses
All statistical analyses were performed using SPSS 13.0 software (SPSS Inc, Chicago, IL, USA). Results were represented as means ± standard deviation. Dunnett's t-test was carried out when multiple comparisons were evaluated. Values were considered to be significant when the probability (P) value was P < 0.05.
Results
BLCAP is overexpressed in TC-135 cells
The BLCAP expression plasmid was transfected into human TC-135 Ewing's sarcoma cells by using Lipofectamine 2000. As shown in Figures 1 and 2, BLCAP was prominently expressed in TC-135 cells as demonstrated by both RNA and protein levels.
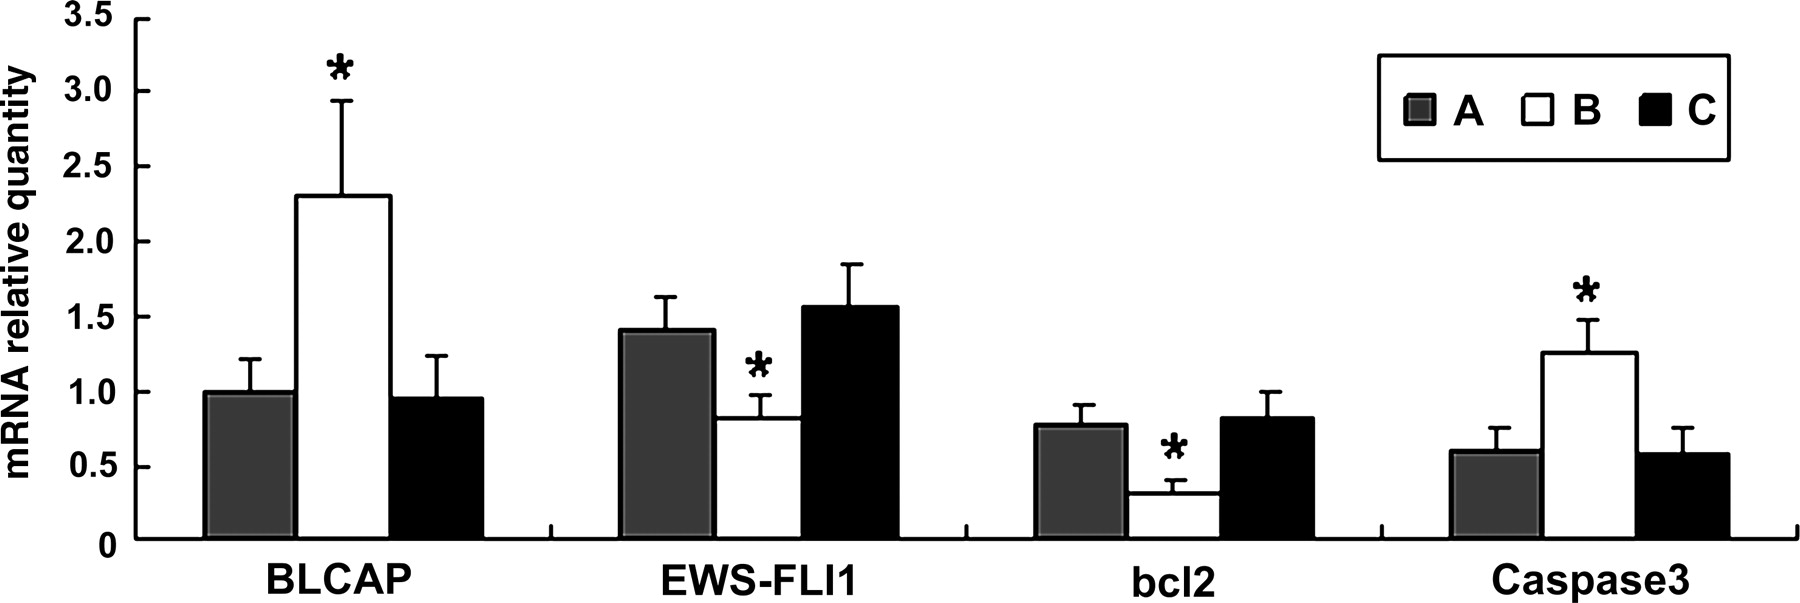
Effects of BLCAP overexpression on mRNA expression levels of genes related to apoptosis. A: TC-135; B: TC-135 transfected by BLCAP recombinant; C: TC-135 transfected by the blank vector. Asterisk indicates the number that was significantly different (*P < 0.05) between the test group and the control group. Error bars = SD. The figure shows that in TC-135 transfected with BLCAP for 48 h, BLCAP mRNA was significantly increased, EWS-FLI1 mRNA and BCL-2 mRNA were significantly decreased (*P < 0.05) and caspase-3 mRNA was significantly increased (*P < 0.05) (Dunnett's t-test). BLCAP, bladder cancer-associated protein; EWS-FLI1, Ewing's sarcoma protein-friend leukemia virus integration 1; BCL-2, B-cell lymphoma 2
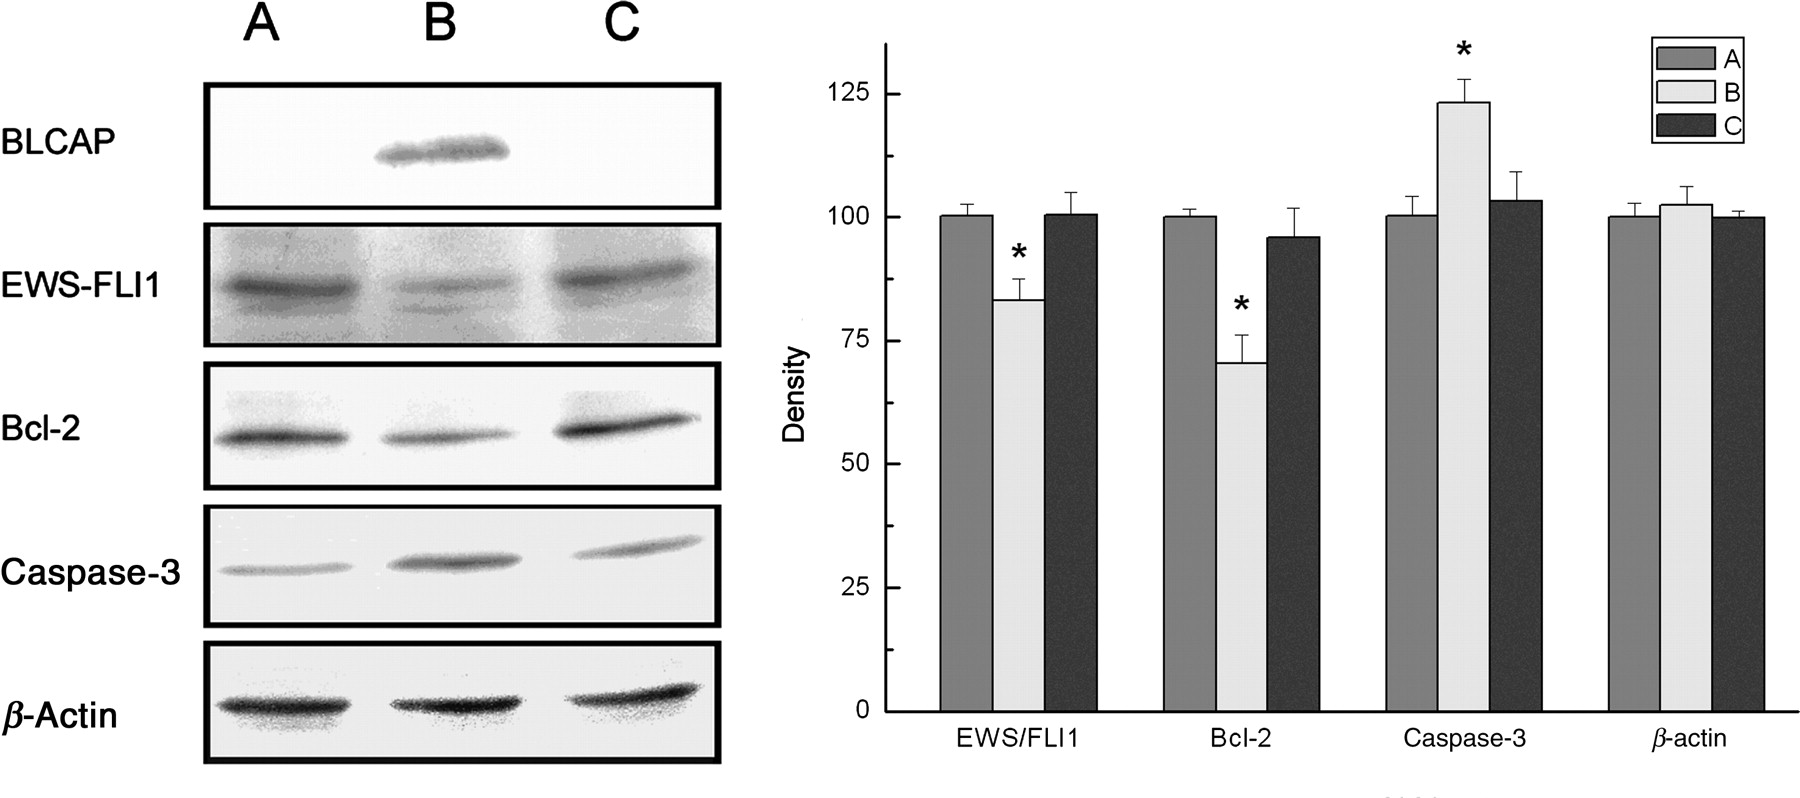
Effects of BLCAP overexpression on protein expression levels of genes related to apoptosis. A: TC-135; B: TC-135 transfected by BLCAP recombinant; C: TC-135 transfected by the vector. Asterisk indicates the number that was significantly different (*P < 0.01) between the test group and the control group. Error bars = SD. The figure shows that BLCAP protein with a FLAG-tag was successfully expressed in TC-135 which had been transfected for 48 h. The densitometry data show that EWS-FLI1 protein and BCL-2 protein were significantly decreased (*P < 0.01 for both) after transfection of BLCAP recombinant. Meanwhile, caspase-3 protein was significantly increased (*P < 0.01) (Dunnett's t-test). ). BLCAP, bladder cancer-associated protein; EWS-FLI1, Ewing's sarcoma protein-friend leukemia virus integration 1; BCL-2, B-cell lymphoma 2
BLCAP inhibits the proliferation of TC-135 cells
To investigate the influence of BLCAP expression in cell survival, we evaluated cell growth using the MTT assay every day after transfection of BLCAP. During the first week after transfection, we found that the expression of BLCAP rose to the highest level on day 2 and was reduced from day 4 (Figure 3a), but the cell growth rate was significantly decreased on day 2. Cell proliferation was inhibited notably in a time-dependent manner when cells were transfected with the BLCAP expression plasmid, and the highest inhibitory rate was 43.71 ± 5.4% (P < 0.05) on day 3 as compared with that of the vector control (Figure 3b).
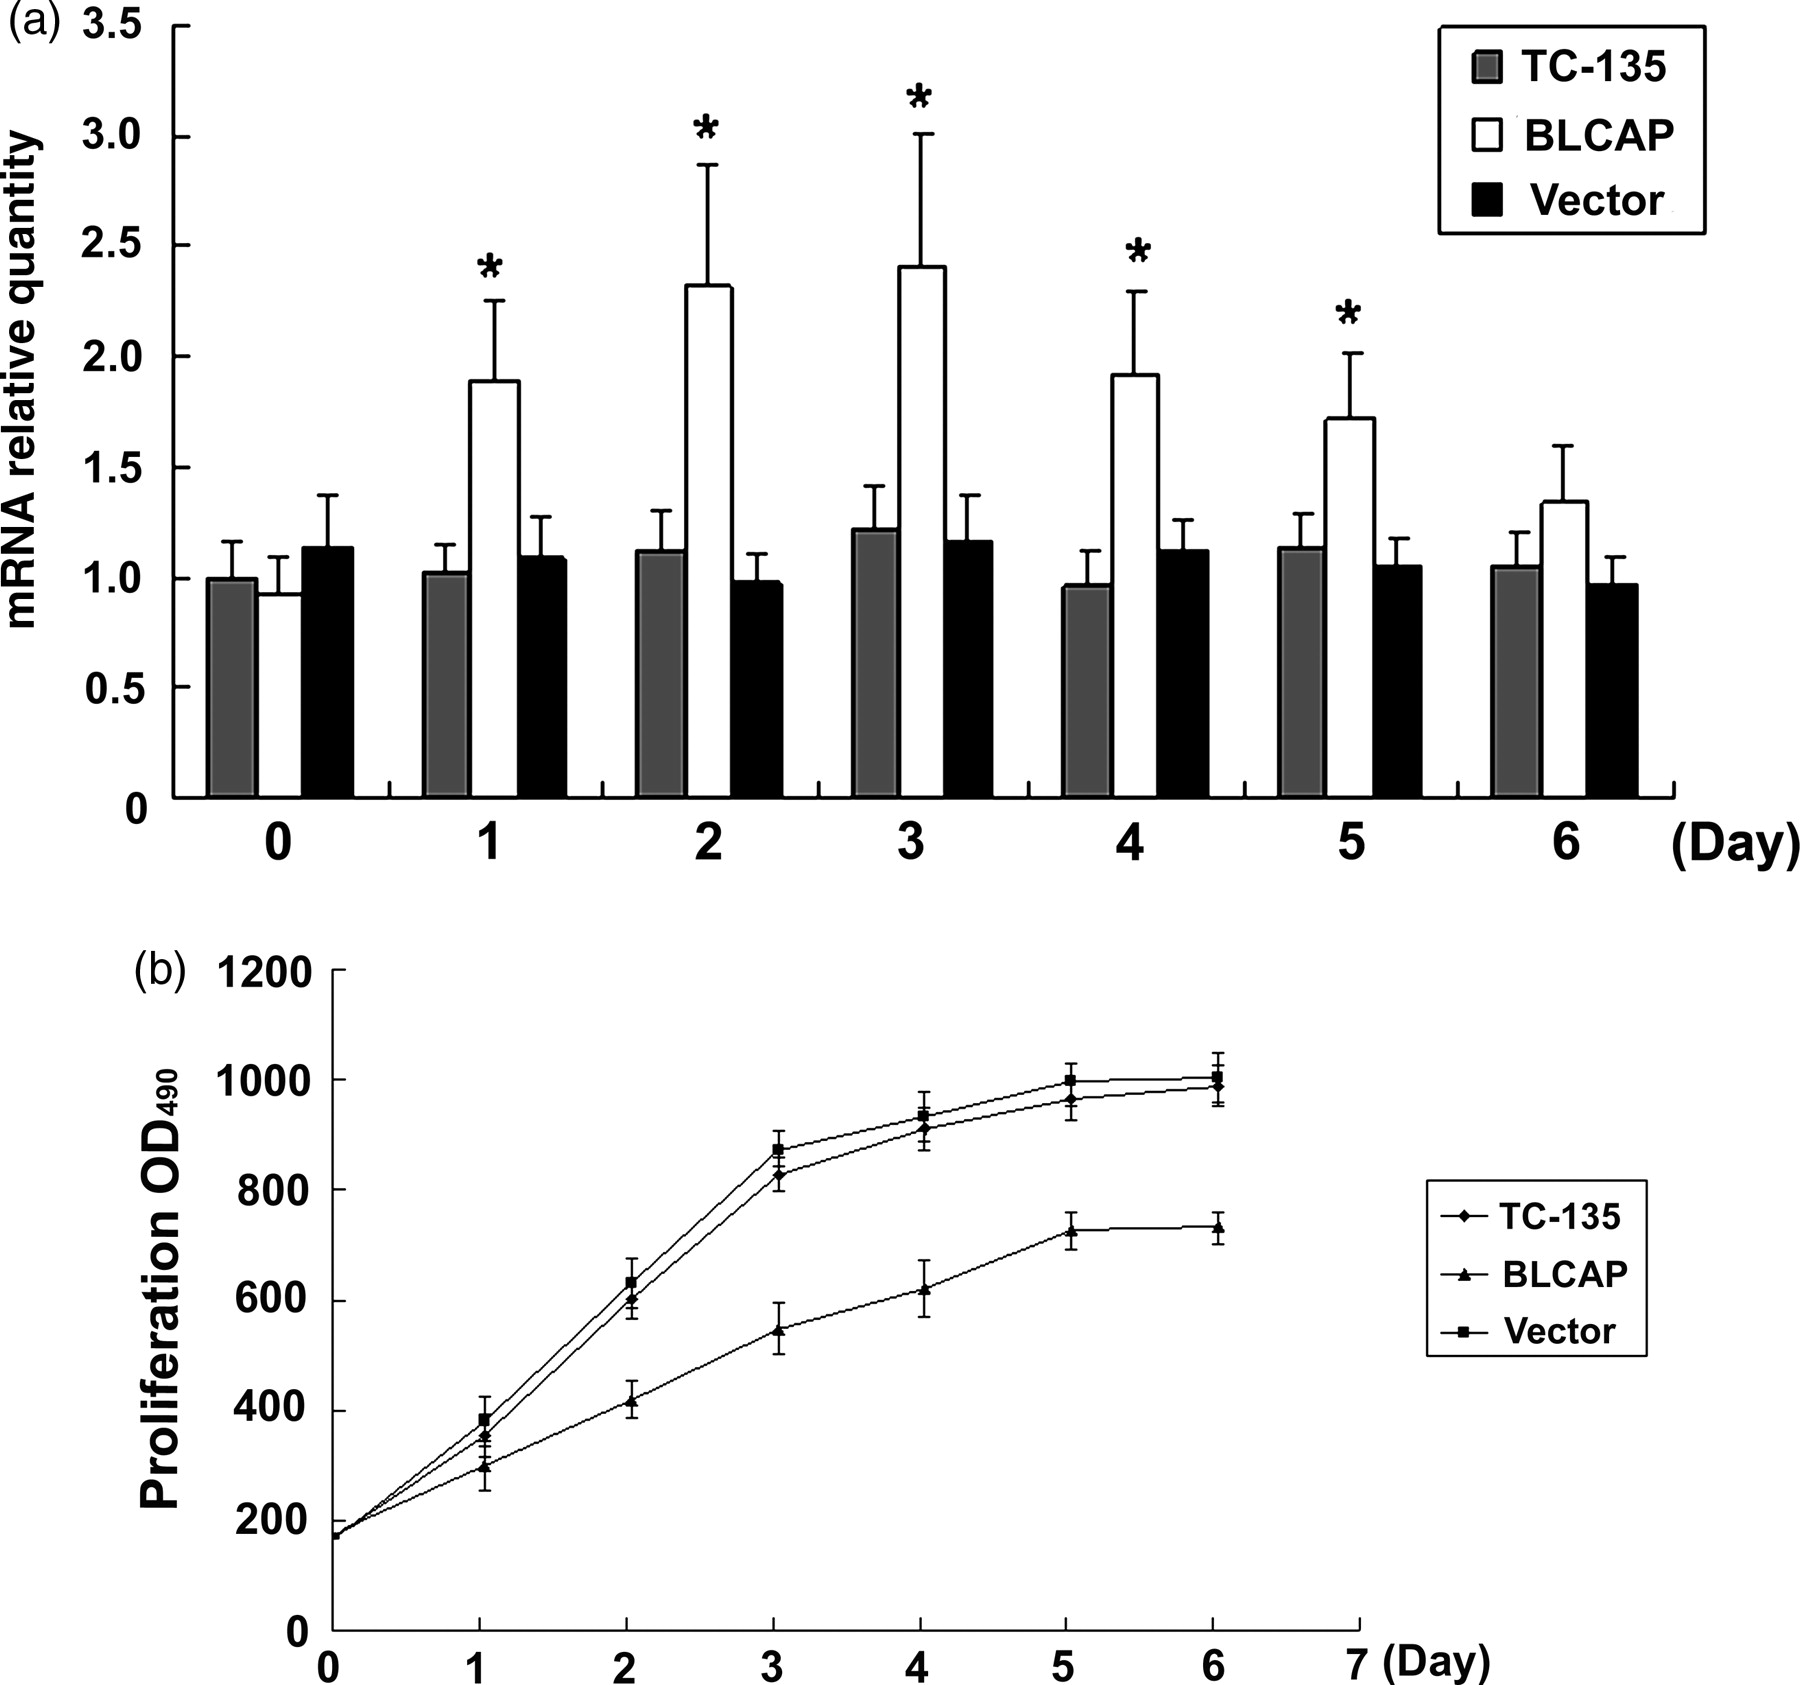
Analysis of cell growth curves. Known numbers of single cells were plated into culture dishes in RPMI1640 containing 10% FBS. After transfection, BLCAP mRNA was assayed using realtime PCR at different time points. Meanwhile, cells were stained by MTT and measured at different time points too. Data are representative of three independent experiments. (a) Expression levels of BLCAP detected using realtime PCR at different time point; (b) cell growth curves. When BLCAP was overexpressed, cells growth rate was significantly inhibited as compared with vector control or TC-135 cells (*P < 0.05) (Dunnett's t-test). BLCAP, bladder cancer-associated protein; FBS, fetal bovine serum; MTT, (4,5-dimethylthiazol-2-yl)-2,5-diphenyltetrazolium bromide; PCR, polymerase chain reaction
BLCAP promotes the apoptosis process of TC-135 cells
We suspected that the growth inhibition of TC-135 cells is caused by apoptosis. To confirm this hypothesis, the floating cells were collected 48 h after transfection and double stained by Annexin V/PI. We found that 48 h after transfection, the apoptosis rate in p3xFLAG-CMV-14-BLCAP transfected cells was 21.57% more than that in parental TC-135 cells or blank vector transfected cells (Figure 4).
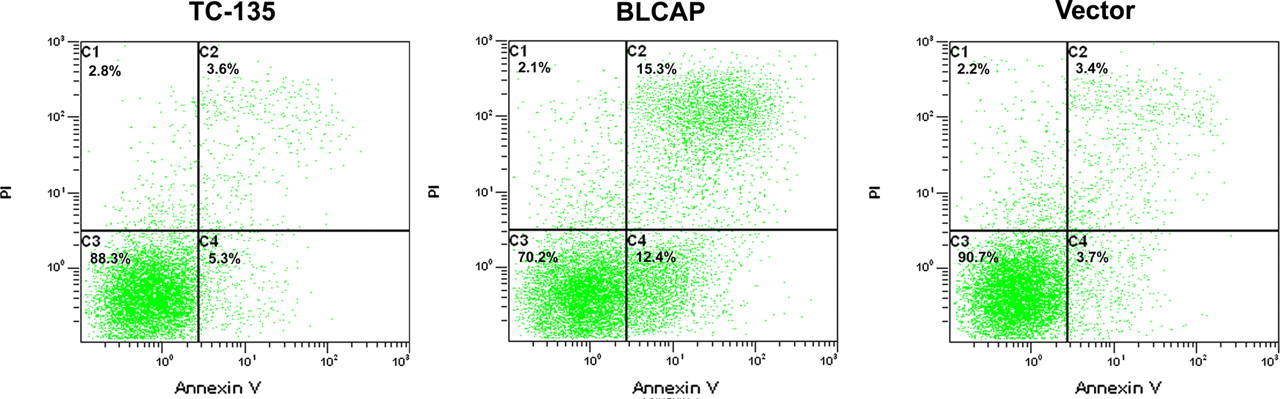
Effects of BLCAP overexpression on apoptosis of human TC-135 Ewing's sarcoma cells. Known numbers of single cells were plated into culture dishes in RPMI1640 containing 10% FBS. After 48-h transfection, cells were harvested by trypsinization and then the proportion of apoptotic cells was assayed by Annexin V/propidium iodide (PI) double staining. The proportion of apoptotic cells were significantly increased after transfection of BLCAP recombinant. BLCAP, bladder cancer-associated protein; FBS, fetal bovine serum (A color version of this figure is available in the online journal)
To confirm the induction of apoptosis by BLCAP expression, we tested the activity of caspase-3/7, a key caspase involved in both the death receptor pathway and the mitochondrial apoptotic pathway. The activity of caspase-3/7 was significantly increased in cells transfected with the BLCAP construct at 48 h post-transfection, as compared with non-transfected cells (291.7 ± 14.3% versus 114.1 ± 14.9%, P < 0.01; Figure 5).
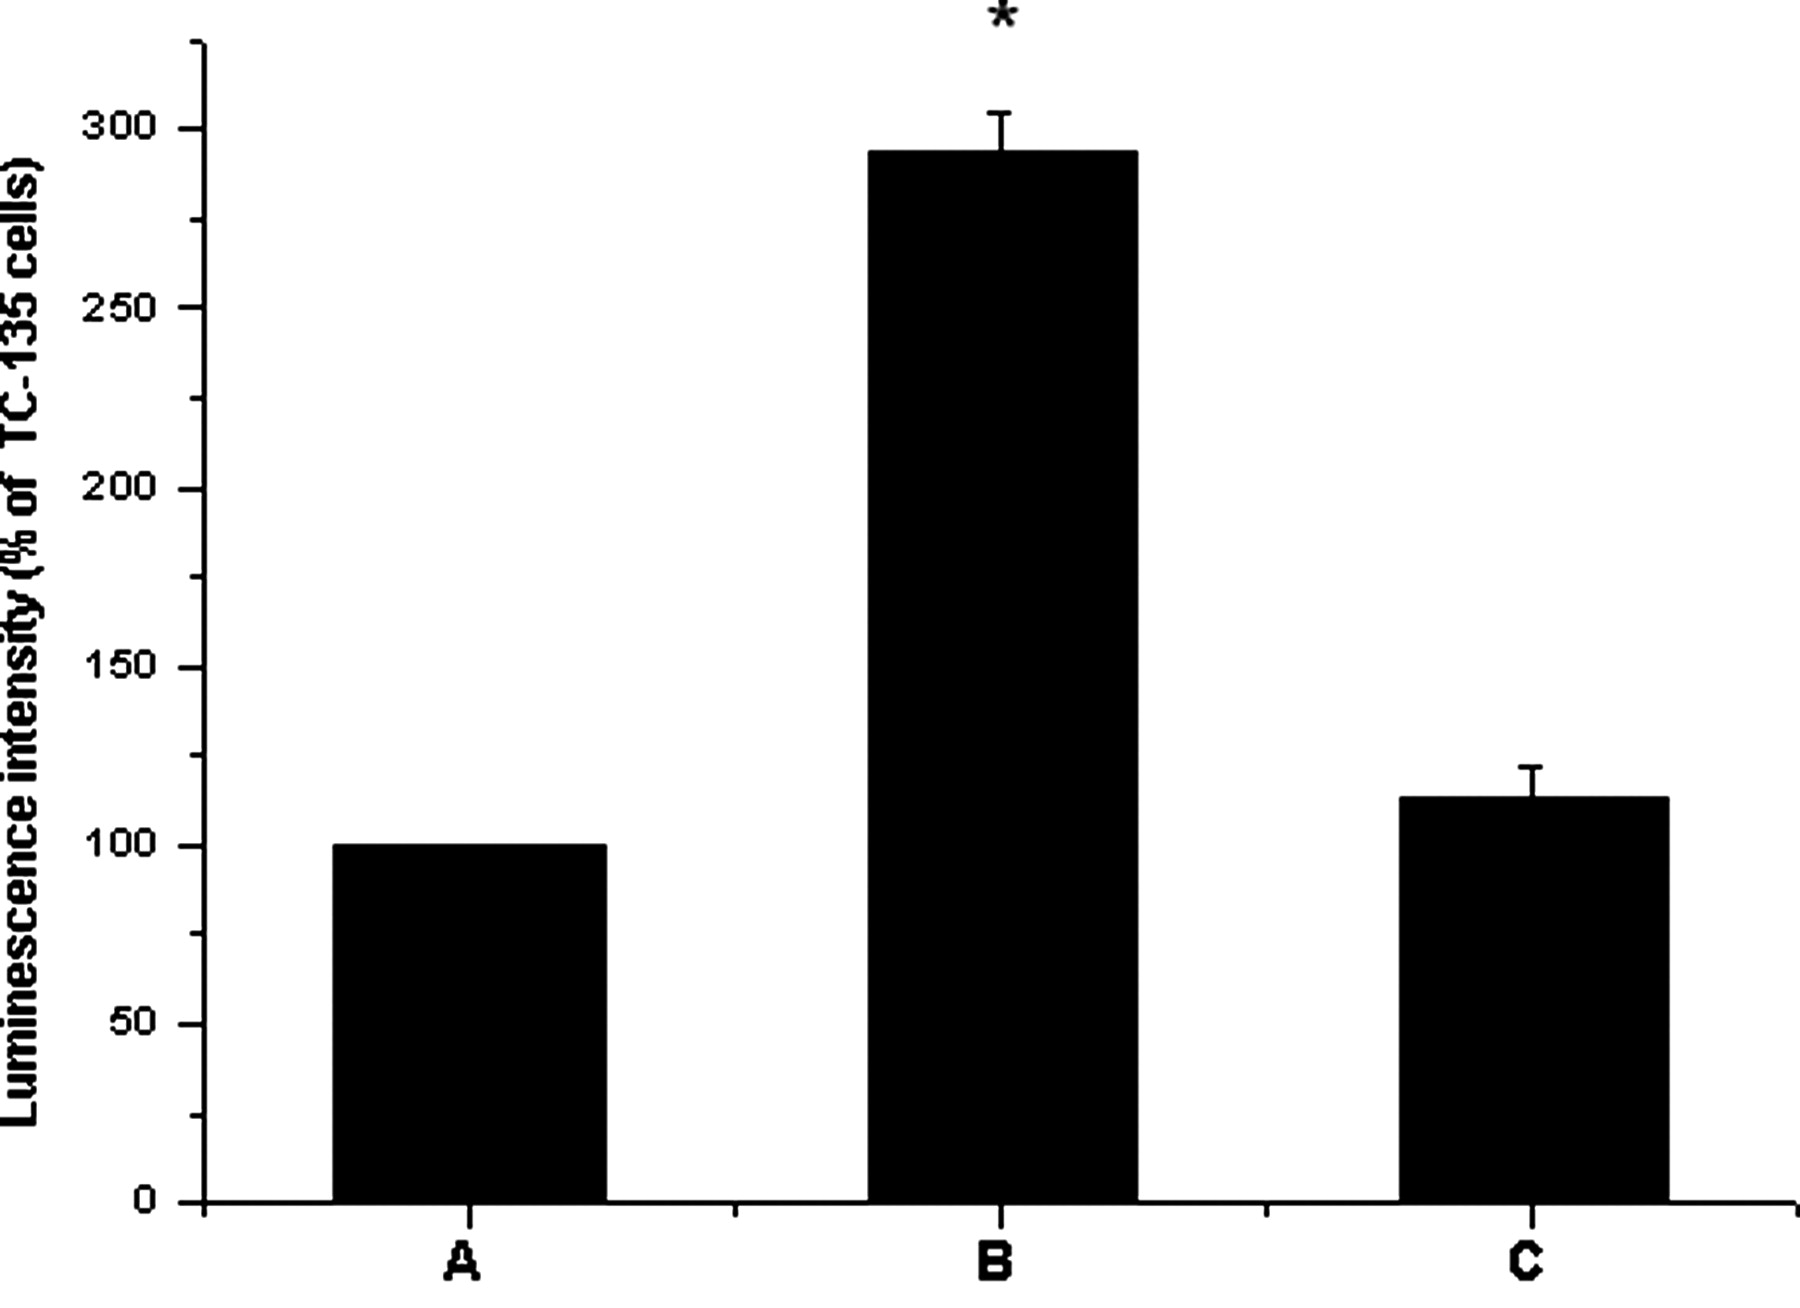
Effects of BLCAP overexpression on caspase-3/7 activity in human TC-135 Ewing's sarcoma cells. (A) TC-135; (B) TC-135 transfected with BLCAP recombinant; (C) TC-135 transfected with the blank vector. *P < 0.01 versus the control group (Dunnett's t-test)
BLCAP down-regulates the expression of genes related to apoptosis
To further investigate the mechanism of BLCAP in promoting apoptosis, we analyzed expressions of several key apoptosis genes influenced by overexpression of BLCAP. Realtime PCR results indicated that compared with TC-135 controls, when BLCAP was overexpressed, the EWS-FLI1 mRNA was significantly decreased to 58.11 ± 10.68% (P < 0.05), BCL-2 mRNA was significantly decreased to 41.62 ± 11.37% (P < 0.05) and caspase-3 mRNA was increased to 207.06 ± 25.28% (P < 0.05; Figure 1).
Consistent with the changes at the transcriptional level, protein expression levels of EWS-FLI1 (75.11 ± 4.32%) and BCL-2 (70.35 ± 5.71%) were significantly decreased, and caspase-3 (17 kDa) (123.19 ± 4.67%) was significantly increased (P < 0.01), as compared with that of the control cells (Figure 2).
Discussion
BLCAP is a novel candidate tumor suppressor which is down-regulated in invasive bladder carcinoma. Some reports showed that overexpression of BLCAP could inhibit cell growth by inducing apoptosis and S-phase arrest in HeLa cells and human Tca8113 tongue cancer cells. 15,16 It has been reported that the growth inhibition is correlated with up-regulation of p21 and down-regulation of BCL-XL and BCL-2, with no effect on p53 and nuclear factor (NF)-κB. Thus it has been concluded that the regulatory effect of the BLCAP gene on apoptosis and the cell cycle is independent of p53 and NF-κB.
In this study, the overexpression of BLCAP in TC-135 cells inhibited cell proliferation and promoted apoptosis even as the activity of caspase-3/7 was enhanced, indicating that BLCAP may induce apoptosis in TC-135 cells.
Moreover, our study showed that EWS-FLI1 was decreased after BLCAP was overexpressed. Both mRNA and protein levels of EWS-FLI1 were decreased while cell growth was inhibited, and apoptosis of cells was induced significantly. It has been previously reported that EWS-FLI1 is related to tumor cell proliferation and apoptosis. 3–5,17 Our results were consistent with these reports and suggest that BLCAP may play a role as a tumor suppressor via inhibitory effects on the expression of EWS-FLI1.
While the expression of BLCAP increased, BCL-2 mRNA and protein levels were significantly decreased. Koty et al. 18 reported that the antisense BCL-2 oligonucleotide inhibited cell proliferation, down-regulated BCL-2 expression and increased DNA fragmentation in non-small-cell lung cancer cells. Huang examined p53, p21, bax and BCL-2 genes by reverse transcription PCR to study apoptosis mediated by Phyllanthus urinaria. It showed that P. urinaria induced apoptosis accompanied by dose-dependent down-regulation of BCL-2 gene expression, while others were not significantly changed. 19 Our present results are consistent with the previous report and indicate that the BLCAP gene may down-regulate the BCL-2 gene and play an active role in apoptosis.
As we know, caspase-3 plays a key role in both the death receptor pathway and the mitochondrial apoptotic pathway. It cleaves a wide range of cellular substrates including structural proteins and DNA repair enzymes. It also activates an endonuclease caspase-activated DNase, which causes DNA fragmentation. 20 In the present study, caspase-3 expression was significantly increased concomitant with the increased expression of BLCAP. It has been reported that the activated form of caspase-3 is the p17 (17 kDa) fragment. 21 In our study, the 17 kDa protein was significantly increased. This indicated that as an executor of apoptosis, caspase-3 protein was activated during apoptosis induced by BLCAP expression.
In summary, our present study suggests that BLCAP may induce cell apoptosis through the down-regulation of BCL-2 and EWS-FLI1 in human Ewing's sarcoma cells. BLCAP may be a useful therapeutic target for human Ewing's sarcoma. The potential therapeutic outcomes and possible treatments will encourage us to explore this area of gene therapy.
Footnotes
Acknowledgements
We thank Xi-Ying Yao for her help in our experiments. The National Natural Science Foundation of China (81071691), the National Science and Technology Major Project (2011ZX09102-001-21), the Medical and Health Research Foundation of PLA (06H039) and the Natural Science Foundation of Shannxi Province, China (2010JM4008) provided grant support.