
Abstract
Hypersplenism is a condition in which the spleen is overactive. It is common in patients with cirrhosis-related portal hypertension. The over-activated hemophagocytic splenic macrophages are an important cause of hypersplenism. MicroRNAs (miRNAs) are 21–22 nt single-stranded RNAs expressed endogenously, which play important roles in many diseases. We have found by microarray, previously, that miR-615-3p is highly expressed in splenic macrophages of hypersplenism. In this study, we found that miR-615-3p enhanced the phagocytic capacity of splenic macrophages. Bioinformatics analysis indicated that ligand-dependent nuclear receptor corepressor (LCoR) was a potential phagocytosis-related target of miR-615-3p. This was proved by dual luciferase assay and Western blot in THP-1 cells and normal/hypersplenisum splenic macrophages. Our results showed that the presence of miR-615-3p repressed the expression of LCoR, a derepressor of peroxisome proliferator-activated receptor gamma (PPARγ), which has been confirmed to be able to promote the phagocytic capacity of macrophages. In conclusion, high expression of miR-615-3p in over-activated splenic macrophages depresses LCoR expression, low level of LCoR derepresses the expression of PPARγ and finally upregulated PPARγ enhances the phagocytic capacity of splenic macrophages. This finding might be useful in the study of hypersplenism and other macrophage-associated diseases.
Introduction
microRNAs (miRNAs) are a class of regulatory, single-stranded, non-coding 21–22 nt RNAs that attenuate gene expression post-transcriptionally through base pairing with the 3′ untranslated region (UTR) of their target mRNAs. 1 For most miRNA–target interactions, miRNAs affect gene expression and/or induce degradation of the target gene mRNAs, 2 and further regulate the protein output. 3 They control many cell functions and play important roles in human diseases. 4
Hypersplenism refers to exaggeration of the hemolytic function of the spleen, resulting in deficiency of peripheral blood elements, hypercellularity of bone marrow and splenomegaly. Hypersplenism can be caused by tumors, anemia, malaria, tuberculosis, and various connective tissue and inflammatory diseases. 5,6 In China, hypersplenism is common in patients with cirrhosis-related portal hypertension. Severe hypersplenism is an independent risk factor for developing variceal bleeding, spontaneous bacterial peritonitis and death in patients. The incidence rate of hypersplenism in patients with cirrhosis has ranged from 11% to 64%. 7,8 It is unclear why some patients with cirrhosis develop marked hypersplenism while others do not. Although the pathogenesis of hypersplenism has not yet been identified, it is generally accepted that cytopenias result predominantly from the increased phagocytosis and destruction of hemocytes in splenic macrophages. 9
Our prior studies have indicated that the phagocytic capacity of splenic macrophages is augmented in hypersplenism, but the mechanism is not clear. 10,11 In a former study, we have investigated the miRNAome in splenic macrophages from normal and portal hypertensive spleen samples by microarray, and identified 99 different expressions of miRNAs in splenic macrophages of hypersplenism. Among the miRNA expressions identified in that study, miR-615-3p was significantly upregulated in hypersplenism. We predict that ligand-dependent nuclear receptor corepressor (LCoR) is possibly one of the targets of miR-615-3p, but have no experimental validation. 12 This study is aimed at revealing the relationship between miR-615-3p and macrophage function.
Materials and methods
Patients
Spleen tissues were obtained from 20 patients (15 men and 5 women) who underwent splenectomy for hypersplenism or splenic rupture. The diagnosis of cirrhosis and portal hypertension was made based on clinical features, results of laboratory tests and ultrasonography. In this regard, hypersplenism is defined by anemia, leukopenia or thrombocytopenia with splenomegaly. Traumatic rupture of the spleen was enrolled in the control group. Hepatitis, cirrhosis, history of hypersplenism, and abnormalities in postoperative laboratory findings and pathological examinations were absent in the control group participants. All patients provided written informed consent, and the hospital's ethics committee approved the protocol. 12
Cell culture and RNA extraction
THP-1 cells were obtained from the American Type Culture Collection, and maintained in RPMI-1640 (Invitrogen, Carlsbad, CA, USA) supplemented with 10% fetal bovine serum, 4 mmol/L Glutamax I and 25 mg/mL gentamicin (Invitrogen). Splenic macrophages were isolated and purified by anchored cultivation from all the patients according to the protocol described before, 13 and macrophage purity was >95% as determined by non-specific esterase staining. Total RNA was isolated with TRIzol reagent (Invitrogen) as previously described. 14
Phagocytic capacity measurement
Vybrant Phagocytosis Assay Kit (V-6694) (Molecular Probes, Inc, Eugene, OR, USA) was used in this study. The viability of the splenic macrophages was detected as >90%. The final cell concentration was adjusted to 106 cells/mL by adding RPMI-1640 medium. The negative-control wells were prepared by adding 750 μL of RPMI-1640 medium into each of four wells on the 24-well microplate, while the positive-control wells were prepared by adding 750 μL of the untreated splenic macrophages suspension into four wells. Three groups of experimental wells (4 wells per group) were prepared by adding 750 μL of differently treated splenic macrophages suspension. The loaded microplate was incubated for one hour to allow the cells to adhere to the microplate surface. Then the RPMI-1640 medium was removed from all of the wells and 500 μL of the prepared fluorescein-labeled Escherichia coli (K-12 strain) was added in, followed by a two-hour incubation. After that, the E. coli suspension was removed, with 500 μL trypan blue suspension added immediately, followed by one-minute incubation at room temperature. Then the excess trypan blue suspension was removed, and 200 μL phosphate-buffered saline (PBS) was added for re-suspension. The percentage of the macrophages taking up fluorescent BioParticle suspension was determined by flow cytometry (Abs/Em: 494/518 nm). Data from all the experimental wells would subtract the data of the negative control. The positive control wells were used to judge the phagocytic capacity difference from experimental wells.
miRNA expression analysis by quantitative reverse transcription realtime polymerase chain reaction
Reverse transcription (RT) reaction was done with 5 ng of total RNA and using TaqMan MicroRNA Reverse Transcription Kit (P/N: 4366596; Applied Biosystems, Foster City, CA, USA) and miRNA-specific stem–loop primers. The expression of mature miRNAs was assayed using the Taqman MicroRNA Assays specific for miR-615-3p (P/N: 4380991), and miR-16 Assays (P/N: 4373121) was used to normalize the relative abundance of target miRNA. The expression level of miR-615-3p in THP-1 cells was also measured. Each sample was analyzed in triplicate. Quantitative reverse transcriptase-polymerase chain reaction (QRT-PCR) was done using the standard Taqman MicroRNA Assays protocol in the iCycler iQ5 Real-Time PCR Detection System (Bio-Rad, Hercules, CA, USA). The 20 μL PCR mix was made up of 1.33 μL RT product, 10 μL Taqman Universal PCR Master Mix, No AmpErase UNG (P/N 4324018), 0.2 μmol/L Taqman probe, 1.5 μmol/L forward primer and 0.7 μmol/L reverse primer. The reactions were incubated at 95°C for 10 min, followed by 40 cycles at 95°C for 15 s and 60°C for one minute. The level of miRNA expression was measured using the threshold cycle (Ct).
PPARγ QRT-PCR analysis
We assessed peroxisome proliferator-activated receptor gamma (PPARγ) levels of splenic macrophages in six cases of hypersplenism and six normal people by QRT-PCR. Actin mRNA was used as normalization control. Total RNA from splenic macrophages was isolated with TRIzol reagent (Invitrogen) according to the manufacturer's protocol. QRT-PCR was performed using the reverse transcription kit (PrimeScript® RT Master Mix; Takara Bio Inc, Shiga, Japan) and Sybr Green 2 × quantitative PCR master mix (TakeraSYBR® Premix Ex Taq™ II; Takara Bio Inc). The following PCR primers were used: PPARγ (NM_138711), forward 5′ GAG CCC AAG TTT GAG TTT GC 3′ and reverse 5′GCA GGT TGT CTT GAA TGT CTT C3′; ACTB (NM_001101), forward 5′ ACC TTC TAC AAT GAG CTG CG 3′ and reverse 5′ CCT GGA TAG CAA CGT ACA TGG 3′. The reactions were incubated in a 96-well plate at 95°C for 30 s followed by 40 cycles at 95°C for 30 s, 56°C for 30 s and 72°C for 30 s. The level of miRNA expression was measured using Ct.
Construction of plasmids expressing miR-615-3p
Expression plasmids of miR-615-3p were created by PCR amplification using human genomic DNA as a template. The primers are as follows: miR-615-3p, forward 5′ CCC AAG CTT GGG CAT AAT TGG ATC ATA GGA AC 3′ and reverse 5′ CCG GAA TTC CGG GTG AAT AGC TTG CAG CGT TC 3′. The reactions were incubated in tubes with 30 cycles of 98°C for 10 s and 64°C for 30 s. The PCR product (518 bp) was digested with HindIII and EcoRI, followed by insertion into a HindIII- and EcoRI-open pcDNA 3.1(+) vector (Invitrogen) and confirmed by DNA sequencing.
Upregulating miR-615-3p expression in cells
pcDNA 3.1-pri-miR-615-3p vectors was transfected into THP-1 cells using Lipofectamine 2000 (Invitrogen), and stable cells were selected in medium containing G418. Individual G418 resistant clones were picked and expanded to cell lines by limiting dilution assay. We isolated a cell clone which extremely over-expressed miR-615-3p, and named it THP-1 miR-615-3p cell clone. pcDNA 3.1 (+) empty vectors were transfected in THP-1 cells and picked up stably expressed clones as empty vector controls. pcDNA 3.1-pri-miR-615-3p vectors were transfected in normal splenic macrophages for high expression of miR-615-3p in the normal cells, and harvested the cells at 24 h after transfection.
Downregulating miR-615-3p expression in cells
Anti-miR™ Negative control (locked nucleic acid [LNA] oligonucleotides negative control) and Anti-miR™ miRNA inhibitors (LNA oligonucleotides against miR-615-3p) were obtained from Ambion (Austin, TX, USA). Knockdown oligos were transfected by siPORT NeoFX Transfection Agent (Ambion) in THP-1 cells and hypersplenism splenic macrophages at a final concentration of 30 nmol/L. Cells were collected after 24 h, and analyses of miRNA, mRNA and protein levels were conducted.
Construction of 3′UTR reporter and dual luciferase reporter analysis
The human LCoR 3′UTR target site and 200 nt up- and downstream were amplified by PCR using the primers 5′-CCC AAG CTT GGG ACG TAG TTT CTA AAA GGG G-3′ (LCoR-3′UTR-F) and 5′-GGA CTA GTC CGA ATA CTG TAG AGT GCC AAT-3′ (LCoR-3′UTR-R). The PCR product (424 bp) was digested with SpeI and HindIII, followed by insertion into a SpeI- and HindIII-open pMIR-REPORT luciferase vector (Ambion). We named the constructed vector pMIR-LCoR-3′UTR. To build a nonsense control, mutated versions of these constructs, carrying 4-bp substitutions in the miR-615-3p target site, were obtained by site-directed mutagenesis, and the nonsense vector constructed was named pMIR-nonsense control. THP-1 cells or splenic macrophages were preplated in 48-well plates, and the cells in each well were transfected with 450 ng of either pMIR-LCoR or pMIR-nonsense control together with 50 ng of pRL-TK vector (Promega, Madison, WI, USA) containing Renilla luciferase and 30 nmol of miR-615-3p inhibitor or negative control. Transfection was done using Lipofectamine 2000 and Opti-MEM I medium (Gibco, Grand Island, NY, USA) in a final volume of 250 μL, and each transfection was repeated twice in triplicate. Firefly and Renilla luciferase activity were measured using the Dual Luciferase Reporter Assay (Promega) 24 h after transfection.
Western blot analysis
THP-1 cells or splenic macrophages were seeded in six-well plates and were transfected six hours later. The cells were harvested 24 h after the first transfection, washed in PBS and lysed in radioimmune precipitation (RIPA) buffer containing 1 mmol/L Pefabloc (Roche Applied Science, Indianapolis, IN, USA). An aliquot was used for protein concentration determination with BCA protein Quantitation Kit (Pierce Biotechnology, Rockford, IL, USA), and 80 μg of protein/lane was separated on a 10% NuPAGE Bis-Tris gel and transferred onto a nitrocellulose membrane (Millipore Biotechnology Inc, Bedford, MA, USA). The transferred membranes were incubated overnight at −4°C with Rabbit anti-Mouse LCoR polyclonal antibody (1:400 dilutions; Lifespan Biosciences, Seattle, WA, USA) or rabbit polyclonal PPARγ antibody (1:500 dilutions; Santa Cruz Biotechnology, Santa Cruz, CA, USA) in PBS-T (PBS containing 0.05% Tween-20) that contained 5% skim milk. After washing four times in PBS-T, the membranes were incubated with horseradish peroxidase-conjugated secondary goat anti-rabbit polyclonal antibody (Beijing Biosynthesis Biotechnology Inc, Beijing, China) at a dilution of 1:5000 in PBS-T for one hour at room temperature. After four additional washes with PBS-T, the signals were visualized by Super-Signal detection systems (Millipore Biotechnology Inc) and exposed to film. An internal β-actin goat anti-rabbit polyclonal antibody (Beijing Biosynthesis Biotechnology Inc) was used to normalize the protein expression. Quantification of Western blot was performed by densitometry using the Quantity-One software 4.6.2 (Bio-Rad), and expressed as the ratio between the optical density of the LCoR or PPARγ band and the β-actin band.
Databases and statistical analysis
We computationally screened target genes of miR-615-3p with the Target Scan program (
Results
In one of our previous studies, we compared the miRNA expressions in splenic macrophages in hypersplenism and normal splenic macrophages, and identified 99 miRNA expression differences between the two groups, among which only hsa-miR-615-3p (MIMAT0003283, miRBase release 10.0: August 2007) was significantly upregulated in the splenic macrophages of the hypersplenism cases. The microarray data were also proved by QRT-PCR. In the present study, we further investigated the mechanism of miR-615-3p in splenic macrophages.
Bioinformatics analysis of miR-615-3p
miR-615-3p belongs to the miR-615 family, which has a seed region of CCGAGCC. The hsa-miR-615 is located in chromosome 12:52,713,537–52,714,560 and has overlapping transcripts with intron 1 of Homobox protein C5 (HOXC5). A top predicted target of miR-615-3p is LCoR. We found only one evolutionary conserved target sequence for miR-615-3p in the 3′UTR of LCoR, located at the 193 bp downstream of the stop codon. The 3002 nt 3′UTR of LCoR was screened for complementarity to seed sequences of known miRNAs via a bioinformatic search. A 100%-match target sequence for miR-615-3p at nt 193–200 was found (Figure 1a). Comparing the human sequence for interspecies homology, we found that the miR-615-3p target sequence is highly conserved among four species (Figure 1b).

miR-615-3p target site. (a) The location of the putative miR-615-3p target site. The putative miR-615-3p target site resides at nt 193–200 of the LCOR-3′UTR. First eight nucleotides of miR-615-3p and its target region: normal font, unpaired bases; underlined, the duplex bases. (b) Comparison of nucleotides between the miR-615-3p seed-sequence and its target in four species. The target region of miR-615-3p is highly conserved in four species. LCoR, ligand-dependent nuclear receptor corepressor
miR-615-3p inhibitor decreased the phagocytic capacity of splenic macrophages in hypersplenism
We have found in our early studies that the splenic macrophages in hypersplenism have stronger phagocytic capacity than normal splenic macrophages. 10,15 In the present experiment, freshly isolated hypersplenism splenic macrophages were transfected by miR-615-3p inhibitor, provided anti-miR negative control or liposome (the anti-miR negative control and liposome were set as controls). It was found that the phagocytic capacity decreased with the transfection of miR-615-3p inhibitor, and there was significant difference between the negative control samples and the liposome control samples. It was shown that downregulation of miR-615-3p could decrease the phagocytic capacity of splenic macrophages in hypersplenism (Figure 2).
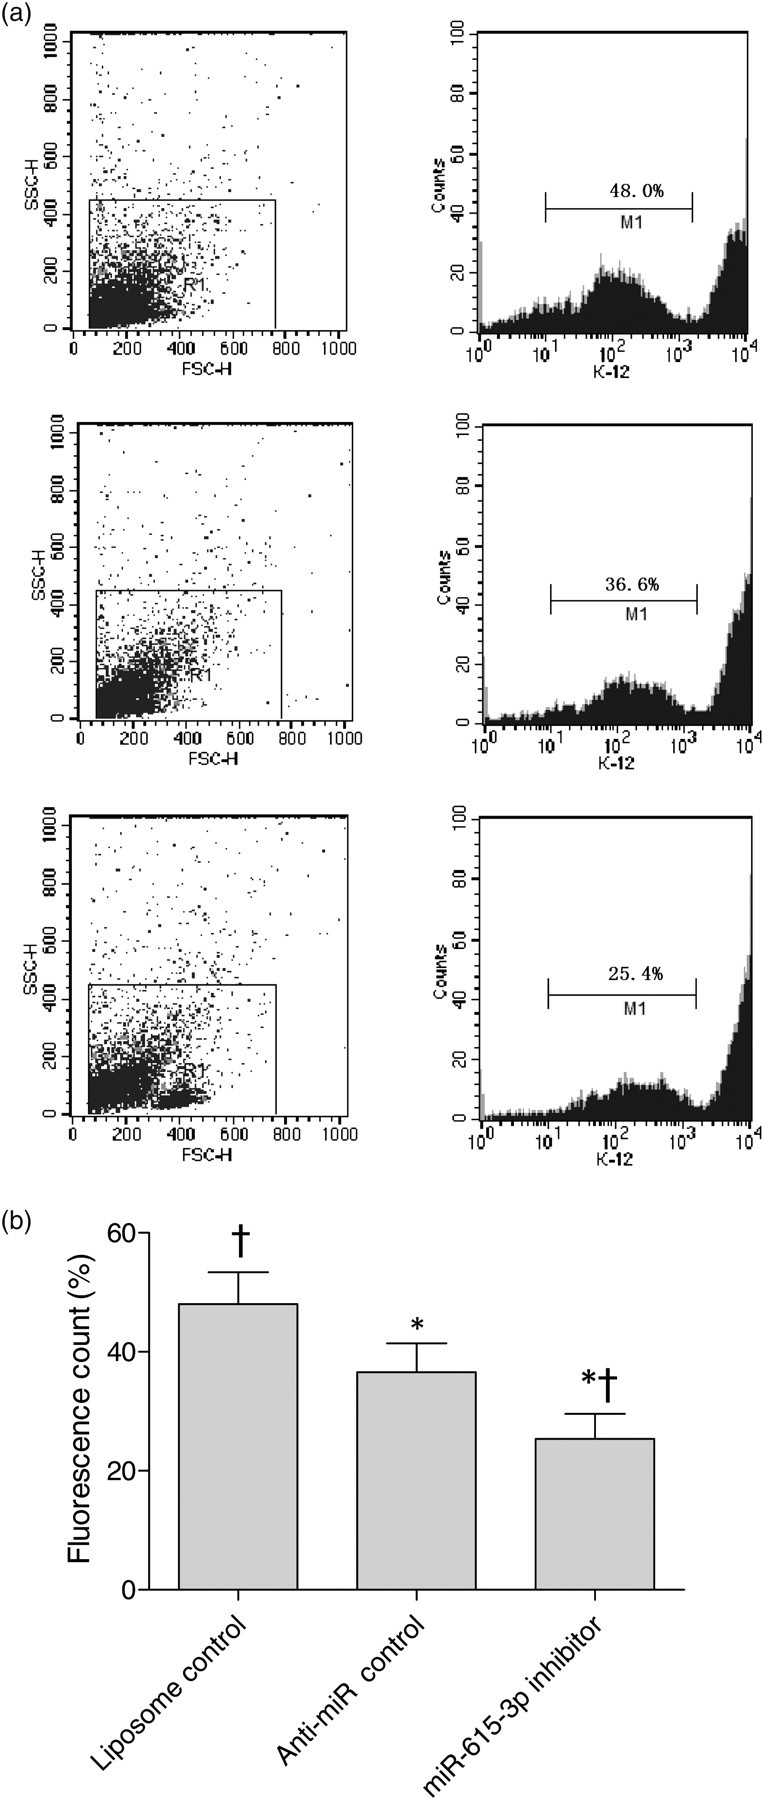
miR-615-3p inhibitor decreased the phagocytic capacity of hypersplenism splenic macrophages. (a) Phagocytic capacity assay in hypersplenism splenic macrophages. The phagocytic capacity of hypersplenism splenic macrophages was transiently transfected by liposomes, anti-miR negative control or miR-615-3p inhibitor. The diagram shows the phagocytostic capacity, in which M1 represents gating for engulfing cells. The phagocytosis rates of the three groups were 48.0%, 36.6% and 25.4%, respectively. (b) The phagocytic capacity of hypersplenism splenic macrophages. The transfection of miR-615-3p inhibitor depressed the phagocytic capacity of splenic macrophages in hypersplenism dramatically compared with that in the other two control groups (*P < 0.05 versus liposome control; † P < 0.05 versus anti-miR control)
Upregulation of miR-615-3p increased the phagocytic capacity of normal splenic macrophages
To get more evidence of miR-615-3p-related phagocytic capacity of splenic macrophages, we used pcDNA 3.1-pri-miR-615-3p, a cytomegalovirus (CMV)-driven expression plasmid that we constructed, for high expression of miR-615-3p in normal splenic macrophages. It was found that the splenic macrophages upregulated by pcDNA 3.1-pri-miR-615-3p took up more fluorescein-labeled E. coli than the macrophages transfected with empty plasmid or liposomes (P < 0.05). There was no significant difference between the two control groups (Figure 3).
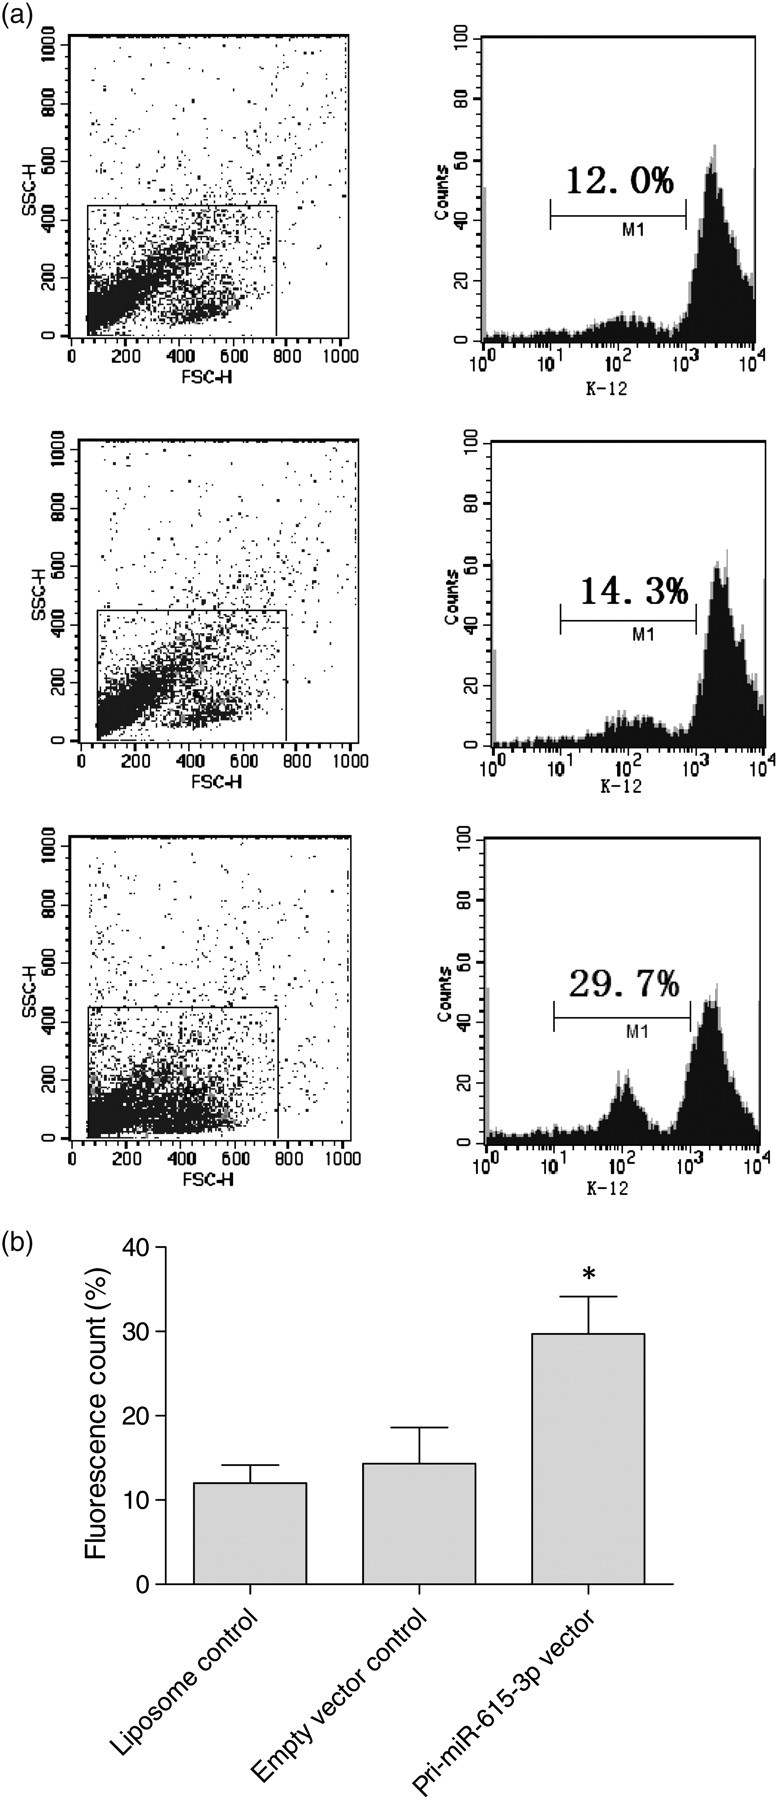
Upregulation of miR-615-3p increased the phagocytic capacity of normal splenic macrophages. (a) Phagocytic capacity assay in normal splenic macrophages. Normal splenic macrophages were transiently transfected with liposome, empty vector or pri-miR-615-3p vector, and the phagocytic capacity in each group was measured. The phagocytosis rates of the three groups were 12.0%, 14.3% and 29.7%, respectively. (b) The phagocytic capacity of normal splenic macrophages. The normal splenic macrophages transfected with miR-615-3p expression vector were upregulated significantly compared with those in the two control groups (*P < 0.05)
Validation of miR-615-3p binding sites within LCoR 3′UTRs
To directly assess the impact of miR-615-3p on LCoR-3′UTR, we cloned the 402 bp 3′UTR into a pMIR-REPORT Luciferase vector (pMIR-LCoR-3′UTR). pRL-TK was used as a reference control. pMIR-LCoR-3′UTR and pRL-TK were co-transfected into THP-1 miR-615-3p cells, THP-1 empty vector control cells and THP-1 liposome control cells, respectively. The transfection of THP-1 miR-615-3p cells resulted in a pronounced reduction of luciferase activity compared with the transfection of miR-negative control cells (P < 0.05). What is more, the transfection of miR-615-3p inhibitor resulted in an increase in luciferase activity compared with that of anti-miR negative control. The co-transfection of pMIR-nonsense control and pRL-TK did not present significant difference. These data indicated that miR-615-3p bound to LCoR 3′UTR and thereby attenuated the expression of LCoR (Figure 4a).

Validation of miR-615-3p binding sites within LCoR 3′UTRs. (a) Dual luciferase reporter assay in THP-1 cells. PMIR-LCoR-3′UTR/pRL-TK was co-transfected with miR-615-3p inhibitor or anti-miR negative control into THP-1 cells or THP-1 miR-615-3p cells. PMIR-nonsense control was co-transfected in the same way. Firefly/Renilla luciferase activity of THP-1 cells was assayed 24 h after transfection. Compared with liposome control and anti-miR negative control, miR-615-3p inhibitor significantly increased luciferase activity (*P < 0.05). The luciferase activity was significantly decreased in THP-1 miR-615-3p cells (**P < 0.01). When transfected with pMIR-nonsense control, THP-1 cell showed almost the same luciferase activities in different groups. (b) Western blot of LCoR in THP-1 cells. A significant increase in protein levels was observed in the THP-1 cells transfected with miR-615-3p inhibitor, compared with that in liposome control and anti-miR negative control (*P < 0.05). THP-1 miR-615-3p cells, compared with empty vector control, reduced LCoR protein level significantly (**P < 0.01). LCoR, ligand-dependent nuclear receptor corepressor
The THP-1 cells transfected with pcDNA3.1-pri-miR-615-3p vector or miR-615-3p inhibitor were analyzed on Western blot, probed with an anti-LCoR antibody. The miR-615-3p inhibitor increased the expression of LCoR, and the THP-1 miR-615-3p cells decreased LCoR protein to almost undetectable levels. The cells transfected with the negative control did not exhibit any change in LCoR levels (Figure 4b).
Translation of LCoR was regulated by endogenous miR-615-3p in splenic macrophages
To further test the predicted miR-615-3p target site in the 3′UTR of LCoR, normal splenic macrophages were cotransfected with pMIR-LCoR-3′UTR together with pcDNA 3.1-pri-miR-615-3p or the empty vector control. The luciferase activity of the cells transfected with pcDNA 3.1-pri-miR-615-3p decreased significantly compared with that in the negative control cells (P < 0.05). Hypersplenism splenic macrophages were co-transfected with pMIR-LCoR-3′UTR together with miR-615-3p inhibitor or anti-miR negative control. The luciferase activity of the cells transfected with miR-615-3p inhibitor increased significantly compared with that of the anti-miR negative control samples. Co-transfection of pMIR-nonsense control and pRL-TK did not show remarkable difference (Figure 5a).
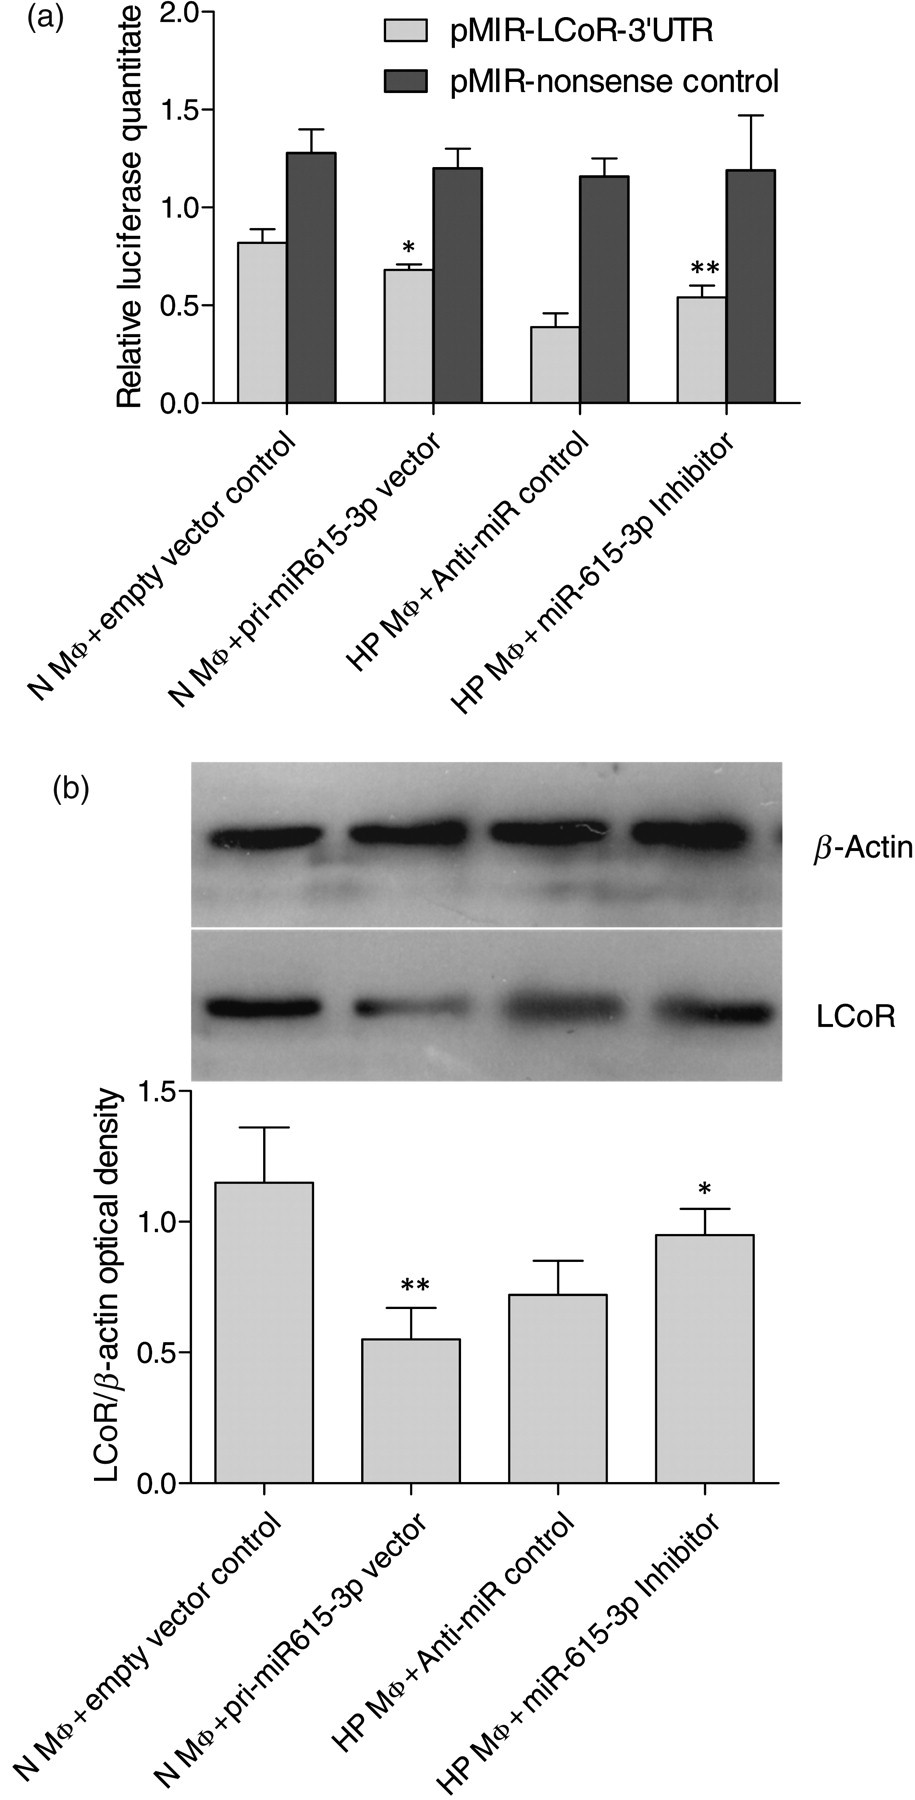
Endogenous miR-615-3p regulated LCoR in splenic macrophages. (a) Dual luciferase reporter assay in normal or hypersplenism spleen macrophages. PMIR-LCoR-3′UTR/pRL-TK was co-transfected with pri-miR615-3p vector or empty vector in normal spleen macrophages (N MΦ). miR-615-3p inhibitor or anti-miR negative control was transfected in hypersplenism splenic macrophages (HP MΦ). Co-transfection was re-conducted with PMIR-LCoR-3′UTR replaced by PMIR-nonsense control. Firefly/Renilla luciferase activity of macrophages was assayed 24 h after transfection. pri-miR-615-3p vector decreased luciferase activity significantly in normal splenic macrophages compared with empty vector control (*P < 0.05), while miR-615-3p inhibitor significantly increased luciferase activity in hypersplenism splenic macrophages compared with anti-miR negative control (**P < 0.01). In the pMIR-nonsense transfection, it was observed that luciferase activity was almost the same in different groups. (b) Western blot of LCoR in normal or hypersplenism spleen macrophages. Normal splenic macrophages transfected with pri-miR615-3p vector inhibited LCoR significantly (**P < 0.01). Hypersplenism splenic macrophages transfected with miR-615-3p inhibitor presented a significant increase in LCoR levels (*P < 0.05). LCoR, ligand-dependent nuclear receptor corepressor
Cell lysate from the normal splenic macrophages transfected with pcDNA 3.1-pri-miR-615-3p or empty vector and the splenic macrophages in hypersplenism transfected with miR-615-3p inhibitor or anti-miR negative control was analyzed by Western blot. It was observed that the LCoR expression was repressed by pcDNA 3.1-pri-miR-615-3p transfection in normal splenic macrophages, while it was repressed more in the splenic macrophages in hypersplenim. For the splenic macrophages in hypersplenim, the transfection with miR-615-3p inhibitor resulted in an increase of LCoR expression, compared with the transfection of anti-miR negative control (Figure 5b).
Different PPARγ expression levels in THP-1 cells and splenic macrophages
QRT-PCR and Western blot revealed that PPARγ mRNA and protein levels were sharply increased in hypersplenism splenic macrophages than in normal splenic macrophages (P < 0.01, Figure 6a). In contrast, PPARγ mRNA and protein levels in THP-1 cells increased substantially after transfection of pcDNA 3.1-pri-miR-615-3p (P < 0.01, Figure 6b).

Different PPARγ expression levels in THP-1 cells and splenic macrophages. (a) QRT-PCR analysis of PPARγ. QRT-PCR revealed that PPARγ mRNA levels sharply increased in hypersplenism splenic macrophages than in normal splenic macrophages (**P < 0.01). In contrast, PPARγ mRNA levels increased substantially in THP-1 miR-615-3p cells than in THP-1 cells transfected with empty vector (**P < 0.01). (b) Western blot analysis of PPARγ. Western blot revealed that PPARγ levels sharply increased in hypersplenism splenic macrophages, and an increased expression of PPARγ was observed in THP-1 miR-615-3p cells (**P < 0.01). PPARγ, peroxisome proliferator-activated receptor gamma; QRT-PCR, quantitative reverse transcriptase polymerase chain reaction
Discussion
Identification of disease-specific miRNAs and their targets is critical for understanding their role in pathogenesis of certain diseases and may help define novel therapeutic targets. miR-615-3p is found to be upregulated in the splenic macrophages in hypersplenism compared with that in the normal control. Although bioinformatic tools may help to reveal that putative LCoR might be the most likely target of miR-615-3p, experimental procedures are needed for validation.
Inhibition of the miR-615-3p, usually endogenously highly expressed in the splenic macrophages in hypersplenism, can downregulate the phagocytic capacity of the cells. In contrast, increasing the miR-615-3p level in normal splenic macrophages, which is endogenously low, may upregulate the phagocytic capacity. The results of this study reveal a positive correlation between the expression level of miR-615-3p and the phagocytic capacity of splenic macrophages. Given the results of dual luciferase reporter assay and Western blot experiments, a role for LCoR as a target of miR-615-3p appears to be established. However, the targets of miR-615-3p identified by computational prediction programs, such as TargetScan, have not previously been shown to be directly involved in the phagocytic capacity of macrophages. But the mechanism of LCoR as a corepressor of many nuclear receptors (NRs) may be associated with the phagocytic capacity of macrophages.
NRs are members of a superfamily of ligand-dependent transcription factors that regulate diverse aspects of reproduction, development, homeostasis and immune function. Upon ligand binding, some NRs undergo a conformational change that coordinately dissociates co-repressors and facilitates recruitment of co-activator proteins, thereby promoting transcriptional activation. 16 LCoR is probably the best known co-repressor of agonist-bound NRs. It can interact with a wide variety of NRs, e.g. estrogen receptor alpha, glucocorticoid receptor, progesterone receptor, vitamin D receptor and PPAR. 17 LCoR can repress the nuclear activity of PPARs by competing with co-activators and downstream effectors, such as histone deacetylases. 18,19 Its physiological function may be to act as an ‘emergency brake’, attenuating inappropriately activated target NRs. 20
PPARγ is a member of the nuclear hormone receptor family of ligand-dependent transcription factors. 21 PPARγ is expressed at lower levels in quiescent macrophages and highly upregulated in activated macrophages. PPARγ-dependent gene expression contributes to phagocytosis-associated cell factors (CD36, AXL, TG2 and PTX3) and its expression level is positively correlated with human macrophage phagocytic capacity. 22,23 As shown in our results, the splenic macrophages in hypersplenism are over-activated and highly express PPARγ endogenously. In hypersplenism splenic macrophages, high miR-615-3p level depresses the translation of LCoR while deregulated LCoR derepresses the activity of PPARγ, then the phagocytic capacity of splenic macrophages is upregulated, and more hemocytes are destroyed by splenic macrophages. This maybe part of the pathogenesis of hypersplenism. A proposed scheme of the mechanism is given in Figure 7, summarizing essential considerations of how miR-615-3p, LCoR and PPARγ affect macrophage function.
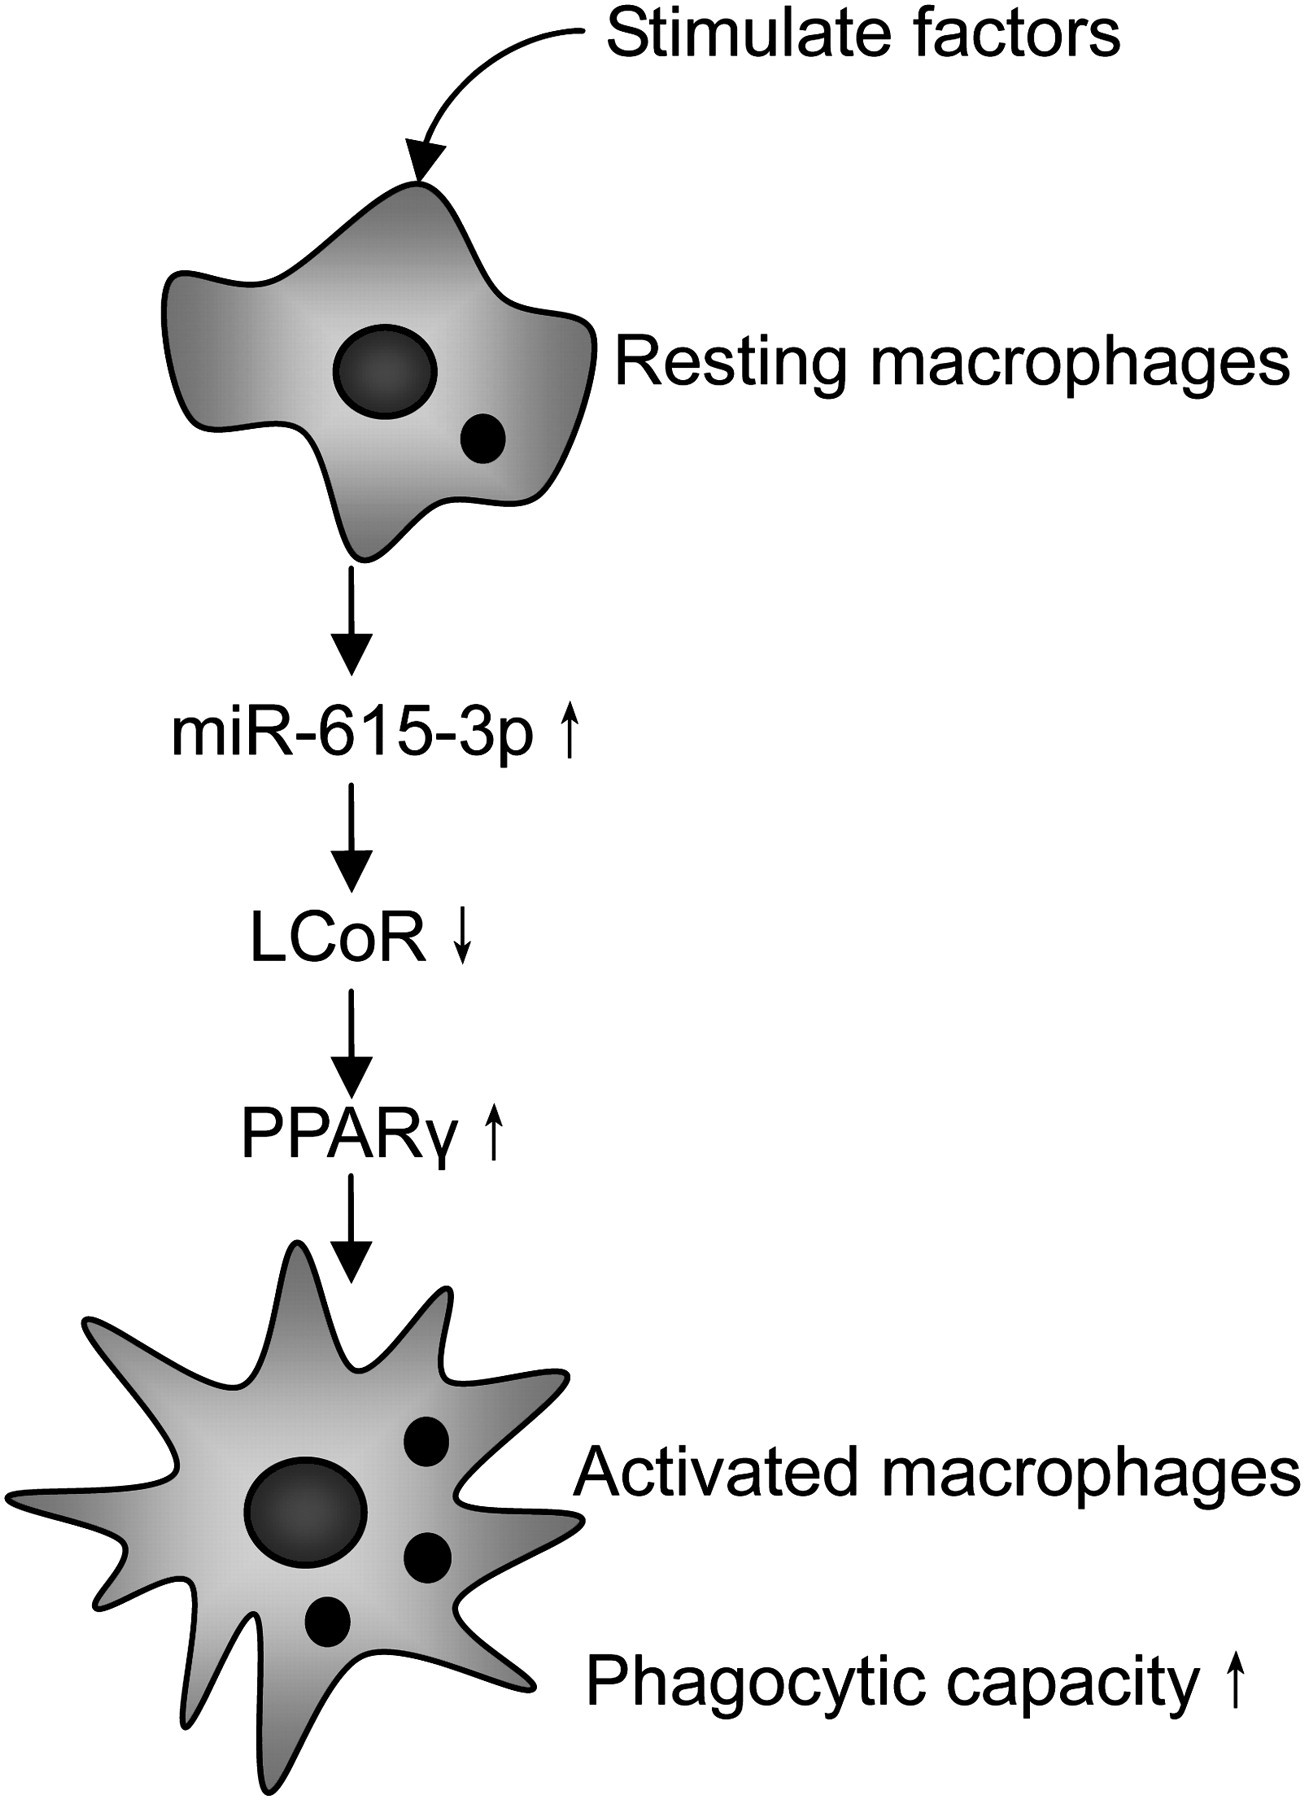
Effect of miR-615-3p, LCoR and PPARγ in macrophages. Schematic representation of resting macrophages is activated in response to the stimulating factors such as invading pathogens and natural ligands, etc. These mediators activate macrophages and upregulate miR-615-3p, and LCoR, as the target of miR-615-3p, is then downregulated. The low level of LCoR derepresses the activity of PPARγ and increase the phagocytic capacity of macrophages. LCoR, ligand-dependent nuclear receptor corepressor; PPARγ, peroxisome proliferator-activated receptor gamma
This study helps to define a new hypersplenism-associated miRNA-regulated pathway, which may help identify the regulation mechanism of macrophages and potential therapeutic targets. In addition, miRNA can be effectively delivered into spleen by interventional therapy, which represents a good model for the development of miRNA-based gene therapy. On the other side, recognizing the miRNA-dependent signaling mechanism in human macrophages hopefully opens a new avenue for studies of other macrophage-associated diseases.
Footnotes
ACKNOWLEDGEMENTS
This work was supported by the National Natural Science Foundation of China (30801109), Science and Technology Projects in Shaanxi Province (2006k12-G3 (6), 2008k15-06(7)) and the Project for Young Man from the Second Affiliated Hospital, School of Medicine, Xi'an Jiaotong University (YJ (QN) 200916). The research was performed at the Key Laboratory of Environment and Genes Related to Diseases, Education Ministry of China. The authors thank Qi Chen for assistance in English.