
Abstract
The purpose of the present study was to investigate whether functional 20S and/or 26S proteasomes are present within mature human red blood cells (RBCs; depleted of reticulocytes and leukocytes). Double-immunofluorescence confocal microscopy showed the presence of immunoreactive 20S and 19S proteasomal subunit proteins and their partial co-localization within mature RBCs. Proteasomes isolated from mature RBCs displayed 20S activity in vitro; atomic-force and transmission electron microscopy of isolated proteasomes revealed abundant 20S core particles and very few 26S particles. A two-dimensional differential in-gel electrophoresis (2D-DIGE) approach was used to determine if proteasome-dependent protein degradation occurs within mature RBCs. Twenty-eight proteins were identified with altered protein content in response to lactacystin. Seven cytosolic proteins showed an increase and 16 showed a decrease; five membrane proteins showed a decrease. We conclude that the proteins showing increased abundance are either primary or secondary targets of the 20S proteasome and that putatively degraded proteins are secondary targets. Therefore, functional 20S proteasomes exist within mature RBCs. Our study did not detect 26S proteasome activity using the 2D-DIGE approach.
Keywords
Introduction
Etlinger and Goldberg 1 reported a non-lysosomal adenosine triphosphate (ATP)-dependent proteolytic system in reticulocytes. However, ATP-dependent activity was shown to be entirely lost in mature red blood cells (RBCs). 2 A number of studies demonstrated the loss of one or more proteolytic constituents and certain ubiquitination enzymes and their substrates in erythrocytes. 2–4 In contrast, ubiquitin-protein conjugates have been found in erythrocytes. 5,6 It is know that human RBC alpha spectrin has a ubiquitin conjugating/ligating (E2/E3) activity 6–8 and that α-spectrin, protein band-3, ankyrin, protein 4.1, protein 4.2 and unknown protein (gi13278939) are targets of spectrin's E2/E3 activity. 6–10 As evidenced by previous proteomic studies (that have identified several proteins of the ubiquitin–proteasome system), proteasomal proteins could be present in the mature RBCs. 11–15 Hence the primary goal of this study was to investigate whether functional proteasomes exist in mature RBCs.
We demonstrate that functional 20S proteasomes do exist within mature erythrocytes, and that 26S proteasomes are minimally present. We believe that our study reconciles the early biochemical analyses (demonstrating very low or absent ATP-dependent protein degradation in mature erythrocytes) with the more recent proteomic studies demonstrating the presence of proteasomal subunits and enzymes of the ubiquitination pathway being present in these same cells. 12–14
Materials and methods
Reagents
Poly-lysine-coated slides were from VWR International Inc (West Chester, PA, USA) and paraformaldehyde was purchased from Electron Microscopy Sciences (Hatfield, PA, USA). Percoll, Triton X-100, DTT (
Sample collection
Human blood was collected by venipuncture in lithium heparin vacutainer tubes after informed consent was obtained from healthy donors (University of Texas at Dallas, Richardson, TX and SUNY Upstate Medical University Hospital, Syracuse, NY, USA) according to the institutional review board approved protocol. The collected samples were processed immediately for two-dimensional differential in-gel electrophoresis (2D-DIGE) analysis and within 18 h for all other experiments. All the experiments were performed using human RBCs that were depleted of reticulocytes to <4.8 ppm and leukocytes to <2.1 ppm unless and otherwise mentioned. 16 The depleted reticulocyte–leukocyte-free mature human RBCs will be referred to as mature RBCs.
Double immunofluorescence confocal analysis
Whole blood preparation was centrifuged at 500
Proteasome purification and isolation from mature human RBCs
A percoll density method developed in our laboratory was used for isolation of reticulocyte- and leukocyte-free human RBCs as described above. 16 Proteasome isolation from lysed RBCs was done as described. 17,18 Ultracentrifugation was performed and the final pellet was solubilized and applied to the Superose 6 column (1 × 50 cm) at 4°C. 18 Equilibration and elution were done using Tris-glycerol buffer (20 mmol/L Tris-HCl, pH 7.5, 10% glycerol, 5 mmol/L ATP, 100 mmol/L NaCl). The flow rate was set for 7.2 mL/h, 1.8 mL fractions were collected and aliquots were stored at −80°C.
In vitro 20S assay
Fractions collected from the Superose column were assayed using a 20S Proteasome assay kit according to the manufacturer's instructions. Suc-LLVY-aminomethylcoumarin (AMC) substrate was used to measure activity in the presence and absence of 10 μmol/L lactacystin. Commercially available 20S human proteasome was used as positive control. Fluorescence of released AMC was read at 380–460 nm using a BioTek spectrofluorimeter.
Sodium dodecyl sulfate polyacrylamide gel electrophoresis and Western blotting
Proteins were separated using sodium dodecyl sulfate polyacrylamide gel electrophoresis (SDS-PAGE) (10% polyacylamide) at 70 V for three hours in a Tris-glycine running buffer (25 mmol/L Tris, 192 mmol/L glycine and 0.1% w/v SDS). Silver staining was performed according to Bio‐Rad silver stain plus user guide. Where indicated, molecular weight markers and control 20S and 26S extract were also loaded. Protein concentration was determined by measuring the absorbance at 280-nm using a Bio‐Rad Smart spec. All the dilutions were prepared using PBS pH 7.4; the washing buffer contained 1× PBS with 0.2% Tween-20. For immunobloting, proteins were separated as described above and transferred (using transfer buffer – 25 mmol/L Tris, 192 mmol/L glycine, 0.1% w/v SDS and 20% methanol) onto nitrocellulose membranes at 50 V for ∼90 min at 4°C. The membranes were blocked using 5% blocking reagent for one hour, and incubated in primary anti-proteasome 20S alpha α6 antibody at 1:500 dilution overnight at 4°C. The membrane were washed twice in PBS for 10 min at room temperature and incubated in secondary anti-rabbit horseradish-peroxidase conjugated antibody at 1:5000 dilution for one hour. The membranes were washed, developed using ECL plus reagent and exposed to hyperfilm for 1–5 min intervals. Membranes were stripped and re-probed using 20S alpha α6 and 19S 5a antibodies at 1:500 dilution and subsequent steps were performed as described above.
Two-dimensional Western blot
Proteins were separated by isoelectric focusing (IEF) followed by SDS-PAGE (10% polyacrylamide) and transferred onto hybound ECL membrane using a TE77XP semi-dry transfer instrument (Hoefer Inc, San Francisco, CA, USA) at 30 V for ∼90 min using wet transfer. The membranes were blocked and washed as described above. Blots were incubated using antiubiquitin primary antibody at 1:400 dilution overnight at 4°C and ECL plex anti-rabbit Cy5- or anti-mouse Cy3-conjugated antibody (GE Healthcare) at 1:3000 for one hour at room temperature. The blots were scanned using a Typhoon 9410 scanner at the recommended laser settings.
Atomic force microscopy
Fractions displaying peak 20S proteasome chymotryptic activity were concentrated using a 100-KD Centricon YM100 centrifugal concentrators or applied directly to mica substrates for atomic-force microscopy (AFM) analysis. Samples containing approximately 10 μg/mL protein were deposited on freshly cleaved mica and incubated at room temperature for two minutes. The substrate was gently washed with TN buffer (5 mmol/L Tris-HCl, 150 mmol/L NaCl, pH 7.5), rinsed briefly with double-deionized water, dried under a stream of argon and stored overnight in a vacuum desiccator. Images were collected using a Nanoscope IV multimode scanning-probe microscope (Veeco, Plainview, NJ, USA). Imaging was done in air at room temperature using RTESP tapping-mode silicon probes having a nominal tip radius of 8 nm (Veeco). SPIP (scanning probe image processor) software (Image Metrology) was used for image processing and analysis. Raw images were plane-corrected and Fourier‐filtered to reduce noise. 19
Electron microscopy
Fractions displaying peak 20S proteasome chymotryptic activity were concentrated using 100-kDa centrifugal concentrators or used directly for negative stain electron microscopy (EM). Samples (10–50 μg/mL) were applied to glow-discharged, carbon-coated, copper grids, washed once with double-deionized water, stained with 1% uranyl acetate solution for ∼1 min and air dried. Grids were visualized in a JEM-2100 transmission electron microscope (JEOL, Tokyo, Japan) operating at 200 kV. Electron micrographs were recorded on a 4k CCD camera (TVIPS F415-MP) in minimum dose mode at an electron optical magnification of ×40,000 and a defocus of −1.5 μm. For single molecule image analysis, micrographs were displayed using the boxer program of the EMAN software package 20 and a data-set of 1613 top- and side-view images was collected using the ‘autobox’ function in EMAN. All subsequent image analysis was done with the Imagic 5 package of programs 21 Images were normalized, band pass filtered to remove low (<0.08 Å−1) and high (>0.16 Å−1) spatial frequencies and a circular mask was applied. Data-sets were treated by multivariate statistical analysis (MSA) and sorted into between 16 and 36 initial classes by hierarchical ascendant classification. The best averages of the classes as determined by Imagic were then used as references for multi or single reference alignment and the MSA/classification was repeated until stable results were obtained.
To test for the presence of 26S proteasomes, we used glycerol gradient centrifugation in the presence of the cross-linker glutaraldehyde.
22
Glycerol gradient centrifugation (200,000
Quantitative immunodot assay
Purified 26S proteasome protein (50–3000 ng) and approximately 4 μg of crude lysate from reticulocyte enriched or reticulocyte–leukocyte-free RBCs were dot blotted on hybound ECL membrane using a Minifold (Schleicher and Schuell Inc, Keene, NH, USA). Blocking and wash steps were performed as described above (SDS–PAGE and Western blot). Membranes were blocked and probed against 19S and 20S subunit antibodies (1:200 dilution overnight at 4°C). Immunodetection was done using ECL plex anti-rabbit Cy5- or anti-mouse Cy3-conjugated antibody (GE Healthcare) at 1:6000 for one hour at room temperature, washed and scanned using a Typhoon 9410 scanner at the recommended laser settings. Quantitative estimation of the dot blots was performed based on the standard curve (26S purified protein) using Image quant software.
Protein profiling by 2D-DIGE
Intact mature RBCs at 50% hematocrit from the same preparation free of reticulocytes and leukocytes 16 were incubated for two hours at 37°C with mild shaking in the absence or presence of 10 μmol/L lactacystin in three different conditions: (1) PBS (11.9 mmol/L sodium phosphates, 137 mmol/L sodium chloride and 2.7 mmol/L potassium chloride and 5 mmol/L magnesium chloride); (2) PBS with ATP-regeneration mix (2 mmol/L ATP, 15 U/mL creatine kinase, 10 mmol/L creatine phosphate and 5 mmol/L magnesium chloride) favoring ATP-dependent 26S proteasome activity; and (3) PBS with ATP depletion mix (6 U/mL hexokinase and 20 mmol/L de-oxyglucose and 5 mmol/L magnesium chloride) favoring ATP-independent 20S proteasome activity. RBCs incubated in the presence or absence of the inhibitor were analyzed for protein profiling using 2D-DIGE approach. To bridge the results obtained for different biological samples 2D-DIGE involves an internal reference – an equimolar mix of biological samples used. RBC membrane and cytosolic proteins were isolated and analyzed separately. RBC ghosts (membrane pellet) were prepared using the hypotonic lysis method in PBS lysis buffer as described. 12 The supernatant was collected from the previous centrifugation step (cytosolic protein); cytosolic hemoglobin depletion was done using Hemovoid spin columns according to the manufacturer's instructions (Biotech Support Group, Monmouth Jct, NJ, USA). Membrane and cytosolic proteins were treated with 2D clean-up kit (GE Healthcare). The resultant pellets were solubilized in labeling buffer (7 mol/L urea, 2 mol/L thiourea and 2% w/v non-ionic detergent ASB 14 and 30 mmol/L Tris-HCl pH 8.8), 55 μg of protein sample was labeled using Cy2- Cy3- or Cy5-cyanine dyes (GE Healthcare) and separated using 2D electrophoresis according to the manufacturer's instructions. IEF was performed on a 24 cm pH 3–10 non-linear gradient immobiline dry strip using an IPGphor III IEF system (GE Healthcare). The Immobiline dry strip was transferred onto the SDS polyacrylamide gel (10%) and electrophoresis was performed using Ettan DALT six (GE Healthcare).
Gel image and statistical analysis
The 2D gels were scanned using a Typhoon scanner 9410 (GE Healthcare); experimental pI and molecular weights on 2D gels were calculated using a calibration curve for 24 cm pH 3–10 non-linear IPG strips (GE Healthcare) and a molecular weight ladder. Image analysis was performed using DeCyder software version 7.0 (GE Healthcare). Within each 2D gel spot, the intensities of Cy2, Cy3 and Cy5 labels were determined and the relative abundance (Cy3/Cy2 and Cy5/Cy2 ratios) of corresponding proteins were calculated. The relative protein abundances for each 2D gel spot in all 2D gels representing different biological samples were determined. For each experimental condition the relative protein abundances for identical 2D gel spots were compared across 2D gels, average protein ratios and their standard deviation were determined and a t-test was performed. For each experimental condition, analysis was performed with three and four biological samples for membrane and cytosolic samples, respectively. The protein spots where relative protein abundance was changed ≥1.50-fold in response to lactacystin with a P ≤ 0.05 were selected for further identification.
Protein identification by mass spectrometry
Preparative gels were stained using Sypro ruby (Molecular Probes, Carlsbad, CA, USA) according to the manufacturer's instructions. The selected spots were picked using an automated spot picker (Ettan Spot Picker, Amersham Bioscience-GE Health, Uppsala, Sweden). The gel plugs were digested using the in-gel trypsin digestion kit according to the manufacturer's protocol (Pierce, Rockford, IL, USA). The liquid chromatography-mass spectrometry (LC/MS/MS) analysis was performed using a Surveyor MS Plus high-performance liquid chromatography (HPLC) system (with a flow splitter and a peptide trap) in line with a LTQ Orbitrap XL mass spectrometer with a nanospray ionization source (Thermo Fisher Sci, Waltham, MA, USA). Tryptic peptides (5 μL) were separated by reverse-phase HPLC on a PicoFrit BioBasic C18 column (0.075 × 100 mm; New Objectives, Woburn, MA, USA) at a 0.3 μL/min flow rate. Water and acetonitrile with 0.1% formic acid were used as solvents A and B, respectively. The peptides were eluted by a linear gradient of solvent B (0–30% B over 60 min, 30–60% B over 30 min and 60–90% B over 10 min). The eluted peptides were analyzed by tandem mass spectrometry in data-dependent mode with dynamic exclusion. The peptides and the corresponding fragment ions were analyzed in the Orbitrap and Linear Trap analyzer, respectively. The spray voltage was set at 1.8 kV; the ion transfer capillary temperature was set at 180°C.
The database search was performed using SEQUEST algorithm within the mass informatics platform Proteome Discoverer 1.1 (version 1.1.0.263, Thermo Fisher Sci) and the non-redundant protein sequence database (nr.fasta, 20 May 2010) of the National Center for Biotechnology Information (NCBI). Selected MS/MS spectra were submitted to a database search. The following thresholds were used for spectra selection: total ion current (TIC) intensity of a spectrum – ≥10, minimal ion count in a spectrum – ≥10 and signal‐to‐noise (S/N) ratio – ≥3.0. The spectra of identical peptides (precursor mass tolerance 10 ppm, retention time difference <0.75 min) were grouped. The following SEQUEST search parameters were used: digestion enzyme – trypsin, two missed cleavage sites were allowed, the precursor mass (mono-isotopic) tolerance – 10 ppm, fragment ion mass (mono-isotopic) tolerance – 0.8 Da, static modification – carbamilomethylation of Cys residues, dynamic modification – oxidation of Met residues, and phosphorylation of Ser, Thr and Tyr residues. The database search was restricted to proteins of human origin (199,764 entries) and corresponding tryptic peptides with molecular masses of 500–5000. The database protein sequences were complemented with corresponding reversed sequences (decoy database) for determination of the false discovery rate (FDR). The stringent FDR value was set to 0.01. The peptide identification criteria: XCorr score exceeding the threshold value corresponding to FDR of 0.01. The protein identification criteria: identification of at least two peptides unique to a given protein.
Results
Double immunofluorescence confocal microscopy analysis
To determine if proteasomes are present in mature human RBCs or only reticulocytes, double immunofluorescence confocal microscopy was performed on an RBC preparation in which reticulocytes and leukocytes were not depleted (except for the removal of the buffy coat during RBC preparation). Confocal images are presented in Figures 1a–d showing an RBC preparation stained with primary antibodies against proteasome 20S β subunit and a reticulocyte-specific marker CD-71, and fluorescently labeled secondary antibodies fluorescein isothiocyanate (FITC) and Texas Red (TX-red), respectively. Panel b shows a differential interference contrast (DIC) image of all of the RBCs in the field. All the RBCs seen in panel b stained positively for the presence of 20S β subunit proteins as shown in panel a and one CD-71-positive reticulocyte was found in the same field (panel a, panel c) that also stained positive for the proteasome 20S β subunit. Panel d shows a magnified view of the same field indicating RBCs stained positive for the presence of the proteasome 20S β subunit.

Double immunofluorescence confocal microscopy analysis of red blood cell (RBC) proteasomal protein. RBC preparation, where reticulocytes were not depleted. (a) RBCs immunostained with antibodies to proteasome 20S β subunit and fluorescein isothiocyanate (FITC)-labeled secondary antibody. (b) Differential interference contrast (DIC) image indicating all the RBCs in the field. (c) RBCs immunostained with antibodies to CD-71 and TX-Red labeled secondary antibody (CD-71 is a marker found on the surface of reticulocytes but not RBCs); red arrow in (a) and (c) indicate one CD-71-positive-stained reticulocyte also stained positive for proteasome 20S β subunit. (d) Magnified view of the same RBCs in (a), white arrows indicate single or punctate proteasomes. Images were obtained using the LEICA SP2 triple channel confocal microscope system. Bar = ∼8 μm. RBC preparation, where reticulocytes and leukocytes were depleted. (e) RBCs immunostained with antibodies to proteasome 20S α6 subunit and FITC-labeled secondary antibody. (f) DIC image indicating all the RBCs in the field. (g) RBCs immunostained with antibodies to proteasome 19S 5a subunit and TX-Red labeled secondary antibody. (h) RBCs immunostained using both the antibodies – merged image. Images were obtained using the Zeiss LSM510 scanning confocal/two-photon microscope system. Scale bar = 10 μm
A second double immunofluorescence confocal analysis (RBC preparation in which reticulocytes and leukocytes were depleted) was performed to determine if both proteasomal 20S and 19S subunit proteins are present and if they co-localize within mature RBCs. Confocal images showing RBCs stained with fluorescently-labeled antibodies against proteasome 20S α6 and 19S 5a are presented in Figure 1e–h. Panel f shows a DIC image of all the RBCs in the field; all the RBCs seen in panel f stained positive for proteasome 20S α6 subunit (secondary antibody FITC-labeled) as shown in panel e and for the presence of proteasome 19S 5a subunit (secondary antibody TX-red labeled) in panel g. The merged image (panel h) indicates RBCs that stained positively using both antibodies. Double immunofluorescence confocal analysis indicates partial co-localized staining of 19S and 20S proteasome subunit proteins within mature RBCs.
Isolation and purification of mature RBC proteasomes and in vitro functional analysis
Proteasomes were isolated from a mature RBC preparation that was depleted of reticulocytes and leukocytes by using ultracentrifugation followed by Superose 6 gel filtration as described in the Materials and methods section. Using a fluorogenic chymotryptic substrate, 20S proteasome activity was measured in the absence and presence of the proteasome-specific inhibitor lactacystin. Proteasome-specific activity was calculated by subtracting the activity that remained in the presence of the inhibitor from total activity. Peak activity was noted for fraction number-11. The total activity, proteasome specific activity and activity that remained in the presence of the inhibitor are shown in Figure 2a. The results indicate that the isolated proteasomes are functional in vitro.
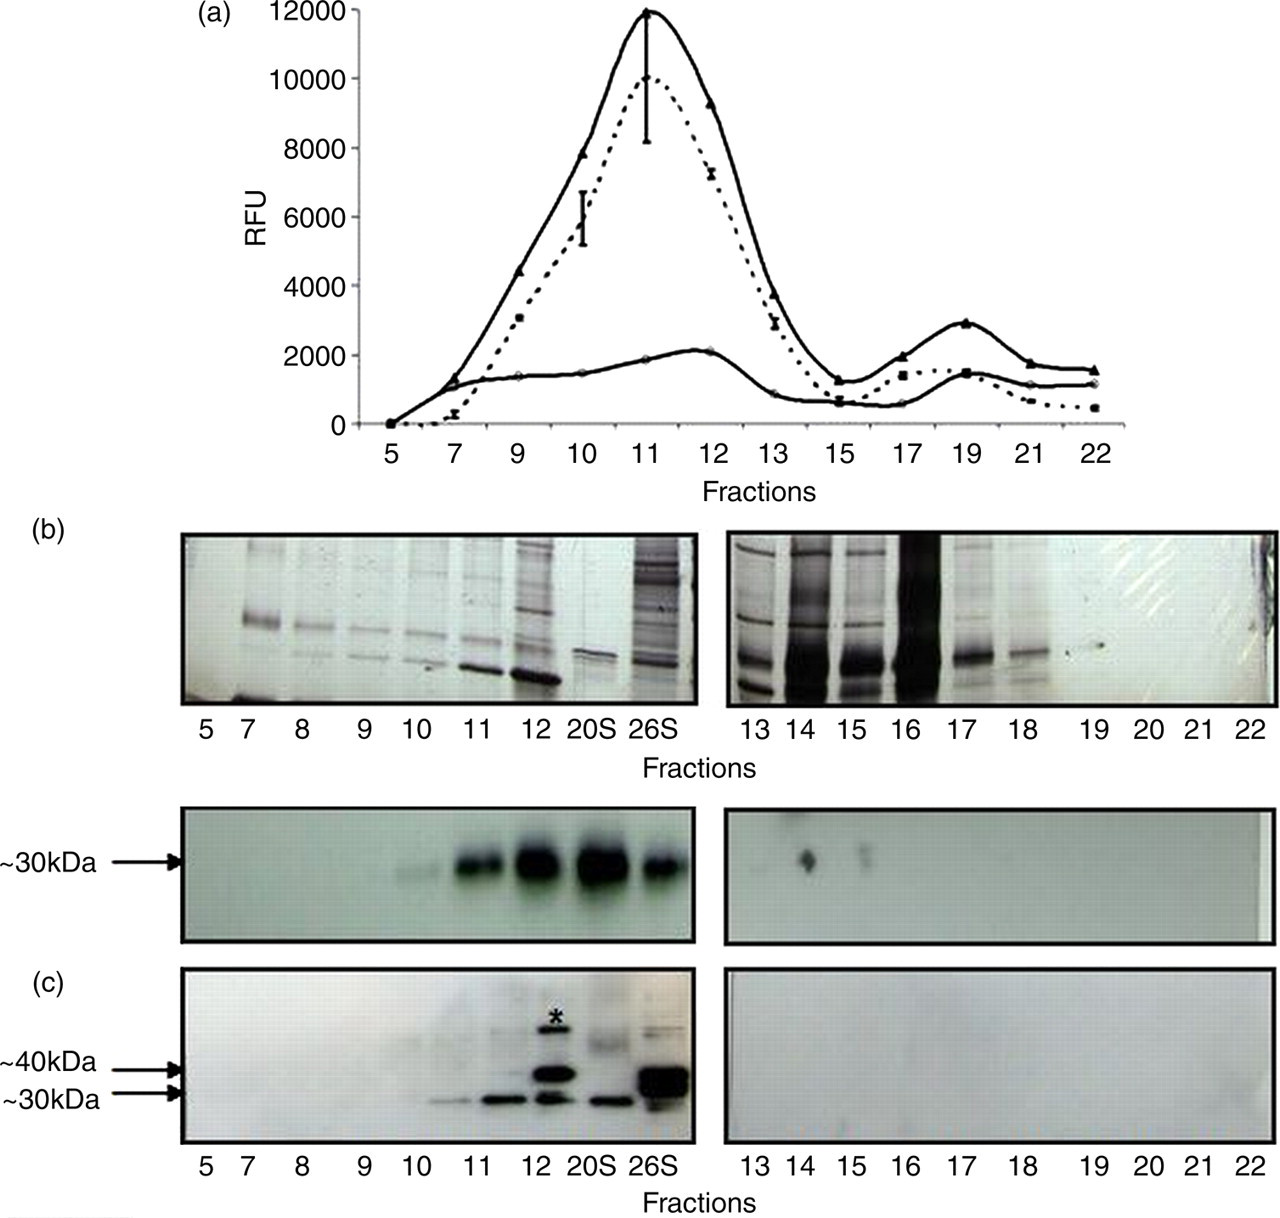
20S proteasome activity profile in mature red blood cell (RBC) protein fractions. Partially purified proteasomes were chromatographed using Superose 6 Gel filtration. The collected fractions were analyzed for 20S chymotryptic activity (a), total protein using sodium dodecyl sulfate polyacrylamide gel electrophoresis (SDS–PAGE) followed by silver-staining (b) and 20S and 19S proteins by immunoblotting (c) as described in the Materials and methods section.
The same fractions were further analyzed by SDS-PAGE and detected by silver staining (Figure 2b) or by immunoblotting using both proteasome 20S α6 and 19S 5a subunit antibodies (Figure 2c). Proteasome 20S and 26S positive controls were also included. Immunoblot results showed the presence of bands corresponding to those of proteasome 20S α6 ∼30 kDa (Figure 2c, upper panel). The same blot was stripped and re-probed using 20S α6 and 19S 5a antibodies and the expected 30 and 41 kDa bands are seen (Figure 2c, lower panel). An intense 19S subunit protein band in fraction 12 was seen, which may indicate a disassembled 19S component. An additional protein band of ∼55 kDa was detected using the 19S 5a antibody. Immunoblotting indicated the presence of immunoreactive proteasomal 20S α6 and 19S 5a subunit proteins in the fractions that demonstrated 20S activity. The purification procedure used herein resulted in an enriched proteasome preparation as evidenced by the SDS-PAGE gel and immunoblot result.
Analysis by atomic-force and EM
AFM images were analyzed in terms of distributions of particle height above the substrate surface, Z. At least 60 particles were characterized with 75% of the particles having a mean Z of 10.87 nm ± 0.357 (SE) and extreme values, Zmax of 17.17 nm ± 0.658 (SE) (Table 1; Figures 3a–b). These values correspond to known 20S proteasome dimensions determined by EM and X-ray diffraction: specifically diameter/height proportions 11–12/15–17 nm. 23,24 AFM analysis of reticulocyte- and leukocyte-free human RBC proteasome fractions displaying the highest in vitro activity showed the presence of particles that correspond to known 20S-proteasome dimensions.
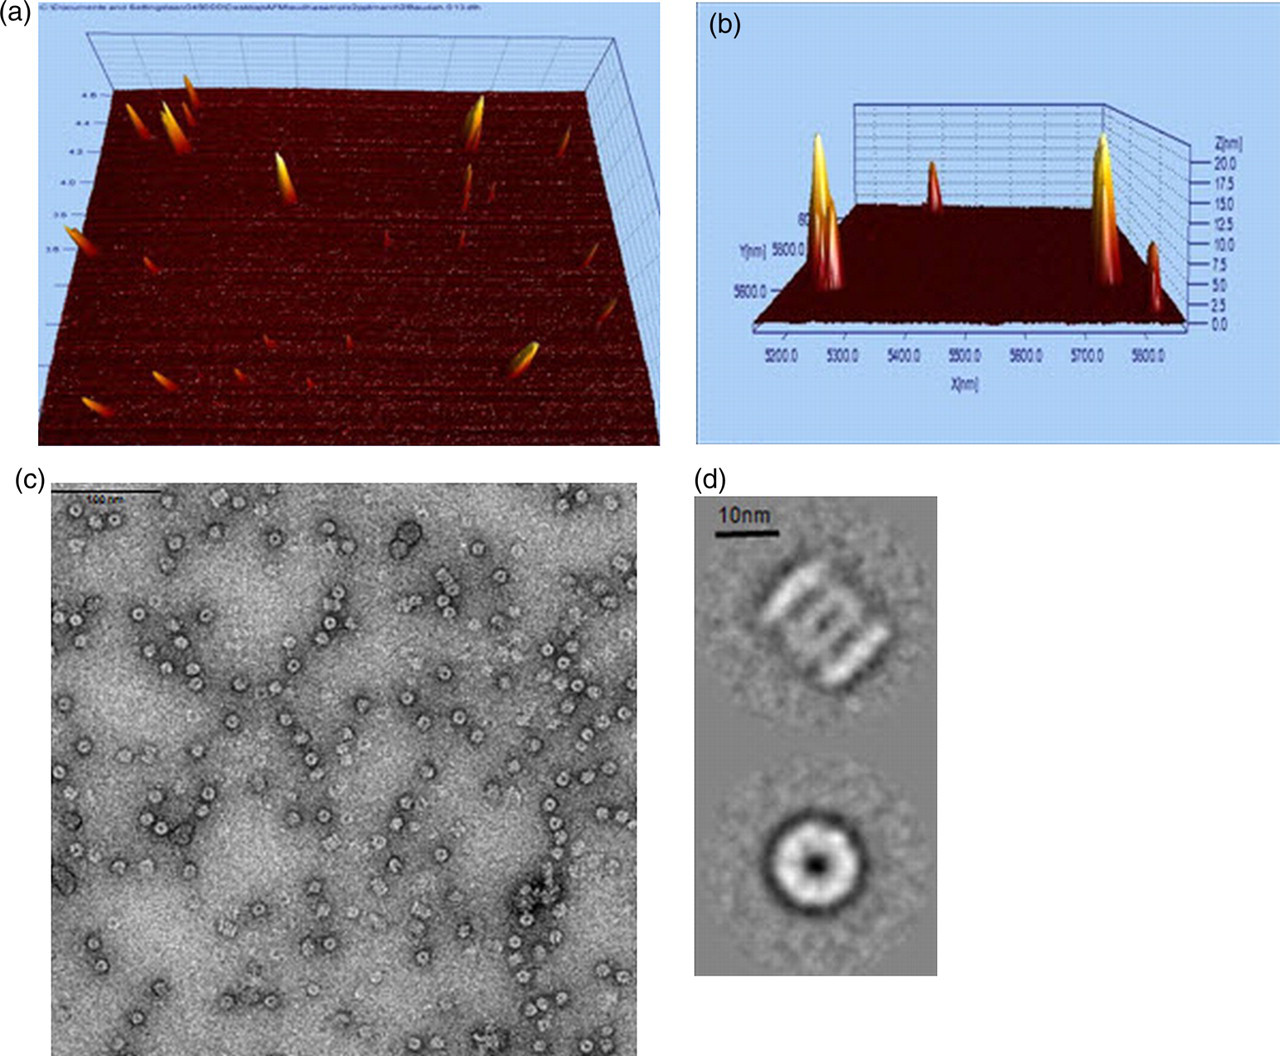
Structural analysis of proteasomes isolated from mature red blood cell (RBC) fractions using atomic-force microscopy (AFM) and electron microscopy (EM). Partially purified proteasomes were chromatographed using Supersose-6 gel filtration; the fractions displaying highest proteasome specific chymotryptic activity were analyzed using AFM and EM. Three-dimensional view representative AFM fields after flattening and Fourier filtering as described in the Materials and Methods section. (a) Tilted top view, (b) side view and (c) electron micrograph of the characteristic top- and side-view projected images of 20S proteasome core particles. Scale bar = 100 nm. (d) The representative top- and side-view average projections. A data-set of 1613 proteasome projection images was treated by multireference alignment and multivariate statistical analysis (MSA)/classification and sorted into 24 classes. The remaining classes were of top-view orientations. The averages were calculated from 98 and 44 images, respectively. Scale bar = 10 nm. Imaging was performed using a JEM-2100 transmission electron microscope operating at 200 kV. EMAN was used to perform single molecule image analysis; Imagic software was used to perform multivariate statistical analysis (Materials and methods)
Statistical data for atomic-force microscopy image analysis of reticulocyte–leukocyte-free red blood cell (RBC) 20S proteasome fraction displaying highest chymotryptic activity
*At least 60 particles were characterized with 75% of the particles having a mean Z of 10.87 nm ± 0.357 (SE) and extreme values, Zmax of 17.17 nm ± 0.658 (SE)
Electron micrographs of mature RBC fractions that demonstrated the highest 20S activity showed the presence of the characteristic top- and side-view projected images of 20S proteasome core particles 25 as shown in Figure 3c. Alignment and classification of a data-set of 1613 molecular images resulted in the typical end-on and side-view projections (see Materials and methods section). The majority of molecules adopted a variably tilted top-view orientation with only a small minority of projections representing the side-view orientation (44 out of 1613 images). Representative average projections are shown in Figure 3d. EM analysis of cross-linked fractions was also performed with very few 26S proteasome-like particles detected relative to an abundance of top- and side-view orientations of 20S proteasome particles (data not shown).
Proteasomal activity in intact RBCs
The principal goal of the study was to investigate whether proteasome-dependent degradation exists within intact mature RBCs. Proteomes of mature RBCs incubated in the absence and presence of the proteasome-specific inhibitor lactacystin were analyzed by protein profiling using a 2D-DIGE approach. RBCs were incubated in three different conditions: (1) PBS only; (2) PBS with ATP-regeneration mix favoring ATP-dependent 26S proteasome activity; and (3) PBS with ATP depletion mix favoring ATP-independent 20S proteasome activity. A total of 23 cytosolic proteins and five membrane proteins with statistically significant changes in protein content, in response to lactacystin, were identified using a Linear ion trap quadropole (LTQ) Orbitrap XL mass spectrometry. The identified proteins, accession numbers and P values are shown (Tables 2, 3 and 4). The average ratio represents the ratio of protein abundance in the presence of inhibitor to that found in the absence of the inhibitor. A positive average ratio indicates proteins that increase in response to proteasomal inhibition. Figure 4 represents a 2D-IEF-SDS-PAGE gel image of cytosolic proteins. Mature RBC cytosolic and membrane protein spots with a relative protein abundance change ≥1.50-fold with P ≤ 0.05 are indicated on the representative 2D gels (Figures 5a–b). All the cytosolic identified were observed in the ATP-depleted conditions (±lactacystin), which favors ATP-independent 20S proteasomal activity. Four membrane proteins were altered in PBS condition ± lactacystin and membrane protein glyceraldehyde-3 phosphate dehydrogenase was identified in the ATP-regeneration condition ± lactacystin. Seven cytosolic proteins were increased. Sixteen were decreased and five membrane proteins were decreased. The seven cytosolic proteins that showed increased protein abundance in response to proteasome inhibition are likely primary or secondary targets of ATP-independent 20S proteasome activity. The proteins that decreased are secondary targets of 20S proteasome activity.
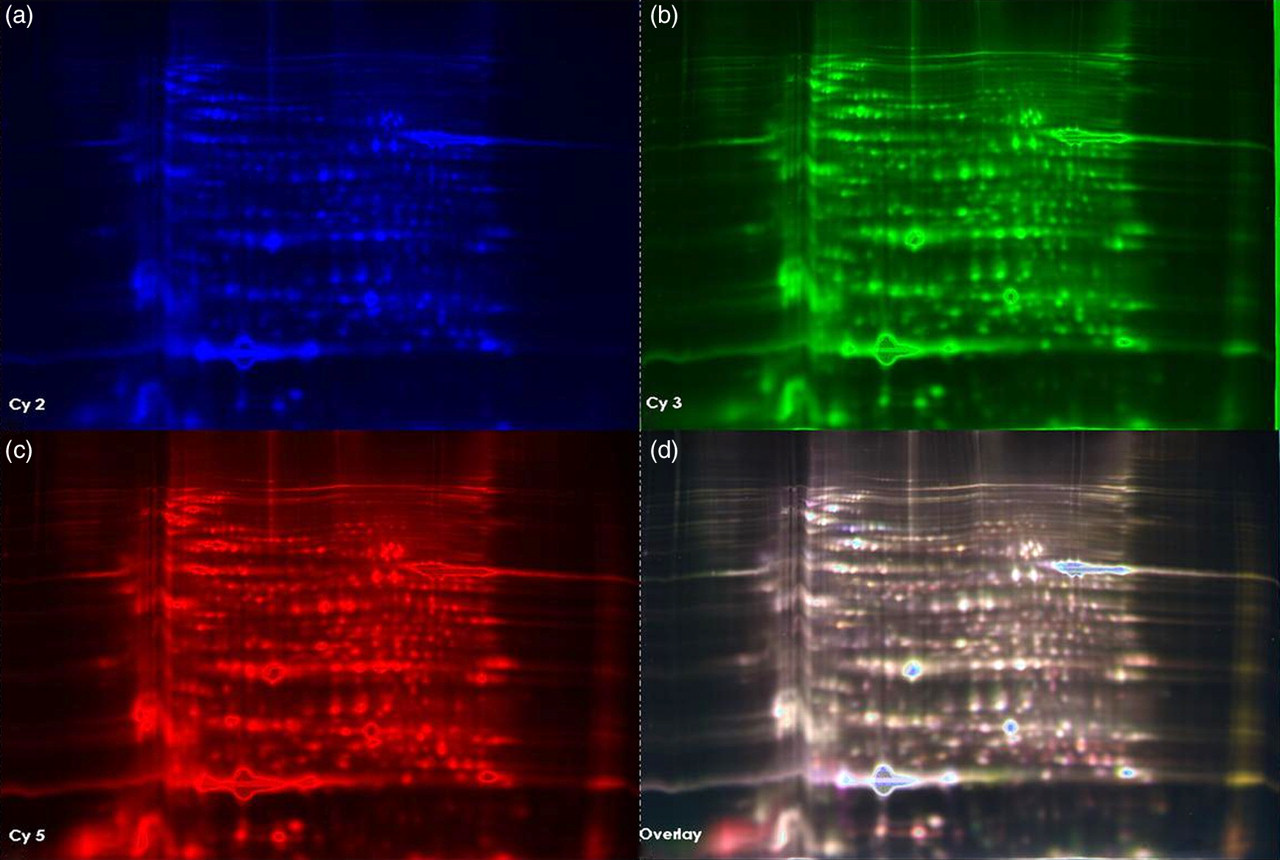
Proteasomal activity in intact mature red blood cells (RBCs) determined by 2D-DIGE (two-dimensional differential in-gel electrophoresis). Mature RBCs were incubated in phosphate-buffered saline (PBS) in the absence or presence of proteasome specific inhibitor lactacystin and cytosolic proteins were profiled using 2D-DIGE analysis as described in the Materials and methods. (a) Cy-2 labeled (internal standard) cytosolic proteins separated on a 2D-IEF-SDS-PAGE gel, (b) Cy-3 labeled cytosolic proteins from RBCs incubated in the presence of lactacystin in PBS buffer, separated on a 2D-IEF-SDS-PAGE gel, (c) Cy-5 labeled cytosolic proteins from RBCs incubated in the absence of lactacystin in PBS buffer, separated on a 2D-IEF-SDS-PAGE gel and (d) merged image. IEF, isoelectric focusing; SDS–PAGE, sodium dodecyl sulfate polyacrylamide gel electrophoresis; 2D, two-dimensional
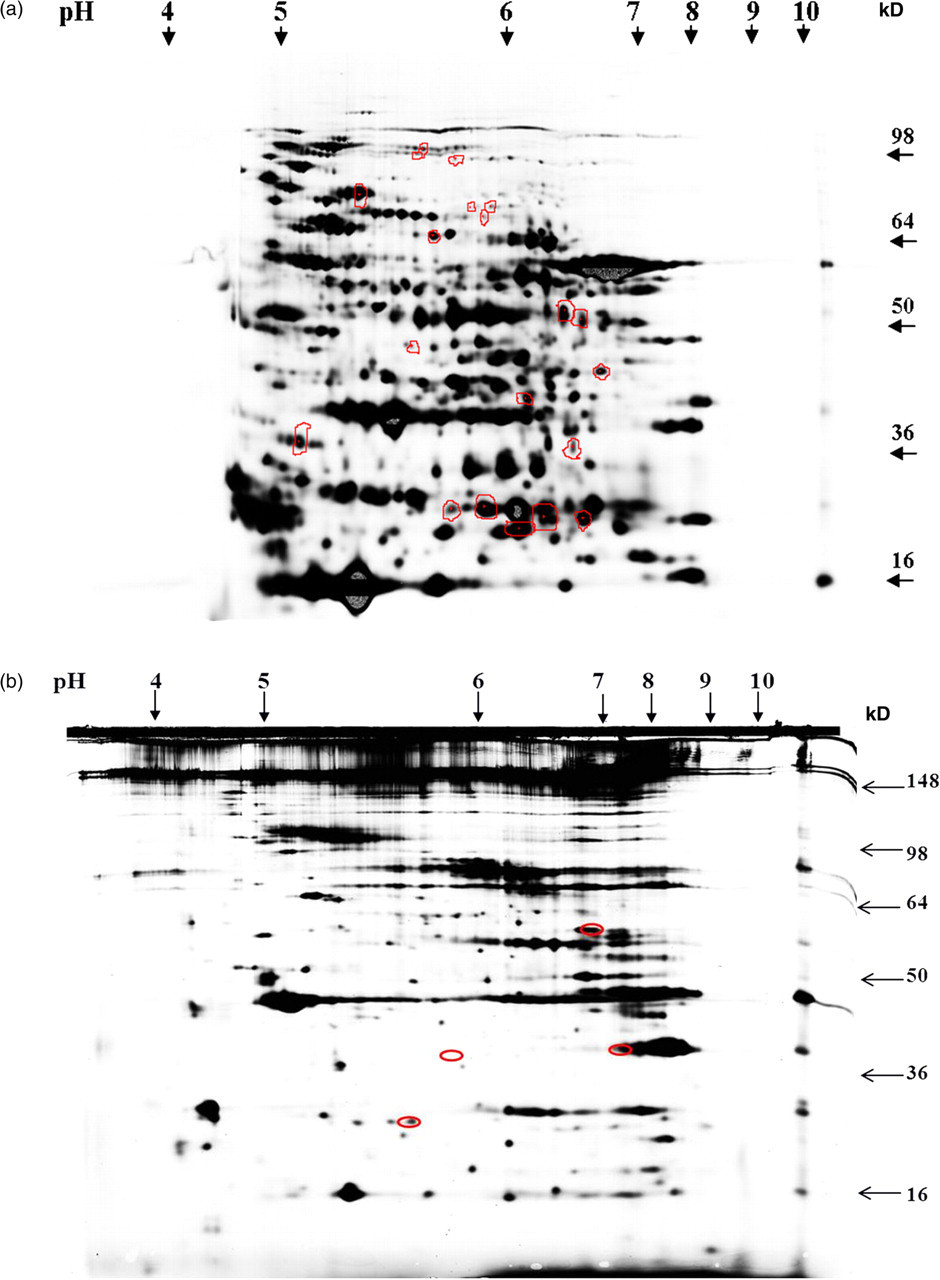
Target proteins of proteasomal activity in mature red blood cells (RBCs). (a) Mature RBC cytosolic proteins separated on a 2D-IEF-SDS-PAGE gel. (b) Mature RBC membrane proteins separated on a 2D-IEF-SDS-PAGE gel. Proteins spots where relative protein abundance was changed ≥1.50-fold in response to lactacystin are shown on the 2D master gels. The changes were statistically significant at P ≤ 0.05. IEF, isoelectric focusing; SDS-PAGE, sodium dodecyl sulfate polyacrylamide gel electrophoresis; 2D, two-dimensional
Cytosolic proteins that increased in intact reticulocyte- and leukocyte-free human red blood cells (RBCs) in response to proteasome inhibitor lactacystin
Intact mature RBCs free of reticulocytes and leukocytes were incubated in the absence or presence of 10 μmol/L lactacystin. Cytosolic proteins were separated on 2D-IEF-SDS-PAGE and protein spots where relative protein abundance was changed ≥1.50-fold in response to lactacystin with a P ≤ 0.05 were identified using a LTQ Orbitrap XL mass spectrometer
SDS–PAGE, sodium dodecyl sulfate polyacrylamide gel electrophoresis; IEF, isoelectric focusing; 2D, two-dimensional
*Identified peptides unique to the proteins
†Average ratio represents the ratio of protein abundance in the presence of inhibitor to that found in the absence of the inhibitor
Cytosolic proteins that decreased in intact reticulocyte- and leukocyte-free human red blood cells (RBCs) in response to proteasome inhibitor lactacystin
Intact mature RBCs free of reticulocytes and leukocytes were incubated in the absence or presence of 10 μmol/L lactacystin. Cytosolic proteins were separated on 2D-IEF-SDS-PAGE and protein spots where relative protein abundance was changed ≥1.50-fold in response to lactacystin with a P ≤ 0.05 were identified using a LTQ Orbitrap XL mass spectrometer. SDS–PAGE, sodium dodecyl sulfate polyacrylamide gel electrophoresis; IEF, isoelectric focusing; 2D, two-dimensional
*Identified peptides unique to the proteins
†Average ratio represents the ratio of protein abundance in the presence of inhibitor to that found in the absence of the inhibitor
Membrane proteins that decreased in intact reticulocyte and leukocyte-free human red blood cells (RBCs) in response to proteasome inhibitor lactacystin
Intact mature RBCs free of reticulocytes and leukocytes were incubated in the absence or presence of 10 μmol/L lactacystin. Membrane proteins were separated on 2D-IEF-SDS-PAGE and protein spots where relative protein abundance was changed ≥1.50-fold in response to lactacystin with a P ≤ 0.05 were identified using a LTQ Orbitrap XL mass spectrometer. SDS–PAGE, sodium dodecyl sulfate polyacrylamide gel electrophoresis; IEF, isoelectric focusing; 2D, two dimension
*Identified peptides unique to the proteins
†Average ratio represents the ratio of protein abundance in the presence of inhibitor to that found in the absence of the inhibitor
Discussion
We found functional 20S proteasomes within mature RBCs. If 26S proteasomal particles are present at all, they appear to be substantially lower in number. This explains why early biochemical studies demonstrated very low or non-existent ATP-dependent protein degradation, whereas proteomics studies found proteasomal subunits and enzymes of the ubiquitination pathway in these same cells. Structural analysis using EM and AFM provides evidence of particles in the fractions that displayed highest (20S in vitro) activity that have the morphology of 20S proteasomes in both top- and side-view orientations. We tested whether glutaraldehyde cross-linking followed by glycerol gradient centrifugation would cross-link the low-abundance 19S particles to generate 26S species; however, the EM analysis revealed abundant 20S proteasomes in these cross-linked fractions and very few 26S-like particles. Subsequently, a quantitative dot-blot analysis was performed to determine the relative ratio of 20S/19S in mature RBCs and in reticulocyte-rich lysate (1.77 ± 0.46 and 2.35 ± 0.90, respectively, N = 3). The values were not statistically different based on the t-test at P ≤ 0.05. We therefore conclude that a change in 19S/20S is not the cause of the diminished level of 26S within mature RBCs. It is likely that the disassembled 19S proteasome may be prevalent within the mature RBCs.
The seven cytosolic proteins that increased in the presence of lactacystin are as follows: ubiquitin activating E1 enzyme that catalyzes the first step in the ubiquitin conjugation cascade; cullin‐associated NEDD8 (neural precursor-cell expressed developmentally down-regulated) protein 1 that is involved in assembling and disassembling cullin ring E-3 ligases; 26 soluble N-ethyl maleimide sensitive factor binding protein (SNARE family) that is a membrane fusion protein; 27 calpain (a cysteine protease) that is known to cleave spectrin and other cytoskeletal proteins; 28 N-acetyl aminoacyl peptide hydrolase that is involved in deacylating acylated peptides; 29 S-adenosyl homocysteine hydrolase that regulates S-adenosyl homocysteine, a potent inhibitor of methyltranferases; 30 and protein phosphatase methylesterase-1 that demethylates methylated proteins. 31 Single proteins were identified in most protein spots. The same proteins were identified from more than one protein spot, implying the presence of post-translational modifications. Although most of the proteins have been reported previously, our study is the first attempt to identify proteasome-specific protein substrates within intact mature RBCs.
Goodman et al. presented the RBC interactome that describes a novel protein–protein interaction network of erythrocyte proteins generated from known databases (Unified Human Interactome). 14 The repair or destroy (ROD) box within the network map contains primarily the proteasomal proteins, chaperones and heat shock proteins. The current study identified proteins that belong to the ROD box (with a relative protein abundance change ≥1.50-fold with P ≤ 0.05 in response to lactacystin). Proteasome subunit proteins (alpha subunit 4 and 6), 26S PAD homolog and peroxiredoxin 6 as well as catalase were identified in the present study that closely relate to the ROB box proteins. A proteomic profiling study of RBC membranes after hydroxyurea therapy in sickle cell patients performed in our laboratory identified N-acetyl aminoacyl peptide hydrolase, stomatin (isoform a) and proteasome subunit α-4 proteins as the altered proteins; 15 these proteins were also identified in the present study with a relative protein abundance change ≥1.50-fold with P ≤ 0.05 in response to lactacystin.
Proteomic studies (that have identified several ubiquitin–proteasome component proteins in RBC preparations) have supported the possibility of proteasomal subunits or ubiquitin–proteasome system proteins being present within mature RBCs. Generally these proteins were thought to be originating from reticulocyte contaminants, presumably representing incompletely degraded remnant proteins. 11–13 Our laboratory realized the likely possibility that these proteins were derived from the mature RBCs. 12–14 Contrary to some previous reports our study demonstrates that proteasomes are present and are functional within reticulocyte- and leukocyte-depleted mature RBCs. Even though only ATP-independent 20S-proteasome activity and no 26S ATP-dependent activity has been detected in our 2D-DIGE study, we cannot conclude that 26S activity is completely absent within mature RBCs.
It is not known why the proteasomes are retained within RBCs while most other organelles are lost during maturation. The 26S proteasomes are more susceptible to oxidative stress compared with the 20S proteasome. 32 It has been reported that in conditions of mild-oxidative stress, there is rapid (but reversible) inactivation of the ubiquitin activating/conjugating system. 33 Thus, it is possible that 20S proteasomes might function efficiently within RBCs as the presence of free or bound oxygen makes them prone to oxidative stress due to the presence of the abundant hemoglobin (iron containing protein).
Several in vitro studies have demonstrated that unstructured proteins and/or oxidatively damaged proteins are degraded by the 20S proteasome independent of ATP and ubiquitin. 3,32 Despite the presence of abundant free-20S proteasome in vivo, that is not associated with the regulatory proteins, 34 other studies question if the 20S proteasome by itself can degrade proteins and have indicated that ATP, ubiquitin and chaperones are required for the degradation of oxidatively damaged proteins. 35,36 Thus far, it is not clear if the presence of a free-20S proteasomes (without the 19S RP) plays a significant role in protein degradation. 37 Our studies, at least partly, answer this question; 20S proteasomes do exist within mature RBCs and are functional in vitro and in intact RBCs. We suggest that free-20S proteasomes are likely to be functional within other mammalian cells as well.
We conclude that proteins showing increased abundance under lactacystin-dependent proteasome inhibition are either primary or secondary targets of 20S proteasome degradation, whereas putatively degraded proteins are secondary targets.
2D-Western blotting of the cytosolic proteins using ubiquitin antibodies demonstrated that very few cytosolic proteins among the identified proteins were ubiquitinated (data not shown). Mature RBCs have no protein synthesis, yet ubiquitin-independent protein degradation occurs. Future studies will determine the function of ubiquitin independent protein degradation within mature RBCs. Perhaps this might be related to the RBC life-span or other functions that are yet to be determined.
Footnotes
Acknowledgements
We thank Dr Arvydas Matiukas for assistance with confocal microscopy imaging and Massa Shoura for performing atomic-force microscopy imaging. This project was supported by the NIH Sickle Cell Center Grant HL070588 project awarded to SRG; NIH GM058600 awarded to SW; and RO1 GM67242 and DOD 06177002 awarded to SDL.