
Abstract
Breeding soundness evaluation (BSE) is the primary assessment for determining the reproductive potential of male animals. This method, however, cannot be used to evaluate semen frequently or to predict future semen quality. Computerized analysis of ultrasonographic images provides information on histophysiological changes in male reproductive organs. We hypothesized that: (i) semen parameters would correlate with ultrasonographic characteristics of the distal region (cauda) of the epididymis and (ii) testicular ultrasound images and/or circulating testosterone concentration would predict future semen quality in the ram. Six adult rams underwent BSE and scrotal ultrasonography approximately 60 d apart (average duration of the spermatogenic cycle) both during the breeding (December and February) and non-breeding (June and August) seasons. An inverse correlation was found between pixel intensity (numerical pixel values) of the epididymes and percentage of sperm in semen with normal morphology (r = −0.46, P < 0.05). Pixel heterogeneity (standard deviation of pixel values) correlated negatively with percentage of sperm with normal morphology (r = −0.42, P < 0.05) and directly with percentage of spermatozoa with abnormal tails (r = 0.43, P < 0.05). Pixel heterogeneity of testicular parenchyma obtained approximately 60 d prior to semen evaluation inversely correlated with percentage of sperm with normal morphology (r = −0.73, P < 0.01) and sperm progressive motility (r = −0.76, P < 0.01), and directly with percentage of sperm with abnormal tails (r = 0.72, P < 0.01) and loose heads (r = 0.79, P < 0.01). We concluded that scrotal ultrasonography combined with computer-assisted analyses of epididymal and testicular echotexture in the ram was a valuable method for determining certain current and future semen parameters, respectively.
Introduction
There is constant economic pressure for highly efficient lamb production, including both natural breeding and artificial insemination (AI). Research has shown that, over three generations, the ram is responsible for nearly 87.5% of the genetic contribution to a flock. 1 It is, however, estimated, that one of five rams in unselected populations would be subfertile due mainly to poor or variable semen quality. 2 Periodic fluctuations in semen quality can also be observed in preselected rams maintained in a highly controlled environment.
Breeding soundness evaluation (BSE) is the primary assessment of the ram's capacity for serving and impregnating ewes. 3 It consists of an overall physical examination, with special emphasis on the reproductive organs, and semen evaluation. Semen for evaluation is usually obtained by electroejaculation. The BSE cannot be used frequently to evaluate semen because repeated collections may affect the sperm output and recurrent electroejaculations may be traumatic. At present, there is no reliable method to predict changes in semen quality in the ram. The financial impact of such a technique for all types of commercial breeding operations (i.e. operations involving natural breeding as well as semen collection for AI) could be substantial.
Ultrasonographic examination of the testes, epididymes and accessory sex glands has proven to be a valuable, non-invasive technique for the assessment of genital macroscopic morphology and pathology in several mammalian species of veterinary interest, 4 including the ram. 5 Computerized image analysis of ultrasonograms can provide further information on the structure and function of the tissues. 6,7 The echotexture, or the ultrasonographic appearance of a tissue, can be assessed by determining the pixel intensity and uniformity. 8 Each pixel represents the ability of a discrete unit of tissue to transmit or refract high-frequency ultrasound beams, which in turn is dependent upon the physical properties of the acoustic tissue interfaces (i.e. cellular composition, water and macromolecular content 9 ). Computer-assisted image analysis enables the accurate and objective assessment of numerical pixel values (NPVs), expressed on a grayscale ranging from 0 (absolute black) to 255 (absolute white), and pixel heterogeneity (PSD; standard deviation of NPVs).
Earlier studies in prepubertal bulls and rams have shown that the quantitative echotextural variables are good indicators of changes in testicular histomorphology and endocrine function. In pubescent bulls and rams, testis echogenicity increased during the most active phases of growth of the seminiferous tubules as more mature types of germ cells were produced. 6,10–12 NPVs were also associated with serum concentrations of testosterone (T) in bull calves, particularly during a rise in T secretion heralding the first occurrence of mature spermatozoa. 6 In a most recent study of the temporal relationship between semen quality and ultrasonographic characteristics of testicular tissue after scrotal insulation in beef bulls, pixel intensity values have been correlated with future semen quality (i.e. in ejaculates obtained 2–4 weeks after ultrasonographic examinations) but not with the semen parameters determined within two weeks of ultrasound scanning. 13 Similar studies of associations between the findings of semen evaluation and ultrasonographic characteristics of the testes and epididymes in normal bulls and other mammalian species do not exist.
On the basis of the aforementioned observations, we hypothesized that the future semen quality would be related to echotextural attributes of testicular images, whereas the present semen quality would be closely associated with the quantitative echotextural characteristics of the epididymis, especially those of the distal tail (cauda) region from which spermatozoa are transported into the ejaculatory position. Hence, the most valuable information that could be gathered by ultrasonography and computer-aided image analysis of the epididymal and testicular tissues would be rapid determination of the present and predictability of the future semen quality, respectively.
Spermatogenesis in the ram takes about 50 d to complete, after which time spermatozoa enter the epididymis for final maturation. 3 Sperm cells spend 10–14 d in the epididymis and 60–70% of this time spans the storage in the tail of the epididymis. 14 Therefore, ultrasonographic scanning of the ram's testes at any point in time may allow us to predict the quality of fully mature spermatozoa ejaculated in about 60 d. Sheep are short-day breeders and the reproductive activity of the ram is influenced by photoperiodic changes. 3,15 Hence, this study was conducted during the breeding season (December and February) and non-breeding season (June and August), with the visits to the facility during each season set ∼60 d apart. Serum T concentrations were determined for each time and used as an additional indicator of testicular function.
Materials and methods
Animals and experimental outline
Age, breed and reproductive history of the six Polled Dorset×Rideau Arcott rams
†Age at the outset of the study
‡Expressed as the percentage of Polled Dorset genotype in Polled Dorset×Rideau Arcott crosses
§% of pregnant ewes based on a single ultrasonographic examination (transabdominal) performed between days 50–55 of gestation
*,**Within a column, means with a different number of asterisks are different (P < 0.05; χ 2-test)
Scrotal ultrasonography, image acquistion and analysis
A B-mode ultrasound scanner Aloka SSD-900 equipped with a 7.5-MHz linear array transducer (Aloka Inc, Tokyo, Japan) was used in this study. All settings on the ultrasound unit such as the range, contrast, overall gain, near and far gain, and focal points were kept constant. An aqueous gel was used as a coupling material between the transducer and the scrotum.
13
The testes and epididymis were scanned by grasping the scrotal neck while restraining the ram in place with a head gate. Images containing the largest cross-sectional area in longitudinal-plane view of each testicle and epididymis were frozen as still images, which were then recorded on a DVD player (Pioneer® DVD Recorder DVR-510H; Pioneer Electronics of Canada Inc, Markham, ON, Canada). Computerized image analysis of the testicular parenchyma and epididymes was conducted using image analytical software (Image ProPlus®; Media Cybernetics Inc, San Diego, CA, USA). Using the spot meter technique, three spots of ∼1 cm2 each were placed above the rete testis while avoiding reflection artifacts and overlapping the spots (Figure 1a). The mean NPVs and heterogeneity (standard deviation of NPVs) from each region of interest were recorded. The grey values obtained were averaged to give the overall mean of the respective testes. On the epididymal images, one polygon meter was used to determine echotextural variables of the cauda epididymis (Figure 1b).
Placement of circular (a) and polygonal (b) meters used for computing the quantitative ultrasonographic characteristics of digital testicular and epididymal images, respectively, with Image ProPlus® analytical software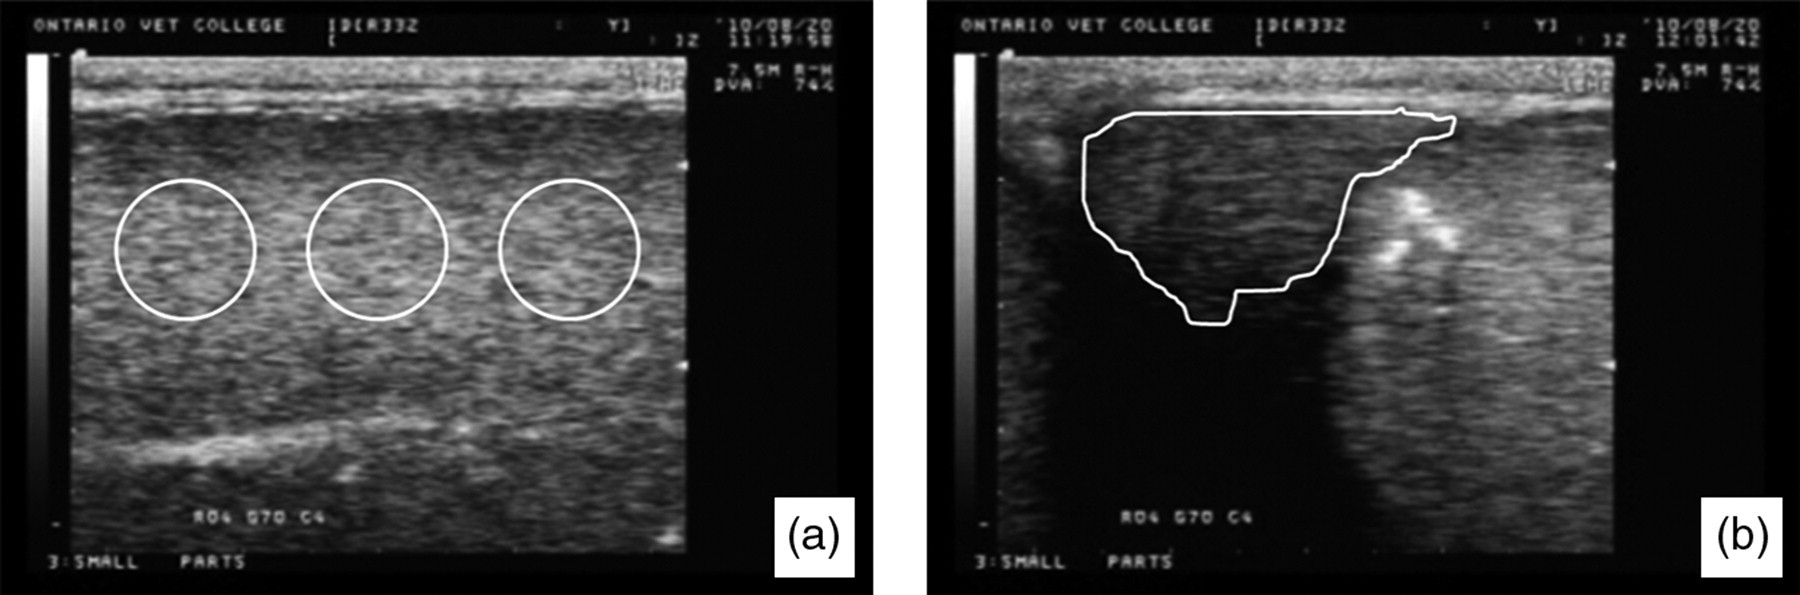
Breeding soundness evaluation
Summary of breeding soundness evaluation (BSE) scores*
S, satisfactory; Q, questionable; U, unsatisfactory; SC, scrotal circumference
*Specific comments are given for the rams classified as unsatisfactory or questionable
T radioimmunoassay
A validated radioimmunoassay 17 was used for the measurement of T in serum samples obtained from the rams. The primary antibody for T (P43-11) was provided by Dr R Etches from the Department of Animal and Poultry Science, University of Guelph, Guelph, ON, Canada. This antiserum cross-reacts with dihydrotestosterone (60%) and androstenedione (15.7%). Duplicate serum samples (25 μL) were assayed directly. The range of the standards used was from 10 to 1000 pg/mL. The assay detection limit was 10 pg/mL and the intra- and inter-assay coefficients of variation were <10%.
Statistical analyses
All statistical analyses were performed using SigmaStat® statistical software (version 3.0; 2003; SPSS Inc, Chicago, IL, USA). Data were analyzed on a per animal basis (i.e. means for left and right testicle/epididymis were averaged). Quantitative parameters obtained during each BSE, testicular/epididymal echotextural variables and serum T concentrations were compared between different months by one-way analysis of variance (ANOVA). When the normality or equal variance tests were significant, data were transformed by natural logarithm or square root before further analysis. Fisher's protected least significant difference was used as a post-ANOVA test to detect differences between individual means. The linear relationships between echotextural variables/T concentrations and semen characteristics were analyzed by simple linear regression. A paired t-test was used to compare echotextural characteristics of the testes and epididymes pre- and postelectroejaculation (June). In addition, the percentages of pregnant ewes sired by each ram were compared by χ 2-test (the formula of Brandt and Snedecor for analysis of proportions). Statistical significance was set at P < 0.05. All results are expressed as mean ± SEM.
Results
Summary of BSE findings
Scrotal circumference measurements and semen parameters
Data ranges for each variable are given in parentheses
*1, none; 2, poor; 3, fair; 4, good; 5, very good
Summary of ultrasonographic image characteristics and T concentrations
Ultrasonographic image attributes and serum testosterone (T) concentrations
NPVs, numerical pixel values; PSD, pixel standard deviation (heterogeneity)
Data ranges for each variable are given in parentheses
*,**,***Within rows, means with a different number of asterisks are different (P < 0.05)
Correlations among ultrasonographic image attributes, T concentrations and semen parameters
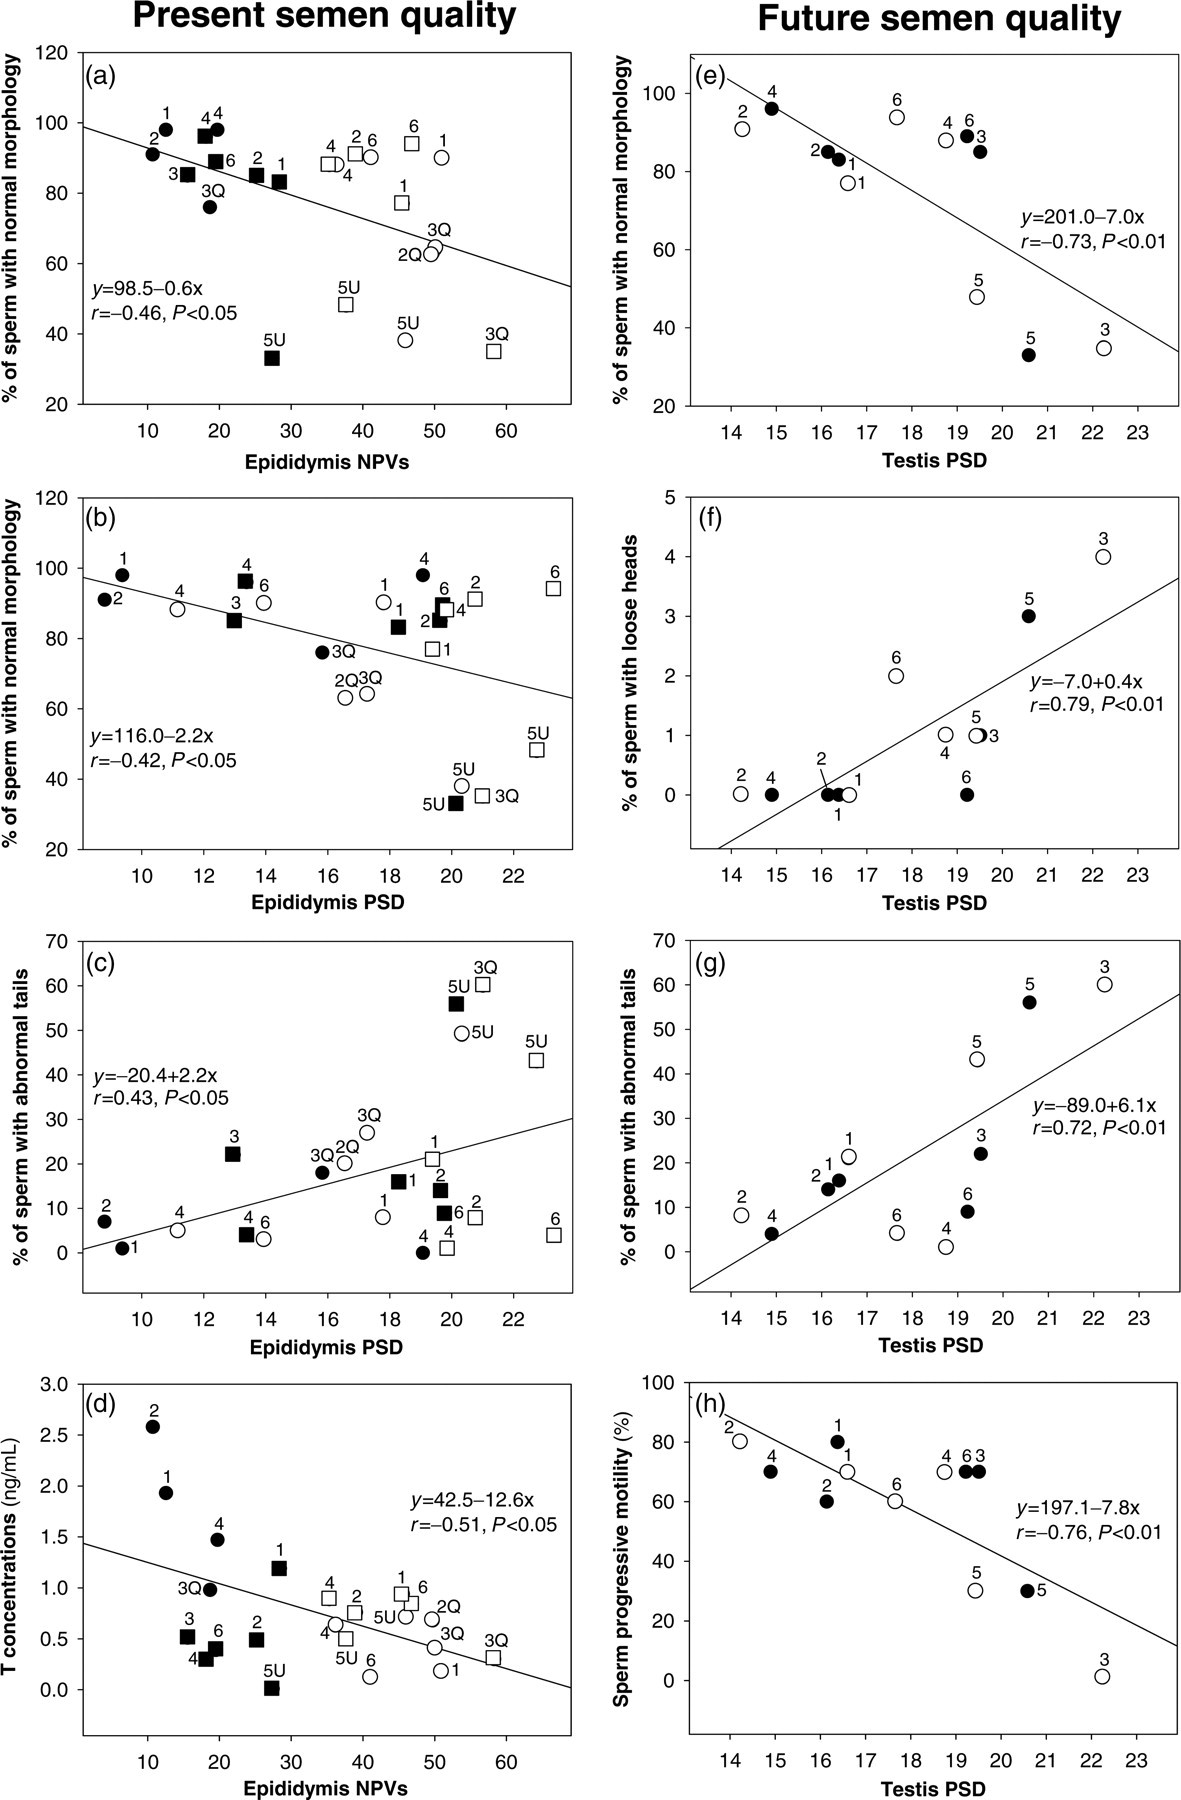
A significant correlation was recorded between NPVs of the epidydimis and percentage of sperm exibiting normal morphology (r = −0.46, P < 0.05; see Figure 2a) at the time of semen collection. Pixel heterogeneity of the ultrasonographic images of the epididymis inversely correlated with percentage of sperm with normal morphology (r = −0.42, P < 0.05; see Figure 2b) and directly with percentage of sperm with abnormal tails (r = 0.43, P < 0.05; see Figure 2c). In addition, NPVs for the epididymis were negatively correlated with serum concentrations of T (r = −0.51, P < 0.05; see Figure 2d). Correlations between epididymal NPVs and percentages of sperm with abnormal tails (r = −0.38, P = 0.08) or loose heads (r = 0.37, P = 0.09), as well as correlations between serum T levels and percentages of sperm with normal morphology (r = 0.39, P = 0.07) or abnormal tails (r = −0.38, P = 0.06) all approached significance. The following sperm parameters correlated with pixel heterogeneity of testicular parenchyma obtained 60 d prior to semen evaluation: percentage of sperm with normal morphology (r = −0.73; P < 0.01; Figure 2e), percentage of sperm with loose heads (r = 0.79, P < 0.01; see Figure 2f), percentage of sperm with abnormal tails (r = 0.72, P < 0.01; see Figure 2g) and sperm progressive motility (r = −0.76, P < 0.01; see Figure 2h).
Scatter plots, regression lines and equations, and the coefficients of correlation (r) with corresponding P values for significant correlations between numerical pixel values (NPVs) and pixel heterogeneity (PSD) of testes and epididymis (input variables), and various semen parameters or serum testosterone (T) concentrations (output variables) determined in the six Polled Dorset×Rideau Arcott rams. Panels a–d depict correlations between echotextural variables and current semen characteristics (• December; ▪ February; ○ June and □ August). Because of technical difficulties with recording, two epididymal images from December could not be analyzed. Panels e–h illustrate associations between echotexture and semen parameters determined approximately 60 d after ultrasonographic examinations (• breeding season: ultrasonographic examinations in December and semen evaluation in February, respectively; ○ non-breeding season: ultrasonographic examinations in June and semen evaluation in August). 1–6: animal numbers. Q and U denote the breeding soundness classifications: Q, questionable and U, unsatisfactory; all remaining observations were categorized as satisfactory
Changes in epididymal echotexture after electroejaculation
Testicular image attributes and epididymal pixel heterogeneity did not change (P > 0.05) after electroejaculation (Figure 3), but the difference in NPVs for the epididymis before and after semen collection approached significance (44.9 ± 2.6 and 51.1 ± 3.4, respectively; P < 0.10).
Echotextural attributes (mean ± SEM) of the testes and epididymes in separate sets of images obtained immediately before and after electroejaculation in the six rams examined in June. NPVs, numerical pixel values (pixel intensity); PSD, standard deviation of numerical pixel values (pixel heterogeneity)
Discussion
There has been no study that relates ultrasonographic image characteristics of the epididymis to semen parameters in ruminants. In a previous ultrasonographic study of sexually mature boars, 18 echogenicity of the caput epididymis correlated positively with the total sperm count and ejaculate volume, and negatively with sperm concentration postcollection; no relationship was found between ultrasonographic attributes of the corpus and cauda epididymis and any of the ejaculate parameters analyzed. In the rams of the present study, there were moderate negative correlations between echotextural variables of the cauda epididymis and percentage of sperm with normal morphology, and a direct relationship between epididymal pixel heterogeneity and the proportion of sperm with tail defects. These correlations were observed in the rams examined during and outside the seasonal breeding activity.
The fact that sperm with abnormal tails could be identified by epididymal echotexture analysis is probably due to the high numbers of spermatozoa with tail defects detected in this study. Tail abnormalities were a major histopathology seen in up to 60% of spermatozoa in semen samples (Tables 2 and 3). However, the specific anatomical and physiological reasons for correlations among epididymal echotexture and current semen parameters are yet to be elucidated. Sperm in the ejaculate is drawn mostly from the storage in the cauda epididymis, where fluid secretions are constantly being added to the sperm. 19 The fact that in the present study NPVs for the epididymis tended to increase after electroejaculation (Figure 3) suggests that pixel intensity is, at least to some extent, a function of epididymal semen and/or fluid content. However, in a study by Kauffold et al., 19 echogenicity was higher before than after semen collection for all parts of the boar's epididymis. Mean NPVs increase proportionally to cellular density (i.e. sperm concentration) but decline during the periods of increased liquid production. The difference in epididymal echotexture between the present experiment and earlier observations by Kauffold et al. 18 may be attributed to the differences in epididymal semen concentrations and fluid content between the two species. Pixel heterogeneity is a result of coexistence of echoic (i.e. spermatozoa) and non-echoic (i.e. epididymal fluid) components within a tissue segment and so it can also be affected by changes in epididymal sperm concentration. Based on the present results of image analyses, it is attractive to speculate that increased sperm accumulation and/or decreased fluid accumulation in the tail of the epididymis were associated with, or responsible for, the presence of multiple spermatozoa with abnormal tails present in ejaculates of rams. The fact that PSD did not change when comparing the values before and after electroejaculation and the increment in NPVs only approached significance (Figure 3) suggests that epididymal echotexture may be related to its microscopic structure as well as semen/fluid content. Unfortunately, there have been no studies that relate epididymal echotexture to its histomorphology in the ram.
Changes in circulating T concentrations were associated with testicular echotexture in pre- and peripubertal bull calves. 6 In the present study, we failed to demonstrate a correlation between testicular echotexture and serum T concentrations. There was a moderate negative correlation between epididymal NPVs and serum T concentrations. A lack of correlation between systemic T and testicular ultrasonographic characteristics in rams may be due to relatively small numbers of the interstitial cells of Leydig in the testis; such cells constitute approximately 1% of the entire testicular volume in the adult ram and approximately 5% in the bull. 20 Moreover, interstitial cell volume declines during the non-breeding season of rams. 20–22 Androgens, however, are the key hormones governing the structure and function of the epididymis. 20 Testicular T and 5α-dihydrotestosterone synthesized by the epithelial cells of the cauda epididymis control its structural integrity and secretory function. 23,24 Computerized analysis of the epididymal ultrasonograms may provide a basis for developing a rapid, non-invasive method of determining T concentrations.
Correlations in mature males between ultrasonographic image characteristics of the testes and present semen quality have not been found in boars, 25 humans, 26 bulls 27 or dogs. 28 In a recent study in beef bulls after scrotal insulation, testicular echotexture was correlated with semen parameters from ejaculates obtained between two and four weeks after ultrasound examinations, but not with the quality of semen within two weeks of ultrasonography. 13 Those results provided the first indication that testicular pixel values might be a good predictor of the future semen quality. Our analyses have demonstrated that testicular echotexture correlates with the proportion of spermatozoa exhibiting tail and head defects, and sperm progressive motility determined ∼60 d after ultrasonographic scanning; changes in the latter characteristic being clearly a result of abnormal tail formation. Interestingly, linear relationships between quantitative image attributes (pixel heterogeneity) of testes parenchyma and future semen parameters appeared to be stronger than correlations among epididymal echotexture and current semen characteristics (Figure 2). The usefulness of testicular image analysis for determining histomorphological changes in the seminiferous tubules of bulls and rams has been amply documented. In both species, pixel intensity values rose in parallel to an increase in seminiferous tubule epithelial height, 29 the proportion of tubules with a lumen and the size of the lumen. 6,7 However, the correlations between the luminal and tubular area of seminiferous tubules and pixel heterogeneity have not been observed in peripubertal ram lambs. 7 More studies are required to corroborate the temporal relationships between testicular morphology, echotexture and impending semen quality. Nevertheless, testicular ultrasonography appears to be a potentially useful method for predicting future semen parameters in adult rams. It would now be interesting and justified to examine if similar relationships exist in other mammalian species differing in the duration of spermatogenesis and epididymal transport/storage of spermatozoa.
Although the main goal of the present study was to evaluate the usefulness of scrotal ultrasonography for the assessment of semen quality in the ram, the present investigation is, to the best of our knowledge, the first report of changes in testicular and epididymal echotexture during the mating and non-mating seasons. The total numbers of Leydig cells, Sertoli cells and spermatogonia (undifferentiated A 0 and cyclic A 1) are not affected by the changes in photoperiod, but the size of the Leydig and the Sertoli cells and sperm production are all significantly reduced in the rams exposed to long days. 21,22 Our results have revealed significant differences in the ultrasonographic characteristics of the testes and epididymes and serum T concentrations (Table 3) between the breeding and non-breeding season; the greatest differences were generally observed between the mid-breeding season (December) and the anestrous period (June and August). Combined with the results of correlation analyses (Figure 2), these observations strongly suggest that: (i) epididymal echotexture provides valuable information on the secretory activity of Leydig cells; (ii) testicular image attributes may correlate with cellular density and the efficiency of spermatogenesis; and (iii) both testicular and epididymal image analyses have the makings of the technique to detect the extent of major sperm abnormalities. Temporal associations between testicular/epididymal echotexture and histophysiology warrant further studies as such associations may aid in the development of scrotal ultrasonography as a non-invasive, diagnostic and prognostic tool for clinical and research-allied assessment of testicular function.
Another interesting observation from this experiment is a discrepancy between semen evaluation scores and the pregnancy rates recorded in ewes sired by the present rams. On the basis of BSE results, the unsatisfactory or periodically questionable breeders were rams no. 5, 3 and 2, respectively (Table 2), whereas a ram with the lowest reproductive success (% of positive pregnancy testing) was ram no. 6 (Table 1). All ewes bred by the rams employed in this study were Polled Dorsett×Rideau Arcott crosses with no differences in the mean age, parity or genotype between the breeding groups (data not shown); therefore, any differences in fertility were less likely to be caused by the differences in ewes’ breeding potential. Notably, ram no. 6 had the lowest percentage of Polled Dorset genotype of all cross-bred rams tested in this study. The Rideau Arcott is primarily a maternal breed, and the Dorset is used effectively in North America as both a maternal and terminal sire breed. 30 Therefore, the genetic reproductive capacity of different breeds may be a decisive factor in determining the productivity of individual, clinically healthy rams in commercial settings. Future studies of semen parameters in relation to reproductive success of varying sheep breeds are necessary.
In conclusion, scrotal ultrasonography combined with computerized analysis of epididymal and testicular images is a useful method for determining present and future semen quality in the ram. This technique may be an alternative to semen evaluation as it permits detection of major sperm defects throughout the year and at frequent intervals in individual animals.
Footnotes
Acknowledgements
The authors would like to thank the staff at Ponsonby Sheep Research Station for help with care and husbandry of experimental animals. The present results were presented, in preliminary form, at the 15th annual ESDAR (European Society for Domestic Animal Reproduction) conference in Antalya, Turkey (15–17 September 2011; poster #P7;