
Abstract
In preparation for islet transplantation, diabetes was induced using streptozotocin (STZ) in non-human primates ranging from juveniles to adults with diverse body types: we studied the process with respect to the diabetic state and emergence of adverse events (AEs) and their severity, and identified risk factors for clinical and laboratory AEs. Pharmaceutical-grade STZ was given based on body surface area (BSA) (1050–1250 mg/m2, equivalent to 80–108 mg/kg) or on body weight (BW) (100 mg/kg) to 54 cynomolgus and 24 rhesus macaques. AEs were related to risk factors, i.e. obesity parameters, BW and BSA, age and STZ dose in mg/m2. Clinical AEs during the first days after infusion prompted euthanasia of three animals. Except for those three animals, diabetes was successfully induced as shown by circulating C-peptide levels, the intravenous glucose tolerance test and/or arginine stimulation test. C-peptide after infusion weakly correlated (P = 0.048) with STZ dose in mg/m2. Grade ≥3 nephrotoxicity or hepatotoxicity (serum markers >3× baseline or >5 × baseline, respectively) occurred in about 10% of cases and were generally mild and reversible. Grade ≥2 clinical AEs occurred in seven of 78 animals, reversed in four cases and significantly correlated with obesity parameters. Taking girth-to-height ratio (GHtR) as an indicator of obesity, with threshold value 0.92–0.95, the positive predictive value of obesity for AEs was 92% and the specificity 94%. We conclude that diabetes is successfully induced in non-obese animals using a 100 mg/kg pharmaceutical grade STZ dose. Obesity is a significant risk factor, and animals with a higher than normal GHtR should preferably receive a lower dose. The incidence of relevant clinical or laboratory AEs is low. Careful monitoring and supportive medical intervention can result in recovery of AEs.
Introduction
Research and development of new and innovative approaches in the treatment and cure of diabetes often requires modeling in diabetic animals. Non-human primates (NHPs) have been widely used in models of type 1 (T1) diabetes and are particularly useful in transplant studies because of the biological complexity and close similarity of their immune response to grafted organs, tissues or cells, which increases the value of translational research in extrapolation results to the situation in a patient. At the practical level, this includes the possibility of multifaceted immunological monitoring via blood sampling and in vitro assays, similar to the human situation.
Spontaneous T1 diabetes occurs in a far too low incidence in NHPs; therefore, diabetes is experimentally induced either by pancreatectomy or by treatment with the beta-cell toxic drug streptozotocin (STZ). Both methods have their advantages and disadvantages, and require a high level of experience to avoid morbidity and mortality. Pancreatectomy is a major surgery with its intrinsic adverse effects such as malabsorption syndrome leading to body weight (BW) loss, and with a substantial postoperative recovery period that requires extensive analgesic management. 1–4 Chemical diabetes induction using STZ is widely used in NHPs and other species. 5–13 This non-surgical approach is especially desirable in transplant protocols where animals will inevitably have one or more major survival abdominal surgical procedures for transplantation because it spares the animal from a major survival surgery in the pretransplant period and leaves the abdomen naive.
STZ was first isolated in 1959 from the bacteria Streptomyces achromogenes: it is a compound that preferentially targets beta cells through the glucose transporter-2 receptor. 14 Its utility was subsequently shown in humans in the treatment of insulinomas, 15 Zollinger–Ellison syndrome, 16 Verner–Morrison syndrome 17 and carcinoids. 18 In these diseases, STZ was typically dosed in grams per body surface area (BSA), and administered in several smaller doses, not exceeding 1.5 g/m2/week, to minimize side-effects. 19 The in vivo half-life of STZ is 10–15 min. Its preferential absorption to islets of Langerhans has been shown in radiolabeling studies in mice and rats. 20 The mode of action has best been demonstrated in mouse studies. 21 At a high dose, normally given singly, the compound selectively targets beta cells by its alkylating property similar to that of cytotoxic compounds. 22 At low dose levels, generally given in multiple exposures, the chemical is able to elicit an immune and inflammatory reaction, presumably and amongst others related with the release of glutamic acid decarboxylase autoantigens. Under this condition, the destruction of beta cells and induction of the hyperglycemic state are associated with inflammatory infiltrates including lymphocytes in the pancreatic islets. 23
Various groups using STZ in diabetes induction use similar but not identical regimens, and also different metabolic criteria for effective diabetes induction are applied. 24 More recently, the International Xenotransplantation Association (IXA) has specified criteria in a consensus statement for preclinical efficacy studies suggesting an appropriate standard that can consistently be applied to determine success or failure of the diabetic state. 25 Most groups have observed and reported complications ranging from laboratory abnormalities to severe mortality. We previously reported on adverse side-effects in NHPs, including one animal that had to be sacrificed because of renal failure. 26 In this study, we also observed that drugs like cyclosporine facilitate the adverse side-effect of STZ, which is most likely due to their nephrotoxic potential. Since this study was published in 2005, we have expanded our experience in a large series of cynomolgus and rhesus macaques in our islet transplantation program in diabetic NHPs, which enables us to perform a retrospective evaluation of efficacy and adverse effects. We use a relatively high single STZ dose in diabetes induction to ensure that the beta cells are irreversibly destroyed: this is necessary to avoid any confounding in the interpretation of subsequent transplant studies that are conducted with the aim to document the efficacy of beta-cell replacement. Like in humans, NHPs show a broad heterogeneity in both intrinsic factors and physiologic factors. We here report on the effects of STZ in 78 NHPs and describe risk factors that contribute to toxicity. In an effort to improve the outcome of STZ diabetes induction, we suggest refined criteria by which diabetes induction can be simply accomplished with limited adverse effects.
Materials and methods
Animals
Our studies are approved by the University of Minnesota Institutional Animal Care and Use Committee, are conducted in compliance with the Animal Welfare Act and adhere to principles stated in the Guide for Care and Use of Laboratory Animals. Between December 2005 and July 2010, 78 NHPs underwent diabetes induction using STZ as part of an islet transplantation program. The cohort comprised of 54 cynomolgus macaques (Macaca fascicularis) and 24 rhesus macaques (Macaca mulatta): 59 males and 19 females. The cynomolgus macaques weighed between 2.9 and 6.5 kg (median 4.4 kg) and the rhesus macaques weighed between 3.1 and 13.0 kg (median 5.5 kg). The cynomolgus macaques' age at induction was between 3.5 and 7.2 y and the rhesus macaques' age was between 1.8 and 6.7 y (Table 1). All animals were purpose-bred and purchased from institutionally approved commercial vendors. They were housed in pairs or small groups of the same sex. They had free access to water and were fed biscuits (High-Protein Monkey Chow 5045, Purina Mills, St Louis, MO, USA) based on BW. Their diet was enriched liberally with fresh fruits, vegetables, grains, beans, nuts and a multivitamin. The NHPs participated in an environmental enrichment program that included social play, toys, music, and regularly scheduled access to large exercise and swimming areas. To facilitate venous access, a totally implantable port and catheter was placed using a previously described technique. 27 NHPs were trained to cooperate in medical procedures including shifting into transport boxes for weighing, presentation of the foot for routine heelstick blood glucose (BG) measurements, presentation of the leg for access to a vascular port for blood collection or metabolic testing and drug administration, and basic physical examinations. Semiannual veterinary physical examinations included a subjective body condition score based on a visual assessment and palpation. 28 Starting in December 2007, animals underwent additional ‘obesity’ screening to supplement basic BW data with the measurement of height, mid-girth circumference and thigh circumference. Measurements were used in subsequent calculations including girth-to-height ratio (GHtR) and Rhesus Obesity Index (RhOI). The RhOI is modified from the body mass index (BMI) used in humans, and is calculated as BW (kg) divided by the square of the crown-rump length (cm). 29 The mid-girth circumference is divided by the height to give the GHtR as an estimate of body shape. We chose to use both parameters in studying obesity because differences in body proportions and muscularity affect RhOI similarly to the human BMI. The GHtR is useful to give an estimate of body shape: a lower ratio indicates a leaner body shape and a higher ratio indicates a rounder body shape (i.e. obesity). We determined median and interquartile range for RhOI and GHtR by cohort and then set the threshold for each parameter at the upper 75% percentile (Q3 interquartile range). The statistical determination of the Q3 for RhOI was 5.0 for cynomolgus and 5.2 for rhesus macaques. The statistical determination of the Q3 for GHtR was 0.95 for cynomolgus and 0.92 for rhesus macaques. Plotting the combination of RhOI and GHtR, with intersection at threshold values, presents quadrants allowing for categorization of monkeys into four groups: (A) small to average height with abdominal obesity; (B) tall height with abdominal obesity; (C) small to average height and lean; and (D) tall height, lean and muscular. Animals in categories A and B were defined as obese.
Demographic characteristics, according to species
BG, blood glucose; STZ, streptozotocin; GHtR, girth-to-height ratio; RhOI, Rhesus Obesity Index
Data presented as median (interquartile range) unless indicated otherwise
Streptozotocin injection
To assess suitability for diabetes induction, each individual animal was examined one day before STZ infusion using cooperative handling in the home cage for attitude, general appearance (gait, posture, condition), temperament and interaction within their social group. Between 500 and 1000 mL of palatable fluids, generally a 50:50 mixture of fruit juice and water, were then offered cageside for oral hydration, and solid food was removed from the cage in the afternoon. The following morning, the animal received antiemetic prophylaxis about 30–60 min prior to STZ infusion to prevent postinfusion nausea and vomiting, either ondansetron 1–4 mg as a total dose per os or promethazine 0.25–1 mg/kg intramuscularly, or a combination of both. Animals were then sedated with 8–15 mg/kg ketamine or 3–6 mg/kg telazol intramuscularly, and were hydrated intravenously with 20–35 mL/kg physiological saline (0.9% sodium chloride). One vial containing 1 g STZ (streptozotocin; Zanosar®, Sicor Pharmaceuticals, Irvine, CA, USA) was reconstituted with 9.5 mL cold physiological saline as directed by the manufacturer. The resulting pale-gold solution contained 100 mg streptozotocin and 22 mg citric acid per mL. The STZ dose was expressed both in mg/kg and in mg/m2, in which the BSA in m2 was calculated from the BW in grams following the formula: BSA = BW0.67 × 12/10,000. In 10 animals the BSA-based dosing was used to deliver a STZ dose of 1050–1250 mg/m2 (fixed-dose equivalent to 80–108 mg/kg). In the remaining 68 animals, a flat fixed STZ dose of 100 mg/kg (BSA-based dose equivalent to 1224–1900 mg/m2) was given. STZ was further diluted to a total of 12 mL with cold physiological saline, and immediately administered intravenously (approximately 30–60 s infusion time). Special care was taken to administer STZ immediately after preparation to avoid decomposition.
Follow-up care
After STZ infusion, animals were monitored at least twice daily for BG, appetite, urine or stool type or frequency, and general appearance. Insulin (glargine; Lantus®, Sanofi-Aventis, Bridgewater, NJ, USA and lispro; Humalog®, Eli Lilly, Indianapolis, IN, USA) was initiated after three consecutive BG readings exceeding 300 mg/dL or after 48 h, whichever occurred first, and given twice daily per sliding scale targeting BG levels of 100–200 mg/dL. Throughout the experimental period, the animals were regularly assessed for BW, blood hematological parameters (white blood cell counts [WBC], hemoglobin [Hb], hematocrit, platelet counts and lymphocyte counts) and serum chemistry (creatinine, blood urea nitrogen [BUN], alanine aminotransferase [ALT], alkaline phosphatase [ALP], aspartate aminotransferase [AST], bilirubin, albumin, sodium, potassium, chloride, calcium, inorganic phosphorus, cholesterol and triglycerides).
Evaluation of efficacy
Consistent with the criteria outlined by the IXA consensus statement for conduct of preclinical trials, 25 the diabetic state was confirmed by a fasting C-peptide below 0.5 ng/mL or one-third the value of the preinduction period, the absence of a stimulated C-peptide response during an intravenous glucose tolerance test (IVGTT) or arginine stimulation test (ArgST) (<0.3 ng/mL), in combination with persistent hyperglycemia (BG ≥ 200 mg/dL) prior to the initiation of exogenous insulin. Diabetes induction was only considered successful if the diabetic state was documented, and there were no complications that prevented enrollment onto a subsequent transplant study. C-peptide concentration was measured in serum using a commercially available radioimmunoassay kit developed for human plasma (Human C-Peptide double antibody RIA kit, catalog # KPED1; Siemens Healthcare Diagnostics, Deerfield, IL, USA). The 31-amino-acid sequence of C-peptide is highly conserved between the respective species of the present study and differs only by a single amino acid. 30 Metabolic challenges included IVGTT or ArgST performed as follows: for IVGTT an intravenous glucose infusion (0.5 g dextrose/kg BW) was given, three baseline paired samples for C-peptide and BG were obtained prior to infusion of glucose, then followed by samples at 1, 3, 5, 7 and 10 min after glucose infusion. Additional samples for BG only were taken at 15, 20, 25, 30 and 60 min to document the glucose disappearance rate. The acute C-peptide response (ACR) to glucose was calculated by subtracting the average of the basal values from the average of time points 1, 3, 5, 7 and 10 min. The glucose disappearance rate (K G, %/min) was calculated as the slope of the decline of the log-transformed value of BG between 10 and 30 min. 31 For ArgST an intravenous infusion of arginine (0.07 g/kg BW) was given, two baseline samples were obtained just prior to arginine injection, and then samples were obtained at 2, 3, 4 and 5 min after arginine injection. The ACR to arginine was calculated by subtracting the average of the basal values from the peak value obtained between 2 and 5 min.
The average insulin requirement was based on the median of dose levels during seven days prior to enrollment in a transplant study, or before 1 December 2010.
In animals that either reached the study endpoint or manifested a deteriorating clinical condition, euthanasia was performed followed by a detailed necropsy and histological evaluation of multiple organs. Conventional histopathology was performed on tissue fixed in buffered formalin and embedded in paraffin: 4
Evaluation of clinical adverse events
Adverse events (AEs) were evaluated using the Veterinary Co-operative Oncology Group – Common Terminology criteria for Adverse Events (VCOG-CTAE) following chemotherapy. 32 The VCOG-CTAE have been specifically developed for dogs and cats with modifications from the standard National Cancer Institute (NCI) common terminology for patients (particularly in constitutional signs and recognition of pain): this is easier to translate to NHPs than the NCI criteria that are applied to human patients. Using the VCOG-CTAE criteria, severity was graded as follows: grade 1 – mild; grade 2 – moderate; grade 3 – severe; grade 4 – life-threatening or disabling AEs; grade 5 – death related to AEs. Low-grade events (grade ≤2) are considered tolerable and manageable in contrast to very undesirable high grade events (grade ≥3). All events were scored; in the present analysis only moderate or greater events (scoring a grade ≥2) are described.
Laboratory assessments and scoring for AEs
Serum biochemical analyses were performed using an automated analyzer (Olympus AU400e; Olympus America, Melville, NY, USA). Cell counts and erythrocyte indices were performed using an automated analyzer validated for use in NHPs (Advia 2120; Siemens Healthcare Diagnostics Inc, Tarrytown, NY, USA). Manual smear evaluation was performed, consisting of visual verification of automated parameters, a 100-cell differential leukocyte count and a complete evaluation of cell morphology including examination for hemoparasites.
Regarding laboratory assessments, general reference intervals for each cohort were generated using the recommendation of the International Federation of Clinical Chemistry for estimating a confidence range of 90% for each limit of the reference interval in a non-Gaussian distribution. 33 The VCOG-CTAE criteria for AEs in laboratory values include the fold change in relation to normal. However, for NHPs, wide ranges of ‘normal’ values have been reported in the literature, and therefore a more conservative scoring approach was used in the present study: the animal baseline (pre-STZ) values were considered normal and the peak change from the baseline value during the 30 days after STZ infusion was scored to assess AEs. For nephrotoxicity, a 1.5–3.0 times peak change from baseline in either creatinine or BUN was given a score 2 and a peak change of greater than 3.0 times baseline was given a score of 3. For hepatotoxicity, a 2.5–5.0 times peak change from baseline in either ALT or ALP was given a score 2 and a peak change of greater than 5.0 times baseline was given a score of 3. In addition, animals were co-categorized using the RIFLE (Risk, Injury, Failure, Loss, End-stage renal disease) Classification System for Acute Kidney Injury (AKI) commonly used to define renal injury. 34 The VCOG-CTAE score 2 criteria was equivalent to the RIFLE category ‘risk’ and the score 3 criteria was equivalent to ‘injury’.
Data analysis
The association between outcomes attributed to STZ toxicity and all possible covariates was analyzed following a bivariate fashion to identify potential risk and protective factors (GraphPad, version 3.1a, InStat Software; GraphPad Software, Inc, La Jolla, CA, USA); interactions were reassessed using multivariate regression to determine the correlation coefficient R 2 (JMP, SAS Institute, Cary, NC, USA). For demographic variables, median values with interquartile ranges are presented. The non-parametric Wilcoxon–Mann–Whitney test was used to compare median values, the Fisher's exact test was applied to compare proportions and one-way analysis of variance (Bonferroni corrected) was used to determine the significance of differences from baseline. The level of significance was set at P < 0.05.
Results
Efficacy
Diabetes was successfully induced in all but three animals that were euthanized for severe AEs, giving a success rate of 96% (75/78). Data are presented in Table 2. IVGTT and ArgST were used interchangeably to measure beta-cell function, and at least one or sometimes both were performed to confirm the diabetic state after STZ infusion. Loss of beta-cell function was also confirmed by histological observation of the pancreas after euthanasia, the results being essentially the same for all cases: the histology of the pancreas did not manifest abnormalities, but in insulin staining, islets of Langerhans were negative with, in some cases, a few scattered spots, which did not reflect intracellular staining.
Efficacy of STZ infusion in cynomolgus and rhesus macaques
STZ, streptozotocin; BG, blood glucose; IVGTT, intravenous glucose tolerance test; ACRgluc, acute C-peptide response to glucose; K G, glucose disappearance constant between 10 and 30 min; ArgST, arginine stimulation; ACRarg, acute C-peptide response to arginine
Data presented as median (interquartile range)
Cynomolgus macaques
Prior to STZ infusion the median of fasting BG and C-peptide values in the cynomolgus macaques (n = 54) were 59 mg/dL (interquartile range 47–73 mg/dL; Table 1) and 2.1 ng/mL (interquartile range 1.3–3.4 ng/mL; Table 2), respectively. A number of animals in this group underwent metabolic testing prior to STZ infusion to establish normal ranges for the IVGTT and ArgST assays. The median ACR to glucose in the IVGTT (n = 21) was 3.0 ng/mL (interquartile range 2.2–4.9 ng/mL) and K G was 3.0%/min (interquartile range 1.9–3.7%/min); the median ACR to arginine in the ArgST (n = 15) was 1.2 ng/mL (interquartile range 1.0–2.1 ng/mL; Table 2 and Figure 2). After STZ infusion, all animals developed marked hyperglycemia (BG ≥ 300 mg/dL) starting at a median of one day (interquartile range 0–2 days). After STZ infusion, the median insulin requirement and C-peptide were 2.0 U/kg/d (interquartile range 1.3–2.5 U/kg/d) and 0 ng/mL (0–0.1 ng/mL), respectively. There was a statistically significant, albeit weak, relationship between dose (mg/m2) and the diabetic state as measured by C-peptide (P = 0.048, R 2 = 0.07), but not between dose and insulin requirement (Figure 1). Three animals had missing data for C-peptide levels before STZ administration, and one animal was euthanized before a post-STZ C-peptide level could be assessed. To confirm a diabetic state, animals were subjected an IVGTT and/or ArgST (Table 2, Figure 2): this was except for one animal that was euthanized prior to testing. The median ACR to glucose after STZ was 0 ng/mL (interquartile range 0–0.0 ng/mL), the K G was 0.8%/min (interquartile range 0.6–1.1%/min), and the median ACR to arginine was 0 ng/mL (interquartile range 0–0 ng/mL), confirming the diabetic state.
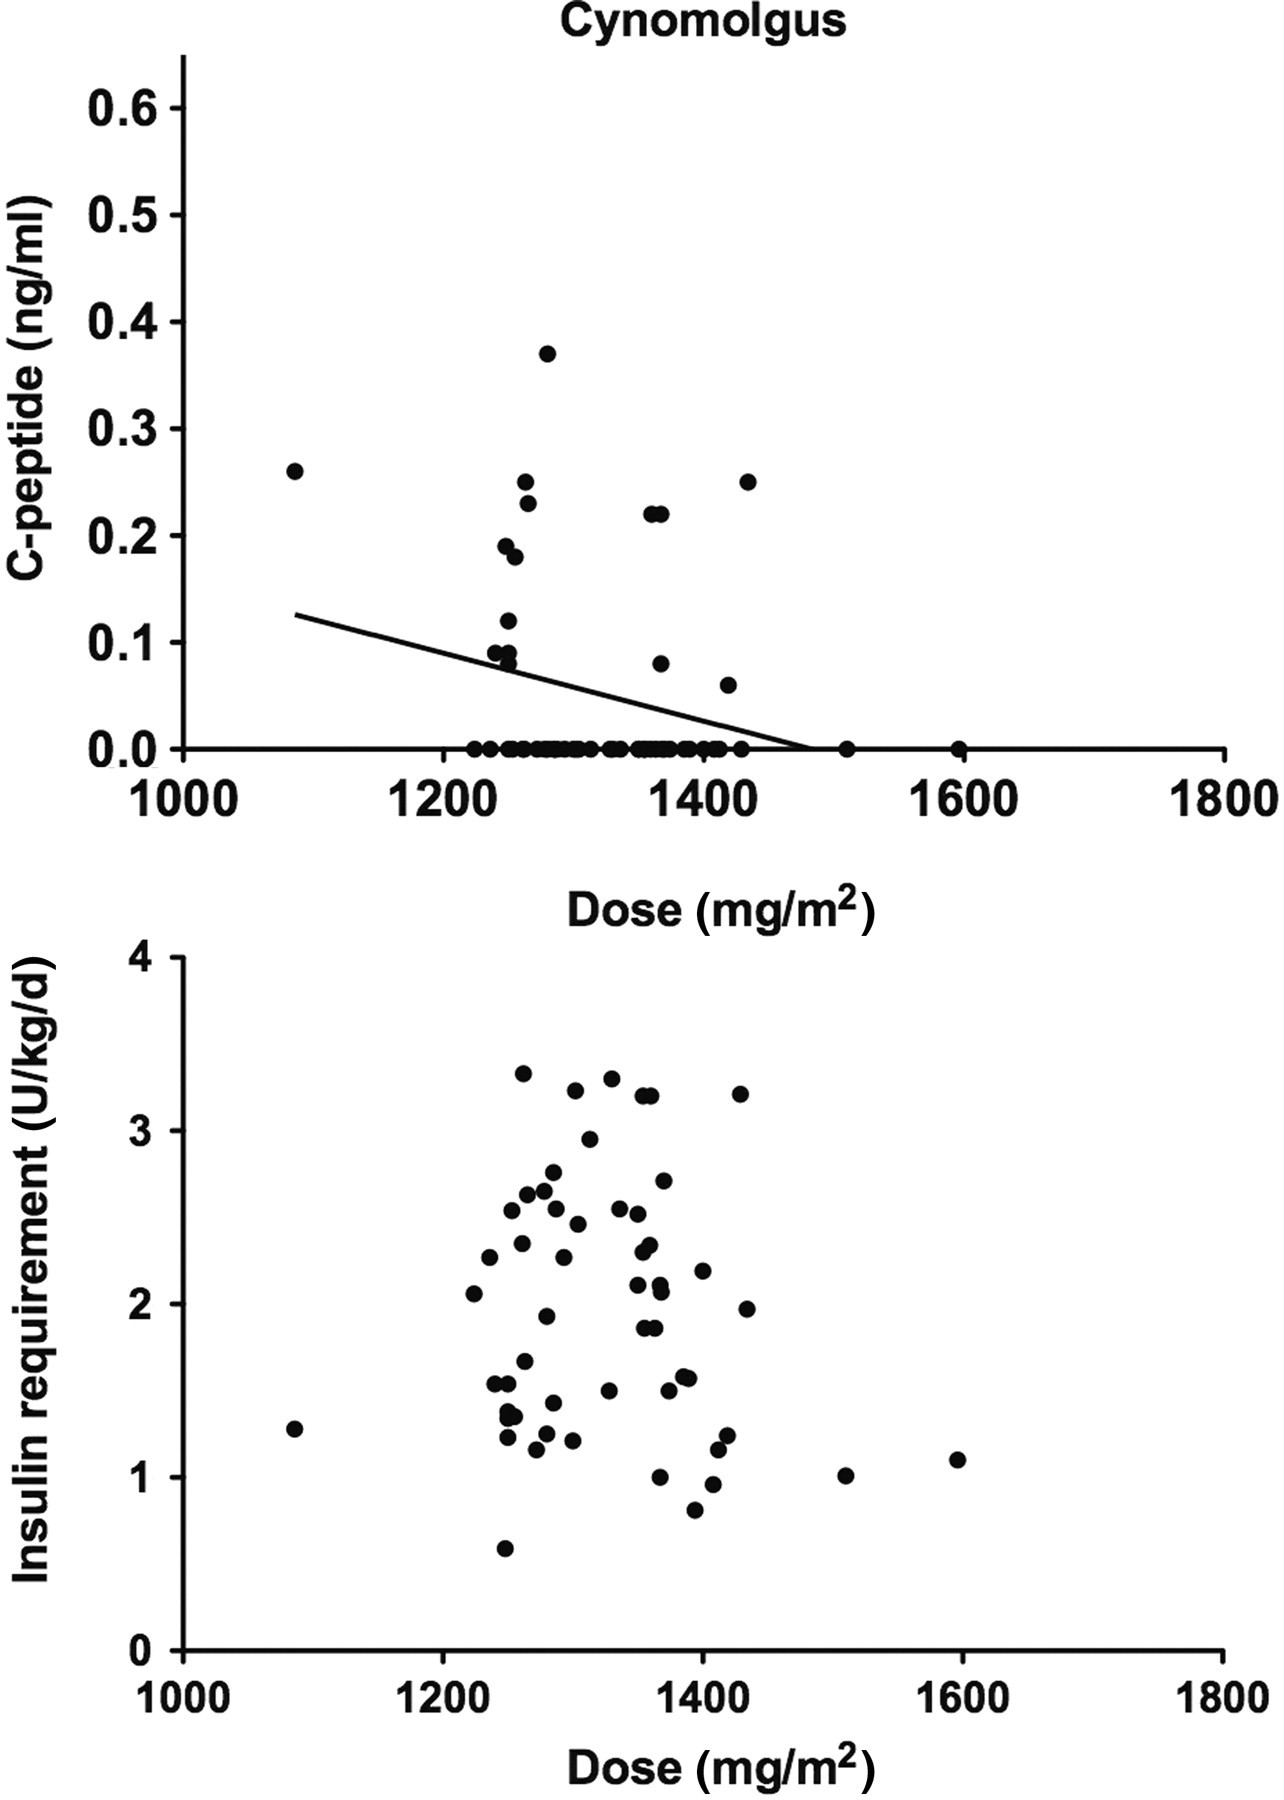
C-peptide concentration (upper panels) and insulin requirement (lower panels) after streptozotocin (STZ) treatment plotted against STZ dose in individual cynomolgus macaques. The statistically significant correlation between C-peptide and STZ dose in cynomolgus macaques is presented as a line
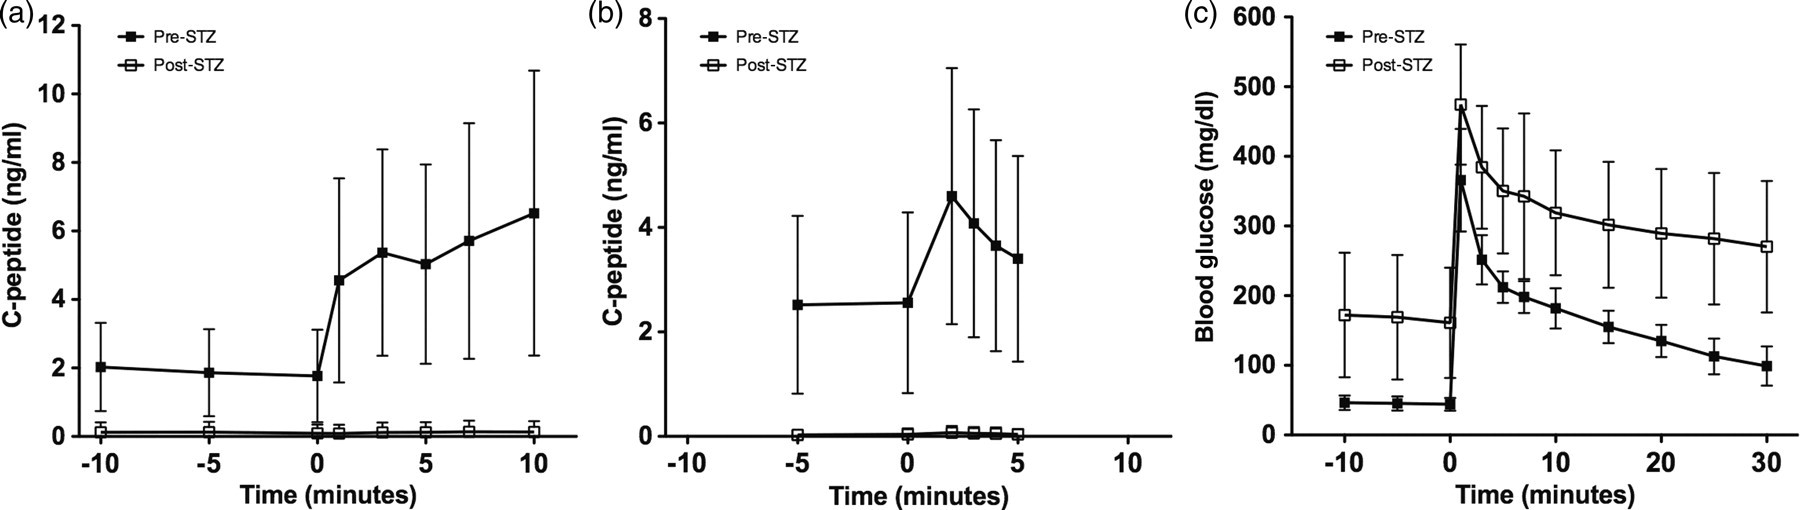
Response to metabolic challenge in cynomolgus and rhesus macaques. (a) Acute C-peptide response (ACR) in the intravenous glucose tolerance test (IVGTT) before (n = 31) and after (n = 65) streptozotocin (STZ) treatment; (b) ACR in arginine stimulation test (ArgST) before (n = 22) and after (n = 24) STZ treatment; and (c) blood glucose (BG) response in the IVGTT before (n = 31) and after (n = 65) STZ. Data presented are arithmetic mean vales ± SD
Rhesus macaques
Before STZ infusion, the median fasting BG and C-peptide values in the rhesus macaques (n = 24) were 59 mg/dL (interquartile range 53–73 mg/dL) and 1.4 ng/mL (interquartile range 1.1–1.7 ng/mL), respectively (Table 1 and Table 2). A subgroup underwent additional metabolic testing (Table 2). The median ACR to glucose in the IVGTT (n = 10) was 2.6 ng/mL (interquartile range 2.2–4.8 ng/mL) and K G was 3.6%/min (interquartile range 3.0–4.8%/min); the median ACR to arginine in the ArgST (n = 7) was 2.3 ng/mL (interquartile range 1.7–4.1 ng/mL) (Table 2). After STZ infusion, all animals developed marked hyperglycemia (BG ≥ 300 mg/dL) starting at a median of day 0 (interquartile range 0–1 days). After STZ infusion, the median insulin requirement and C-peptide levels were 1.7 U/kg/d (interquartile range 1.5–2.1 U/k/d) and 0 ng/mL (interquartile range 0–0.08 ng/mL), respectively. There was no relationship between dose (mg/m2) and the diabetic state as measured by C-peptide or insulin requirement. Two animals had missing data for C-peptide levels before STZ administration, and one animal was euthanized before a post-STZ C-peptide level could be assessed. To confirm the diabetic state, animals were subjected to IVGTT and/or ArgST (Table 2 and Figure 2). This was except for one animal that was euthanized prior to stimulation. The median ACR to glucose after STZ infusion was 0 ng/mL (interquartile range 0–0 ng/mL), K G was 1.1%/min (interquartile range 0.9–1.3%/min) and that to arginine post-STZ was 0 ng/mL (interquartile range 0–0 ng/mL), confirming the diabetic state.
Adverse events
Only 9% of animals manifested clinical symptoms requiring medical intervention. The most frequent aberrations observed were transient laboratory abnormalities. Risk factors affecting AEs included the following: STZ dose, age and obesity parameters (BW, BSA, mid-girth circumference, GHtR and RhOI). These risk factors were evaluated for their effect on distinct aberrations.
Moderate severity (score 2) nephrotoxicity was observed in 28% of cynomolgus macaques and 38% of rhesus macaques; it was reversible in 13% and 38% of cases, respectively (Tables 3 and 4, and Figures 3 and 4). Severe (score 3) nephrotoxicity was observed in 9% of cynomolgus macaques and 5% of rhesus macaques, and was reversible in 40% and 0% of cases, respectively (Tables 3 and 4, and Figures 3 and 4). Regarding risk factors, in cynomolgus macaques (Table 3), there was a highly significant association between BW (P < 0.001), BSA (P = 0.001) and obesity factors such as mid-girth circumference (P = 0.015). In rhesus macaques, none of the risk factors analyzed were associated with nephrotoxicity. One cynomolgus macaque sustained score 3 injury to the kidney upon enrollment in a subsequent transplant study within 21 days of STZ infusion in which the nephrotoxic immunosuppressant tacrolimus was administered in combination with immune co-stimulatory blockade. Although the animal remained clinically normal, increased laboratory abnormalities in creatinine and BUN required withdrawal of tacrolimus, after which values improved but did not recover to baseline. Two other animals with score 3 injury to the kidney were subjected to immunosuppressive protocols without nephrotoxic agents and had no indication of progressive injury.
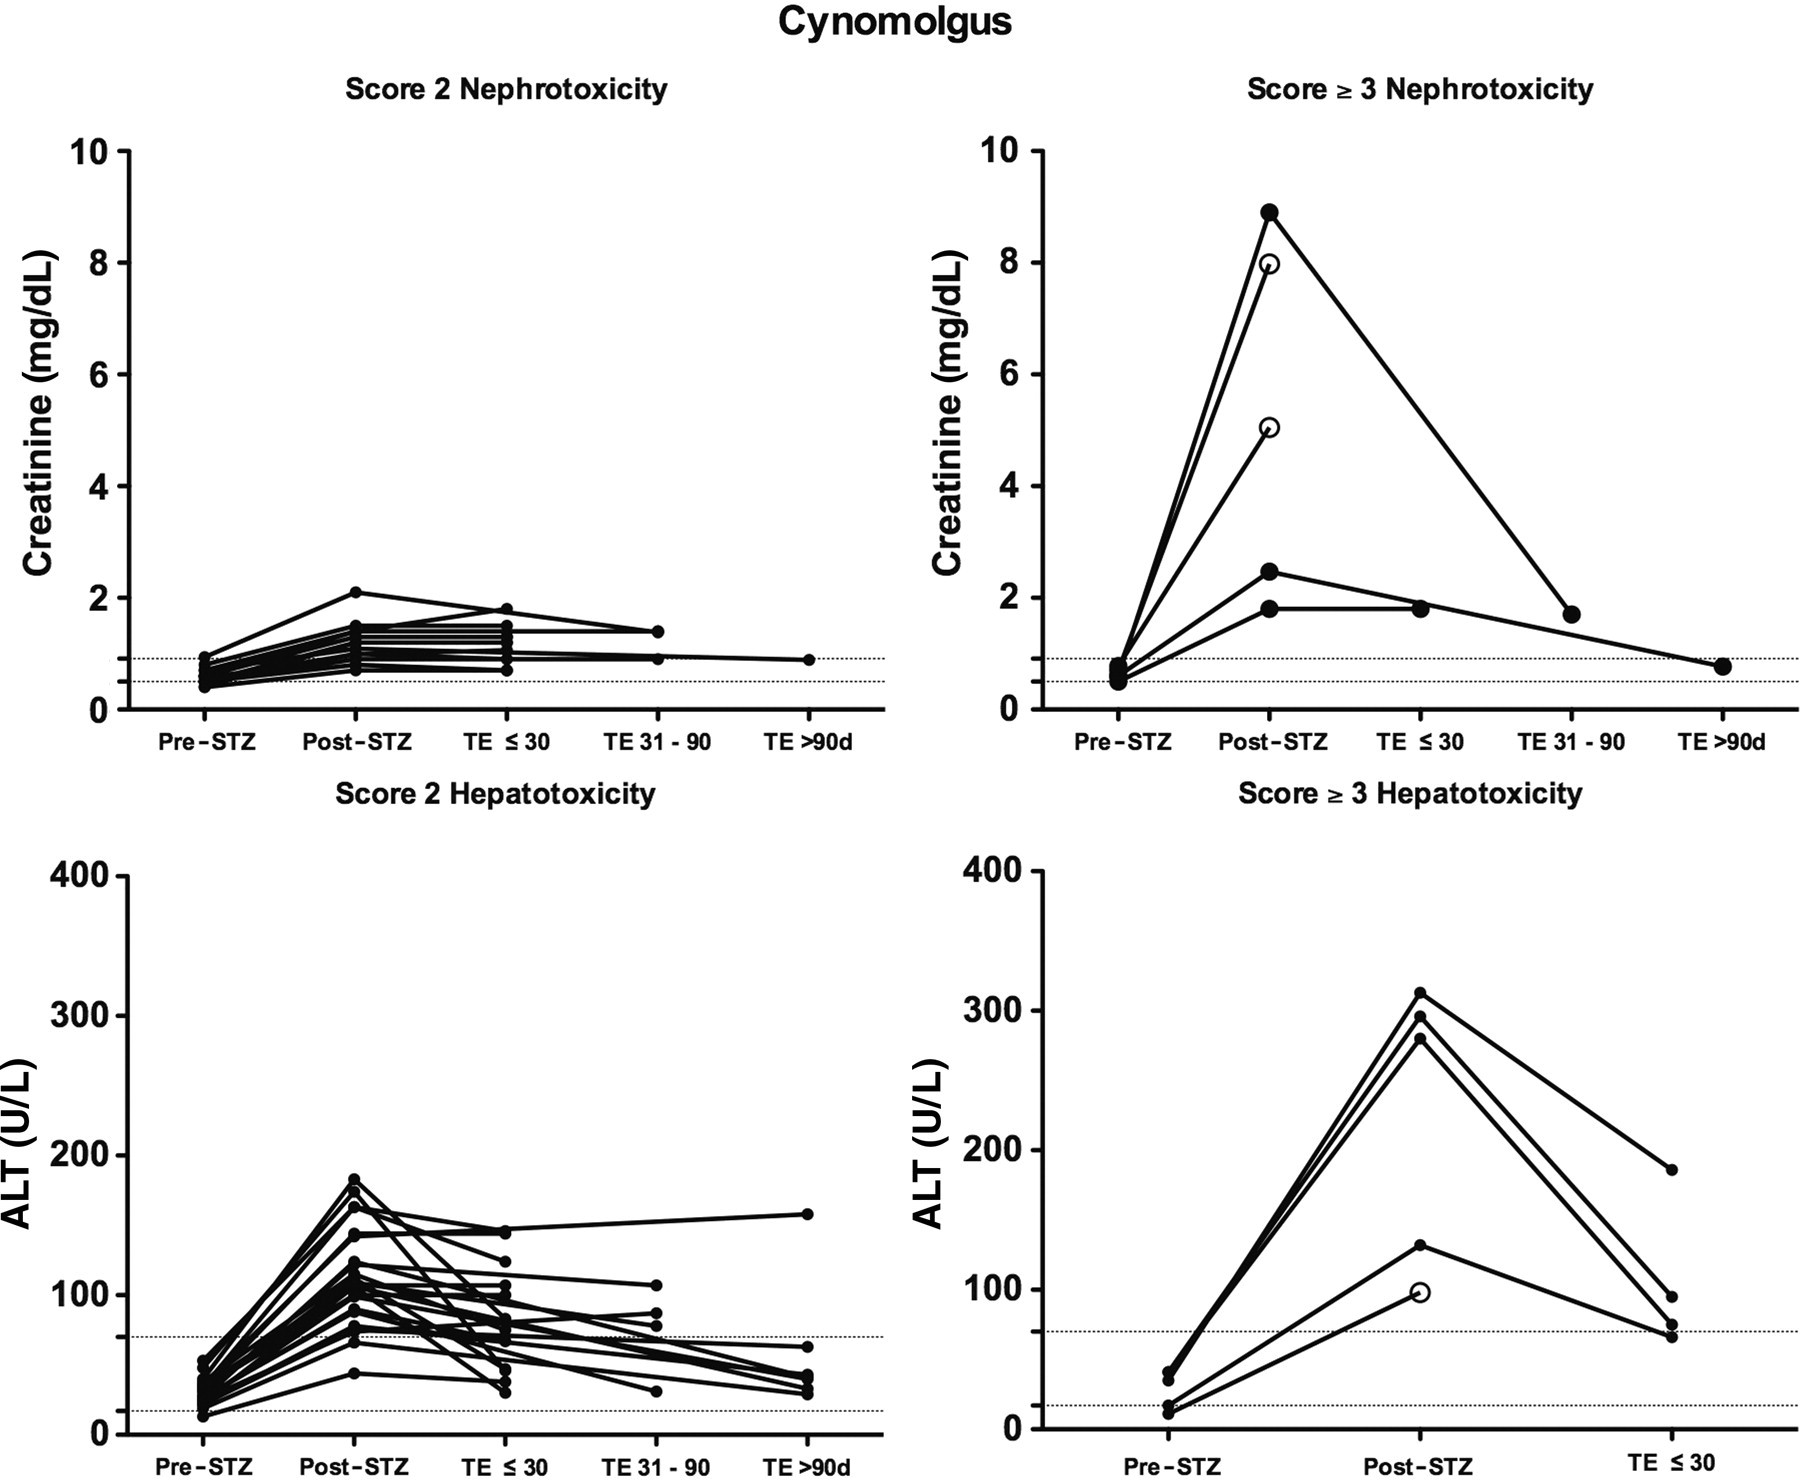
Top panel: course of creatinine values in cynomolgus macaques with a score 2 or 3 nephrotoxicity. Bottom panel: course of alanine aminotransferase (ALT) values in cynomolgus macaques with a score 2 or 3 hepatotoxicity. The course is presented from baseline till trial entry, expressed in relation to streptozotocin (STZ) administration, and categorized as less than 30 days, 30–60 days or more than 90 days post-STZ. Dashed lines represent the reference interval for the cohort. Open circle indicates euthanasia
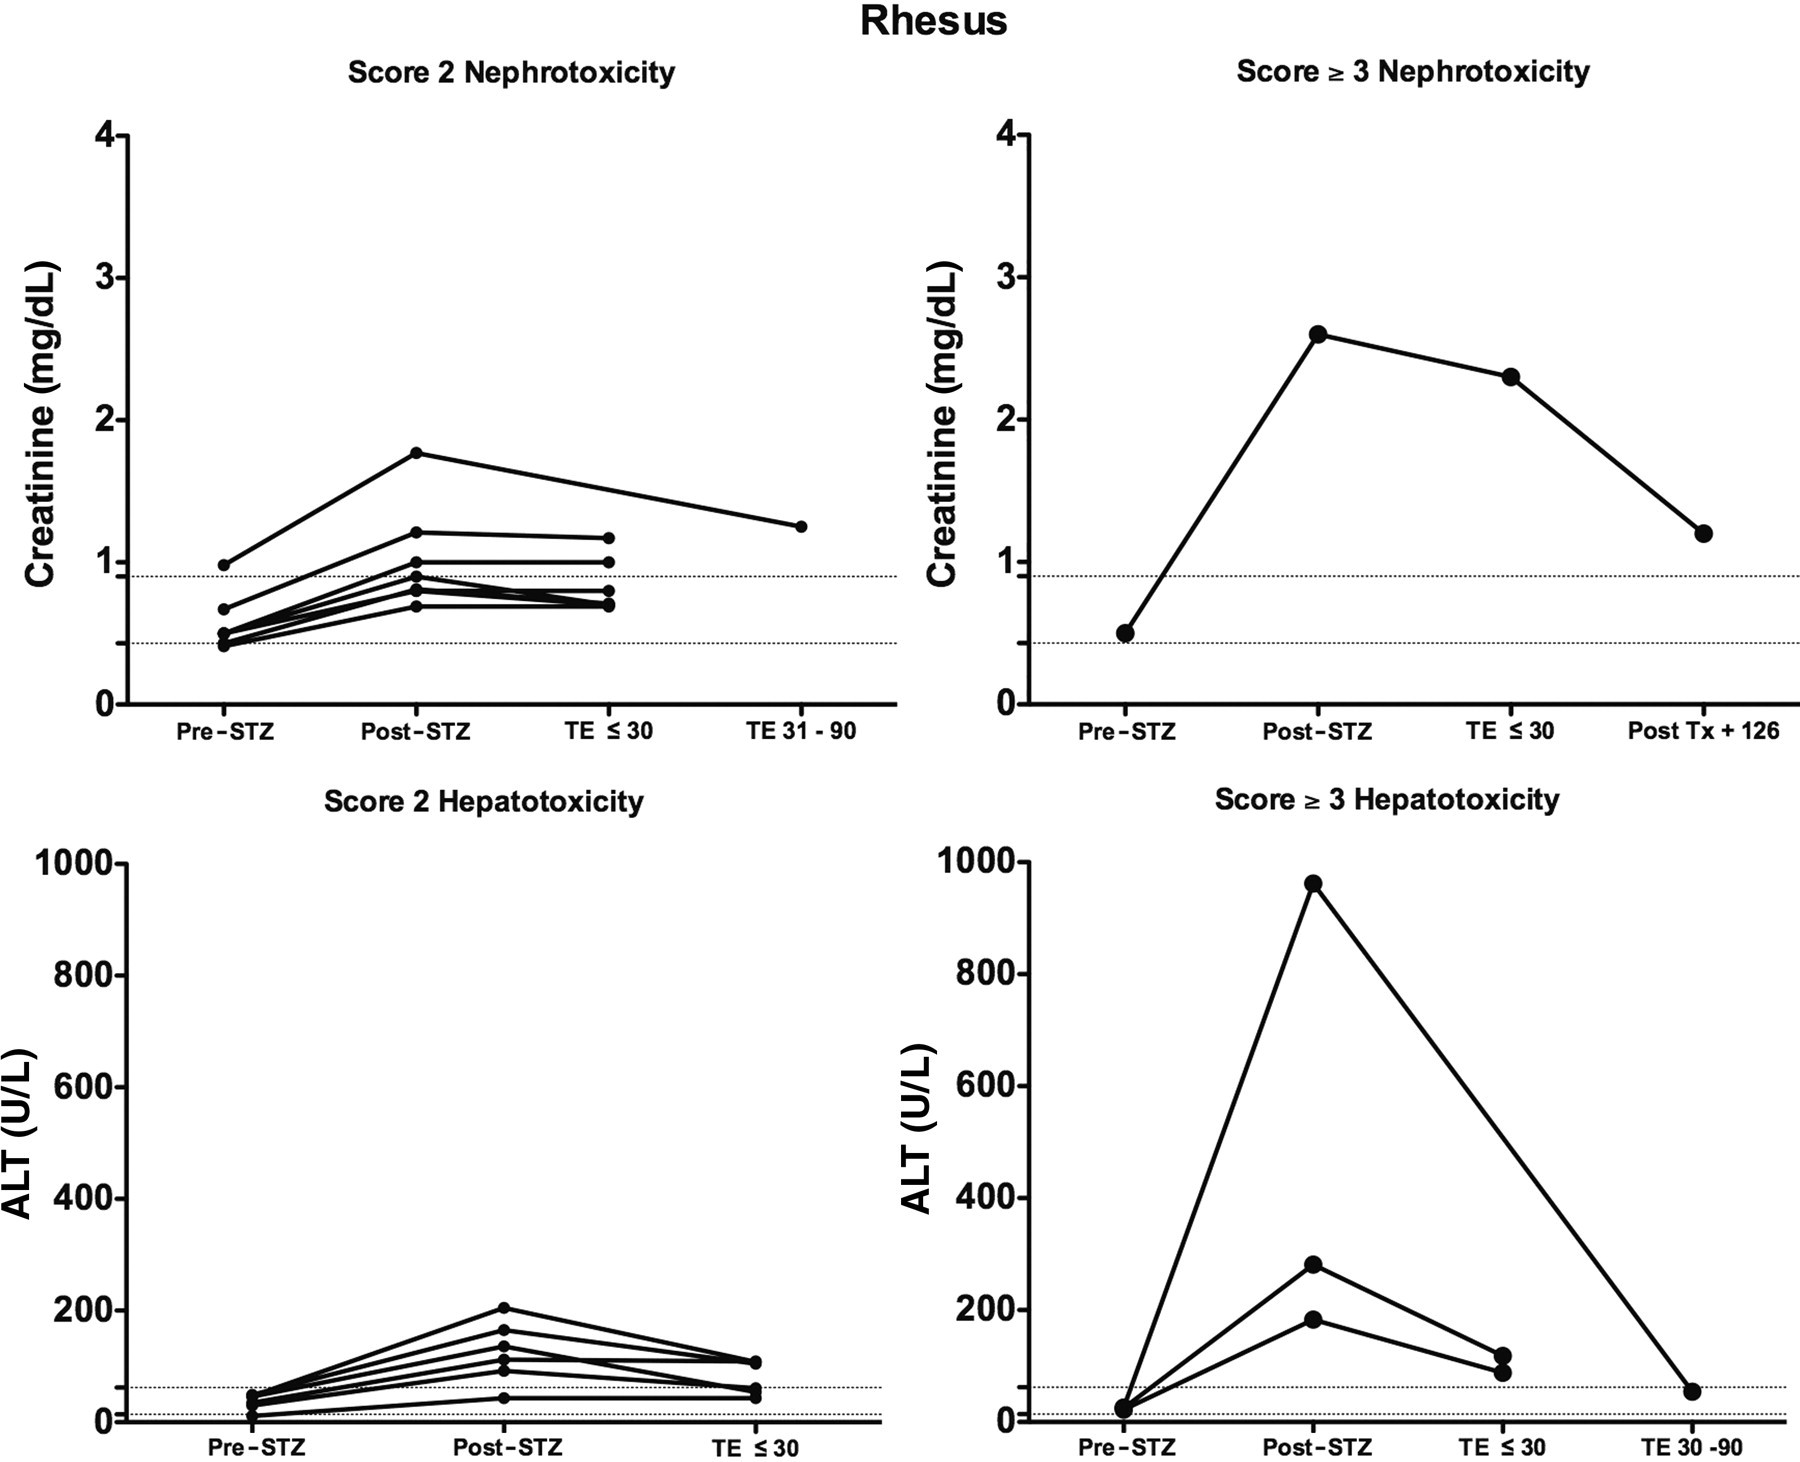
Top panel: course of creatinine values in rhesus macaques with a score 2 or 3 nephrotoxicity. Bottom panel: course of alanine aminotransferase (ALT) values in rhesus macaques with a score 2 or 3 hepatotoxicity. The course is presented from baseline till trial entry, expressed in relation to streptozotocin (STZ) administration, and categorized as less than 30 days, 30–60 days, or more than 90 days post-STZ. Dashed lines represent the reference interval for the cohort
Nephrotoxicity and hepatotoxicity after STZ treatment measured by laboratory parameters in cynomolgus macaques
BUN, blood urea nitrogen; ALT, alanine transaminase; ALP, alkaline phosphatase; RI, 95% reference interval; GHtR, girth-to-height ratio; RhOI, Rhesus Obesity Index; TE, trial entry
Data presented are arithmetic mean values ± SD
Reference interval (RI) is set at the 90% confidence range of the full cohort before STZ infusion
*Risk = 50–199% increase in creatinine
†Injury ≥ 200% increase in creatinine
‡Risk = 200–500% increase in ALT and/or ALP
¶Injury >500% increase in ALT and/or ALP
#Score 2 adverse effects (AEs): Moderate Severity – laboratory test alterations – indicates injury with transient risk
**Score ≥3 AEs: Serious Severity – laboratory test alterations – indicate a serious health threat or permanent injury. Peak values in the 30-day period post-STZ induction were graded and presented as % events occurring in the post-STZ induction period/and subsequently assessed at the trial enrollment timepoint (average 90 d post-STZ) to assess persistence
a P < 0.001 versus normal, b P < 0.001 versus risk, c P < 0.01 versus risk, d P < 0.05 versus normal, e P < 0.05 versus risk, NS, not significant
Nephrotoxicity and hepatotoxicity after STZ treatment measured by laboratory parameters in rhesus macaques
For explanations, see legend to Table 3
Moderate severity (score 2) hepatotoxicity was observed in 43% of cynomolgus macaques and 29% of rhesus macaques: it was reversible in 70% and 67%, of cases, respectively (Tables 3 and 4, and Figures 3 and 4). Severe (score 3) hepatotoxicity was observed in 9% of cynomolgus macaques and 14% of rhesus macaques, and was reversible in 80% and 100% of cases, respectively (Tables 3 and 4, and Figures 3 and 4). Regarding risk factors, in cynomolgus monkeys (Table 3), the association between the RhOI and moderate or greater injury to the liver was slightly significant (P = 0.047). None of the risk factors were associated with hepatotoxicity in rhesus macaques.
Clinical signs of AEs after STZ infusion are summarized in Table 5. There were seven animals that manifested clinical AEs after STZ infusion that necessitated euthanasia of three of these seven animals (Table 5). These animals included one cynomolgus macaque with grade 3 acute renal failure that progressed to uremia, one cynomolgus macaque with grade 4 renal failure in combination with severe metabolic acidosis and one rhesus macaque with grade 4 pulmonary edema. Clinical manifestation were reversible in four animals and included one cynomolgus macaque with grade 2 vomiting, two cynomolgus macaques with metabolic acidosis (in one case secondary to diabetic ketoacidosis [DKA]), and one rhesus macaque with pulmonary edema. All animals experiencing AEs manifesting clinical symptoms were treated according to presentation: intensive care was successful in four animals, while irreversible organ damage resulting from STZ toxicity necessitated euthanasia in three other animals.
Clinical adverse events after STZ infusion in cynomolgus and rhesus macaques
STZ, streptozotcin; GHtR, girth-to-height ratio; RhOI, Rhesus Obesity Index
Data are presented as arithmetic mean values ± SD
*Grade 2 AE: Moderate – clinical presentation – discomfort sufficient to modify normal daily activity; specific therapy required
†A co-occurring adverse event, secondary to either renal failure or pulmonary edema
‡Grade ≥3 AE: Serious – clinical presentation – incapacity, inability to perform normal daily activity; emergency treatment required; life-threatening events; death (necessitated euthanasia)
There were risk factors observed for clinical AEs (Table 5). Both in cynomolgus macaques and in rhesus macaques, there were statistically significant associations with obesity measures, with higher values for mid-girth circumference and GHtR in animals manifesting clinical AEs. Mid-girth circumference alone can be used as an indicator of obesity, but with the remark that a positive correlation between girth and height limits its unequivocal interpretation. Like for other measures of adiposity such as RhOI, there is a correction for height in the GHtR, and this provides a more unequivocal interpretation with respect to obesity. The RhOI was also higher in animals with AEs, but this did not reach statistical significance. Related to the interaction with obesity measures, there was a statistically significant relationship with age in cynomolgus monkeys and BW in rhesus monkeys.
Regarding STZ dose, the two rhesus macaques manifesting AEs had received a significantly higher STZ dose than 22 animals without AEs (P = 0.024, Table 5). This difference was not observed in cynomolgus macaques. This relationship between AEs and STZ dose expressed in mg/m2 was further evaluated with respect to animals categorized according to obesity. Except for the two rhesus macaques there was no clear trend between AEs and STZ dose observed.
This relationship between AEs, either clinical signs or laboratory abnormalities, and obesity measures could be investigated for 42 animals combining the cynomolgus and rhesus cohorts: Figure 5 presents a grouping according to RhOI and GHtR. This figure illustrates that more severe (clinically manifesting) AEs occur especially in animals exceeding the established thresholds. This figure also illustrates the significant association between the GHtR and clinical and/or laboratory AEs, and the absence of such a significant relationship for the RhOI. The data were translated into an incidence table (Table 6), categorizing animals according to the presence or absence of clinical AEs (≥Grade 2) or laboratory AEs (≥score 2) and the GHtR as the measure of obesity. This categorization allows the calculation of the sensitivity, specificity and predictive value of the GHtR for the occurrence of AEs after STZ infusion. This calculation resulted in a high value of the positive predictive value (92%) and specificity (94%), mainly because of the low number of false-positives: this means that animals with a high outcome in the GHtR are at risk for developing AEs after STZ. Since animals with a lower outcome in the GHtR showed AEs (i.e. the number of false-negatives is about the same as that of true-negatives and true-positives), the sensitivity (46%) and negative predictive value (52%) is relatively low.
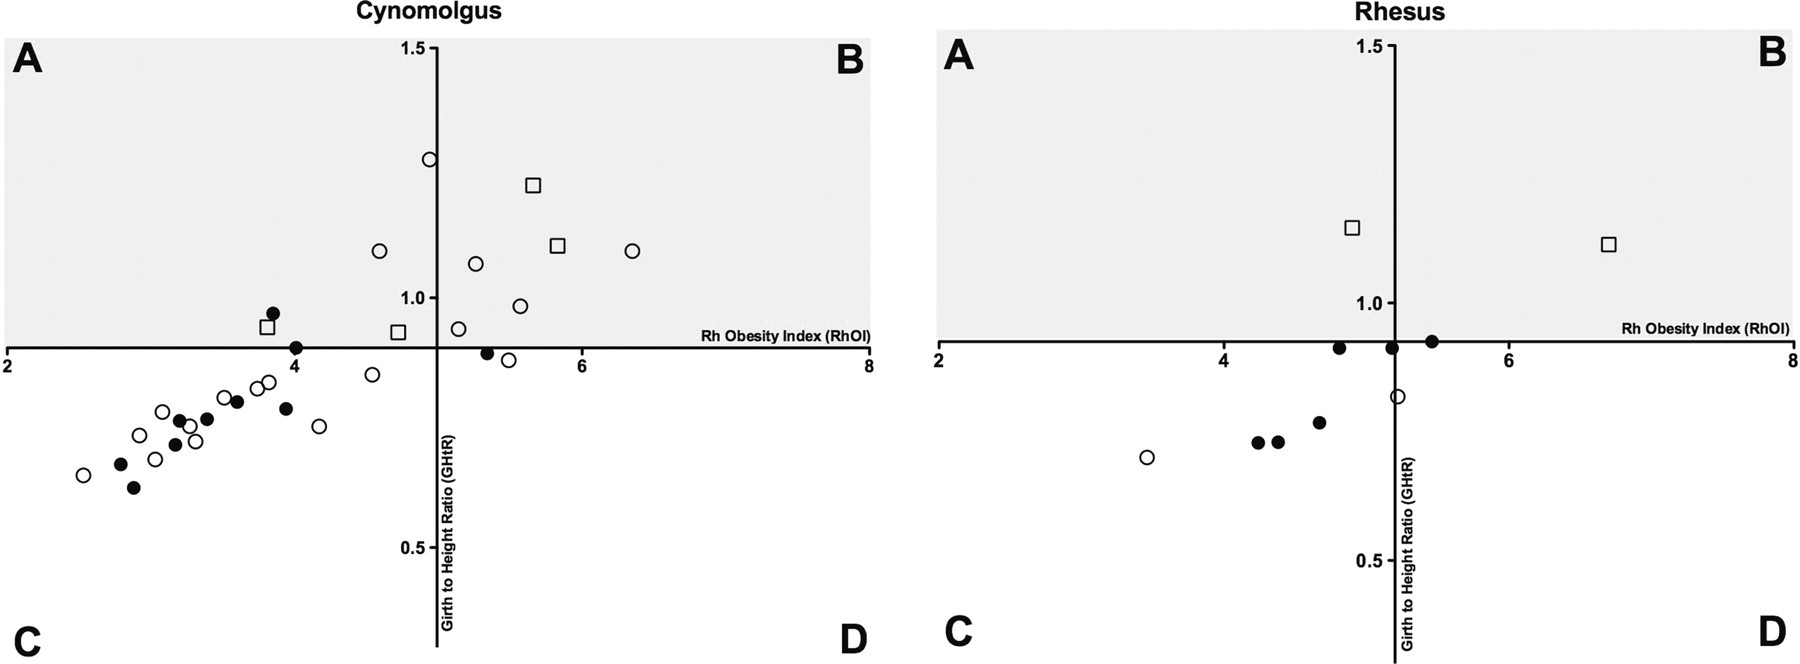
Relationship between girth-to-height ratio (GHtR) and Rhesus Obesity Index (RhOI) in the combined cohorts of cynomolgus and rhesus macaques, categorized by the presence of clinical and/or laboratory adverse events (AEs). The x-axis represents RhOI; the y-axis GHtR: the axes are positioned according to the threshold value (Q3, 75% percentile) for the cohort below which is considered normal. Animals in quadrants A and B were defined as obese, indicated by shading. Closed circles represent the absence of any clinical or laboratory AEs, open circles represent score ≥2 laboratory AEs and open squares represent grade ≥2 clinical AEs
Incidence of adverse events in obese animals
Animals in the cynomolgus and rhesus cohort experiencing clinical and/or laboratory adverse events after STZ infusion categorized according to obesity in girth-to-height ratio (n = 42)
Discussion
The use of pharmaceutical grade STZ (Zanosar®) provides an opportunity to refine and optimize the efficacy and safety of STZ-dosing protocols by limiting one aspect of variability in the outcome with respect to dose level. In many studies, chemical-grade STZ is used; however, chemical-grade compounds are not formulated to conform to pharmaceutical standards for purity, administration and bioavailability. Among others, the use of chemical-grade STZ introduces variability related to handling the compound (i.e. inaccuracies introduced by weighing powder, scale differences, different stock concentrations and dilutions, and degradation due to preparation timing). Together with interanimal variability that includes physiological factors (e.g. age, weight, condition), intrinsic factors (e.g. genetic differences) and environmental factors (e.g. hydration protocols, follow-up regimens), this contributes to wide differences between centres in outcome versus dose level, and hence the difficulty in achieving an optimum dosing that is broadly accepted. 24 We used a median dose of 100 mg/kg (range 80–108 mg/kg, 1086–1900 mg/m2) pharmaceutical-grade STZ which rendered all animals profoundly diabetic as characterized by persistent hyperglycemia in the absence of exogenous insulin and a failure to respond to metabolic challenge (Table 2 and Figure 2). Three animals had to be euthanized because of serious AEs precluding assessment of efficacy in producing a diabetic state. A relationship between the dose of STZ and diabetogenic response has been documented, 35 but this could not be unequivocally confirmed in the present study. Even after conversion from the flat-fixed dose to a BSA-based dose, the relationship between dose and outcome was weak in cynomolgus macaques (Figure 1) and absent in the rhesus macaques. This may be attributed to the relatively small STZ dose range as well as to the high dose used, and also to the severity of the diabetic state (Table 2).
We did not observe an independent correlation between BSA-based dose and toxicity or efficacy as it relates to the acceptable threshold for complete induction of diabetes. This is in contrast to our previous experience with chemical-grade STZ. 26 BSA-based dosing is only recommended in the case where it demonstrates a significant improvement over flat-fixed dosing considering that fewer errors are made in calculating, preparing and administering a proper individual dose with flat-fixed dosing. 36
BSA-based dosing could have value for animals in the upper or lower ends of the weight range. For animals that fall within accepted weight ranges for their age and weight (demonstrated by a normal progression along the x-axis representing RhOI in Figure 5), a dose of 100 mg/kg is recommended. For animals that are obese (demonstrated by increasing GHtR represented on the y-axis in Figure 5), a dose reduction of 20% is recommended. In this study there were no animals with a BW below 3 kg: in other studies it has been reported that young (low BW) monkeys do tolerate higher doses in diabetes induction. 8
Laboratory abnormalities manifesting AEs were confined to the kidney and the liver, and were in most cases mild and reversible. Out of 53 cynomolgus macaques, three animals developed score 3 nephrotoxicity that was not resolved at trial entry, and one animal developed score 3 hepatotoxicity that was not resolved at trial entry (Table 3). In the series of 21 rhesus macaques, these results were one for score 3 nephrotoxicity and 0 for score 3 hepatotoxicity (Table 4). There were no clear risk factors identified for nephrotoxicity in cynomolgus macaques, except for BW, BSA and mid-girth circumference (Table 3). The emergence of kidney and liver AEs is in accordance with the characteristics of STZ being a nitrosourea compound. The kidney accumulates STZ to high concentrations during excretion where proximal tubules are the primary site of damage, 37 which is reversible depending on the degree of damage. Metabolic acidosis can be secondary to renal tubular injury that prevents bicarbonate reabsorption, with normal to moderately decreased glomerular filtration rate and a normal anion gap. 38 With regard to hepatotoxicity, a primarily hepatocellular injury pattern (predominantly ALT elevation) appears in the acute phase after STZ administration, like in humans. 39 The degree of injury and the persistence of injury to the liver and kidney is less clear in macaques. The degree of injury is important as it relates to the animal's eligibility and suitability for transplant trials or other studies in which they encounter medications or test drugs that may contribute additional toxicity; such a confounding status has been reported by us before regarding the use of cyclosporine, 26 and is illustrated in the present study in one animal receiving tacrolimus. The relative persistence is important as it relates to the amount of time that should be allowed to elapse between diabetes induction and trial enrollment. In our studies, most animals remained in the acceptable ‘normal’ cohort reference ranges despite injury. In the case of score 3 nephrotoxicity that occurred in 6/78 animals (8%), care should be taken to give adequate time between induction and enrollment for recovery. In our experience, prompt recognition of renal failure and metabolic acidosis, in particular DKA and subsequent renal failure, is relevant so that adequate treatment can be instilled with the perspective of recovery.
We observed two cases of an acute pulmonary reaction, a known complication for chemotherapeutic agents in the nitrosourea class. This presumably results from the susceptibility of lung tissue with its high concentration of oxygen to formation of free radicals in response to chemotherapy. The first case responded to conventional loop diuretics and oxygen therapy, whereas the degree of severity in the second case in combination with limited response to treatment necessitated euthanasia. Impaired lung function is associated with obesity: both cases were obese which might have contributed to the presentation and severity of symptoms. In retrospect, it may be valuable in such cases to initiate corticosteroid treatment to decrease inflammation.
Besides laboratory abnormalities, clinical AEs emerged after STZ infusion (Table 5): in the combined groups of cynomolgus and rhesus macaques, seven out of 78 animals showed clinical AEs and three of these had to be sacrificed. Interestingly, obesity parameters were statistically significant risk factors for AEs: since obesity is observed in increasing prevalence at higher age, this association was also apparent for age. The combination of GHtR and RhOI enables four body types to be distinguished: (A) small to average height with abdominal obesity; (B) tall height with abdominal obesity; (C) small to average height and lean; and (D) tall height, lean, and muscular. Animals in categories A and B were defined as obese, and clinical and/or laboratory AEs occurred especially in these body types (Figure 5). We calculated a high positive predictive value and specificity (92% and 94%, respectively) for the development of AEs in animals of categories A and B (Table 6). It is well known that the altered pathophysiology of an obese body affects drug distribution and elimination, 40 but the influence of obesity on the pharmacokinetics of cytotoxic agents is poorly understood. It remains to be established whether obesity as a risk factor is related to peculiar pharmacokinetics, distribution and metabolism of STZ in obese individuals. 41 On the other hand, the negative predictive value and sensitivity was low (52% and 46%, respectively), mainly due to a high number of false-negatives, i.e., non-obese animals that manifested AEs. This indicates that there are other factors in non-obese animals that facilitate the emergence of AEs. Thus, AEs apparently are largely individually determined, which is also clear from the fact that there is no clear threshold in which all animals experience toxicity. One explanation might be searched for in polymorphisms of gene-encoding metabolizing enzymes involved in the elimination of cytotoxic agents, thereby affecting both the clearance and exposure of STZ. 42 In this respect it is worth mentioning the GLUT2 glucose transporter that serves in the uptake and subsequent destruction of beta cells by STZ. Besides beta cells, GLUT2 is expressed in the liver, renal proximal tubules and small intestine (basolateral membrane). 43 The expression of GLUT2 is highly variable between species. Old world macaques express GLUT2 at a higher intensity than new world macaques or humans, and also between individual macaques there can be differences in staining intensity of tissues expressing GLUT2. 44 It is tempting to speculate that quantification of GLUT2 expression at the individual level is useful for a risk assessment and thereby contributes to further reduce AEs associated with STZ induction while still maintaining an efficacious dose.
In general, toxicities were tolerable and manageable. The low incidence of mortality is attributed to careful attention to prevention, monitoring and treatment protocols designed to protect the recipient from the known toxicities of STZ (e.g. antiemetics, hydration, base deficit correction). 45 Intensive care protocols were largely successful except for sustained permanent renal injury or irreversible pulmonary edema. It is noted that individual animals may have unique responses to STZ. Juvenile animals (known to be more resistant to STZ-induced AEs than older animals) are generally given preference for islet transplantation studies but a wide experience with ages and weights has been studied. 5–13
In conclusion, we successfully induced diabetes in a large series of cynomolgus and rhesus macaques using high-dose (100 mg/kg) pharmaceutical grade STZ, and identified obesity as a relevant risk factor for AEs. It is recommended to preferentially select juvenile or adult animals with lower GHtR signaling less abdominal adiposity. In adult animals with a higher than normal GHtR, we recommend lowering the dose by as much as 20% to avoid AEs. Otherwise, it may be relevant to do a dose-finding study in these populations, realizing that there is a large degree of interanimal variability regarding the emergence of AEs. Finally, we demonstrated that high-dose STZ in combination with an appropriate recovery period, careful monitoring, and supportive medical intervention and care can avoid animal loss and confounding in NHP models of T1 diabetes.
Footnotes
ACKNOWLEDGEMENTS
The authors gratefully acknowledge the important contributions of Angela Craig for excellent veterinary care of the animals and Nicholas Robinson in the analysis of histopathological data. Our study was supported by the Schulze Family Foundation, the National Institutes of Health and the Juvenile Diabetes Research Foundation.