
Abstract
We hypothesized that diminished endothelial glycocalyx (GCX) at atherosclerotic lesion-prone sites accelerates flow-dependent concentration polarization of low-density lipoproteins (LDLs) at the luminal surface, and in turn contributes to vulnerability of these sites to atherosclerosis. A parallel plate flow chamber was applied to expose cultured endothelial monolayers to three different levels of shear stress (3, 12, 20 dyn/cm2). Heparinase III (Hep.III) was employed to degrade heparan sulfate proteoglycans selectively and 3-(N-morpholino) propanesulfonic acid-buffered physiological salt solutions (MOPS-PSS) were used at either normal ionic strength (Normal-MOPS), low ionic strength (LO-MOPS) or high ionic strength (HI-MOPS) to modify the effective charge density of the endothelial GCX. Water filtration velocity (V w ) across the endothelial monolayer, the luminal concentration of LDLs (C w ) and the uptake of LDLs by endothelial cells were measured and compared among the following five groups of cells: (1) Control; (2) Hep.III treatment; (3) LO-MOPS; (4) Normal-MOPS; and (5) HI-MOPS. The results obtained substantiated the aforementioned hypothesis and demonstrated that compositional or charge density modification of the endothelial GCX facilitated water filtration across the endothelium, enhanced the accumulation of LDLs on the luminal surface and increased the uptake of LDLs by endothelial cells, therefore contributing to atherogenesis.
Introduction
The glycocalyx (GCX) of the endothelial cells is a surface layer composed primarily of membrane-bound proteoglycans, with their associated glycosaminoglycan (GAG) that includes: heparan sulfate (HS), chondroitin sulfate (CS) and hyaluronic acid (HA), and glycoproteins bearing acidic oligosaccharides with terminal sialic acids (SA). 1 The physiological importance of endothelial GCX has been established over the past decade. The endothelial GCX shields the vascular wall from direct exposure to flowing blood, forms a permeability barrier for plasma fluid and macromolecules, limits the adhesion of leukocytes and platelets to the luminal surface and stimulates nitric oxide (NO) release by mechano-transduction. 2–4 Recently, van den Berg et al. 5 demonstrated, by using electron microscopy, that the morphology and dimension of the endothelial GCX was dramatically modified at atherosclerotic lesion-prone sites. Thereafter, in their extensive research using confocal microscopy, they revealed that the composition of the endothelial GCX, HS and HA, at the sinus region of the carotid artery, was significantly reduced when compared with the GCX at other regions. 6 Although their experiment has successfully supported their hypothesis that vascular sites with diminished GCX are more vulnerable to proinflammatory and atherosclerotic sequelae, little is known about the underlying mechanisms.
Clinical and postmortem studies indicate that atherosclerosis develops preferentially at certain vessel geometries such as arterial branching and curvatures, where blood flow may be disturbed and flow separation and re-circulation readily occur. 7 This suggests that hemodynamic factors may be involved in the localized genesis and development of atherosclerosis. Thus, a large number of studies 8–11 have been carried out, and shear stress, more specifically low wall shear stress (WSS), has been identified as the major factor which can alter the structure 10 and biological functions of endothelial cells, 11 and as a result affects the localization of atherosclerosis. Besides, it is certain that mass transport at the blood/vessel interface plays an equally pivotal role in the localization and progression of atherosclerosis. Histomorphometric examination of early atherosclerotic lesions has shown that an accumulation of cholesterol derived from plasma lipoproteins, most notably low-density lipoproteins (LDLs), within the arterial wall, is an early event in the process of atherogenesis. 12
Thus, a hypothesis called ‘concentration polarization’ has been proposed by Deng and co-workers. 13–15 The essence of the hypothesis can be described as follows: due to the semi-permeable nature of the vascular endothelium which allows water and small solutes but no macromolecules to pass through, a concentration polarization of macromolecules occurs at the blood/vessel interface. This results in the luminal concentration (C w ) of large molecules, e.g. LDLs, the principal cholesterol carrier in the blood, 16 to be much higher than their bulk concentration. Furthermore, numerical and experimental studies have demonstrated that the surface concentration of LDLs increases linearly with water filtration velocity (V w ) and is determined by two major factors: the transmural pressure (ΔP) and the hydraulic conductivity (Lp) of the vessel wall. 13,17–20
In the present study, we hypothesized that diminished GCX at lesion-prone sites accelerates the flow-dependent concentration polarization of LDLs at the luminal surface, and in turn contributes to vulnerability of these arterial sites to atherosclerosis. To test the hypothesis, we used cultured human endothelial cell monolayers on Millicell porous membranes as our model to investigate the correlation between GCX perturbation and atherogenic lipids transport. An in-house designed parallel plate flow chamber was applied to expose the endothelial monolayers to three different levels of shear stress (3, 12, 20 dyn/cm2). Heparinase III (Hep.III) from Flavobacterium heparanum was employed to degrade heparan sulfate proteoglycans (HSPG) selectively, and 3-(N-morpholino) propanesulfonic acid-buffered physiological salt solutions (MOPS-PSS) were used at either normal ionic strength (Normal-MOPS), low ionic strength (LO-MOPS) or high ionic strength (HI-MOPS) to modify the effective charge density of the endothelial GCX. The V w across the endothelial monolayer, the C w of LDLs and the uptake of LDLs by endothelial cells were measured and compared among the following five experimental groups: (1) Control; (2) Hep.III treatment; (3) LO-MOPS; (4) Normal-MOPS; and (5) HI-MOPS.
Material and methods
Chemicals
The following chemicals were obtained from Invitrogen (Camarillo, CA, USA): Collagenase II, RPMI 1640, fetal bovine serum (FBS) and penicillin–streptomycin. Trypsin, glutamine, DiI, paraformaldehyde, glutaraldehyde, bovine serum albumin (BSA) and Hep.III from F. heparanum were obtained from Sigma (St Louis, MO, USA). Vascular endothelial growth factor (VEGF) was purchased from Peprotech (Rocky Hill, NJ, USA). Type I rat-tail collagen was obtained from Millipore (Bedford, MA, USA). Heparan sulfate primary antibody (HepSS-1) was obtained from US Biological (Swampscott, MA, USA). Alexa Fluor 488-labeled secondary antibody (goat anti-mouse IgM) was obtained from Molecular Probes (Eugene, OR, USA).
Cell culture
Endothelial cells were obtained from human umbilical cord veins provided by Haidian Maternal & Child Health Hospital (Beijing, China) following a modified method from Jaffe. 21 The protocol was approved by the Institutional Committee for the Protection of Human Subjects. Briefly, the cord was isolated from the placenta soon after birth, put into sterilized phosphate buffer solution (PBS) and stored at 4°C for use. After inspection for integrity, the cord was cannulated and injected with a digestion solution (2.5 mg/mL trypsin and 1 mg/mL collagenase II) at 37°C for 10 min. The cellular digestion was collected and centrifuged at 800 rpm for 10 min. After rinsing twice, cells were resuspended and maintained at RPMI 1640 medium supplemented with 20% (volume/volume) FBS, 100 U/mL penicillin, 100 μg/mL streptomycin, 10 ng/mL VEGF and 2 mmol/L glutamine at 37°C in 5% CO2. Cells were identified as human umbilical vein endothelial cells (HUVECs) by staining positively for von Willebrand factor and negatively for α-smooth muscle actin. We used cells between passages 3 and 10.
Monolayer preparation
A Millicell-CM culture insert (PICM 03050; Millipore) with 0.4 μm diameter pores was used to create the endothelial cell monolayer model. Before seeding, the porous membrane was coated with type I collagen under sterile conditions, following the manufacturer's instructions, to enhance the adhesion of cells. A suspension of HUVECs containing 3 × 10⁶ cells in 400 μL medium was added on the luminal side of the membrane and incubated at 37°C in 5% CO2 for 6 h. Then the culture insert was turned back to its normal direction and cultured in a six-well plate for another two days. After we confirmed by phase contrast microscopy that the entire surface was covered with endothelial cells, the monolayer was used.
Labeling LDLs with DiI
LDLs were labeled with DiI under a modified procedure firstly described by Pitas et al. 22 Briefly, a stock solution of DiI (3 mg/mL in dimethyl sulfoxide) was added to the LDL solution to yield a final ratio of 150 μg DiI to 1 mg LDL protein. After gently vortex-mixing, the solution was incubated in the dark for 18 h at 37°C, the DiI-labeled LDLs (DiI-LDLs) were isolated by ultracentrifugation (49,000 rpm, 20 h, 4°C, Himac CP100MX, P70AT rotor; Hitachi, Tokyo, Japan), dialyzed against NaCl containing 0.01% EDTA and filtered (0.45 μm) before use. DiI-LDLs used for each experiment were freshly prepared and stored at 4°C for no more than one week; therefore, the level of oxidation of the LDLs was very low. The protein concentration of DiI-LDLs was determined by Bradford's method (using assay kits from Beyotime, Jiangsu, China). Standard solutions of DiI-LDLs were diluted in 0.4% triton X-100 with a concentration range of 0–10 μg/mL. Fluorescence measurements were performed using a spectrofluorometer (Cary Eclipse, Varian, UT, USA) with excitation and emission wavelengths set at 549 and 564 nm, respectively, and the final standard curve is shown in Figure 1.
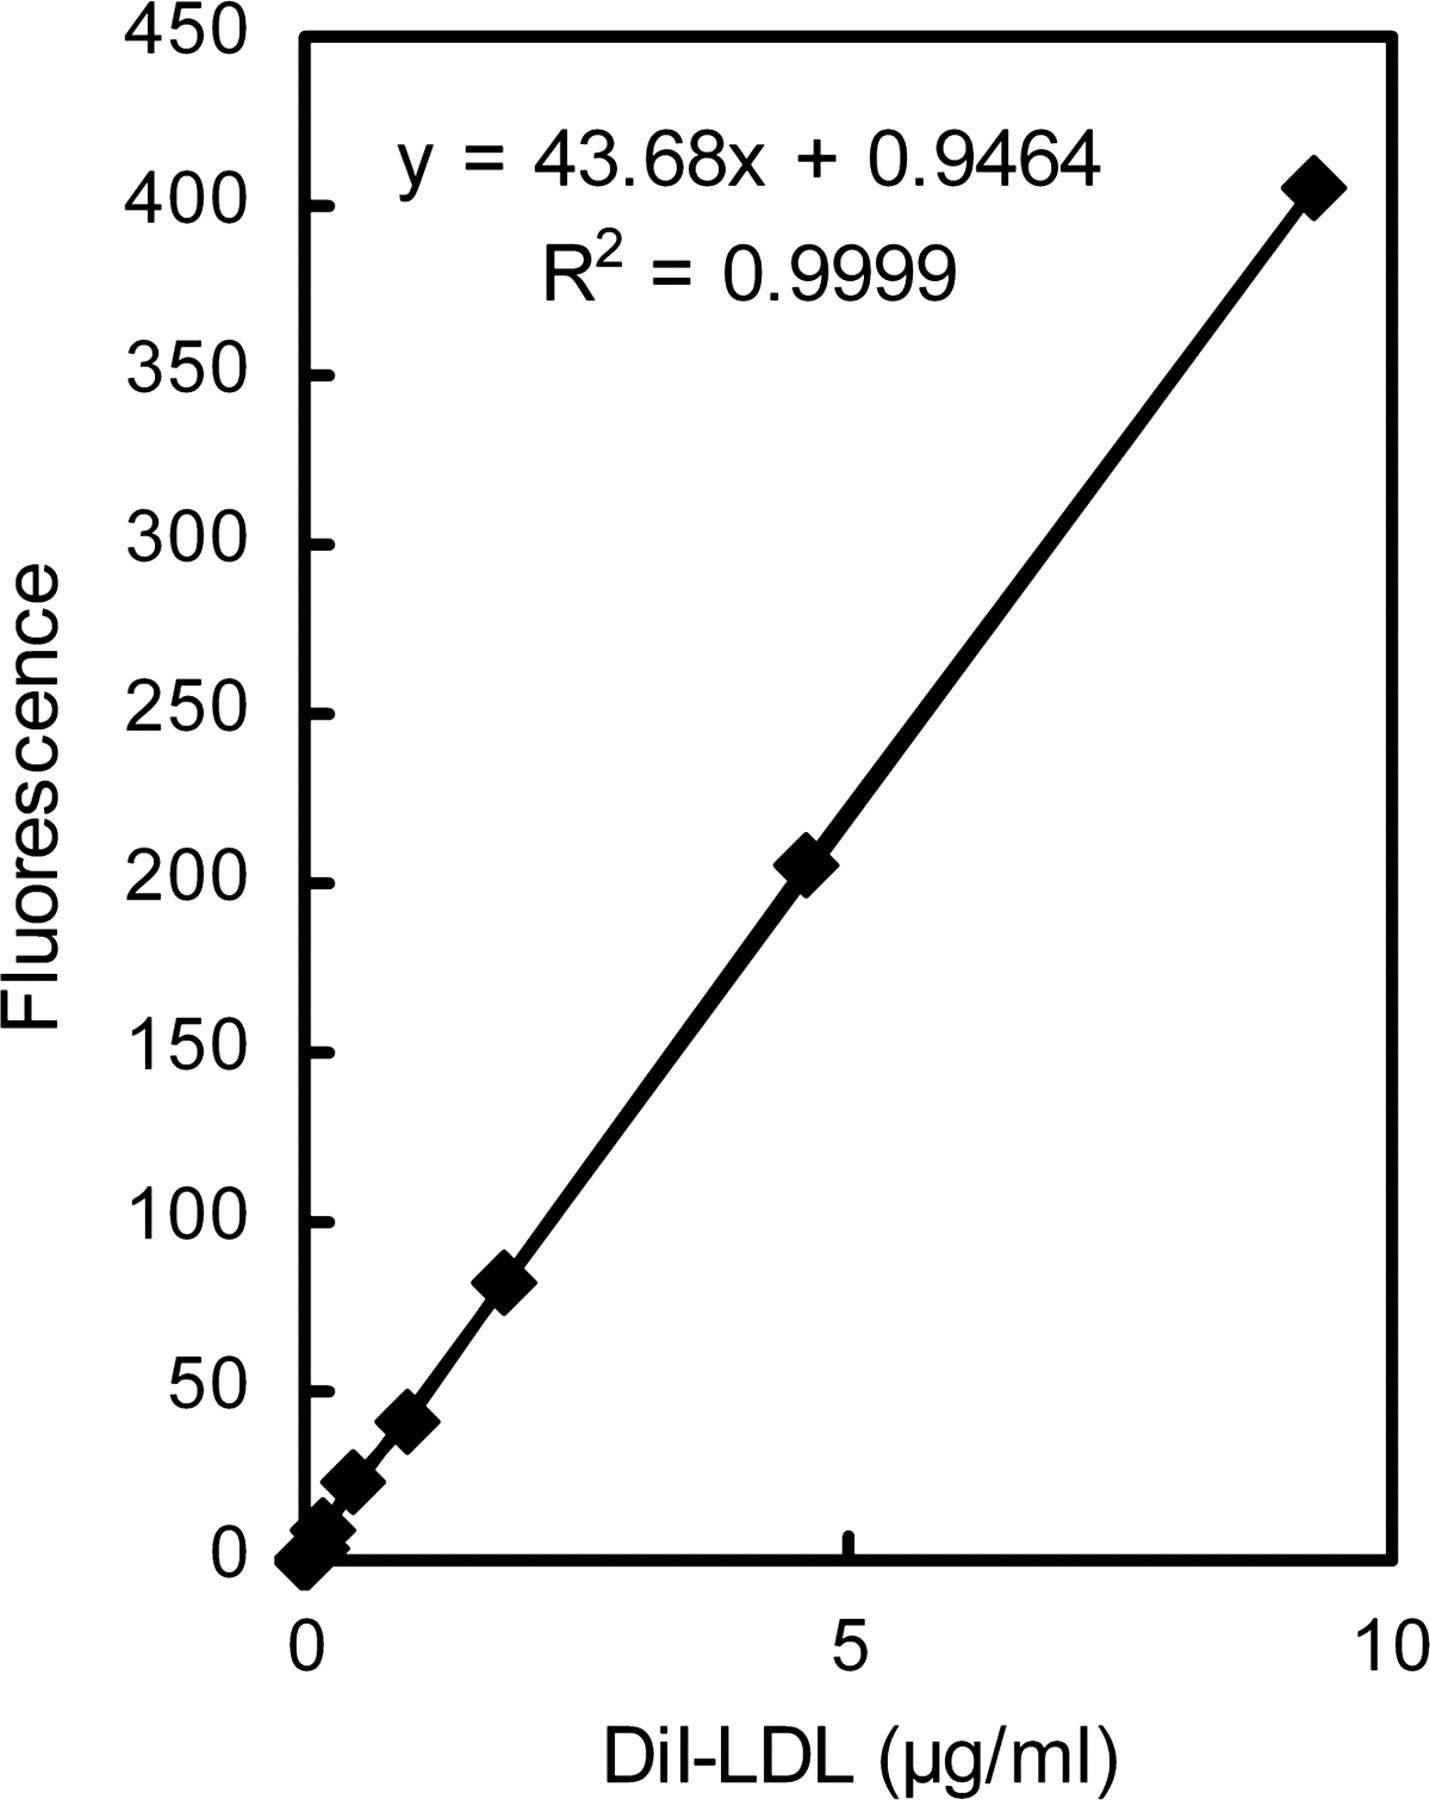
Standard calibration curve of DiI-labeled LDLs used in the experiment
Experimental set-up
Figure 2 is the schematic drawing of the flow system used in the present study. A parallel plate flow chamber developed in our own laboratory was used to expose Millicell culture inserts with HUVEC monolayers to laminar fluid shear stress. Briefly, the flow chamber was made by sandwiching a silicone gasket between two Plexiglas plates. Fluid flow was provided by a peristaltic pump (Longer pump, Hebei, China) and two reservoirs, situated one above another. The perfusion pressure was conditioned by adjusting the height of the upper reservoir. Shear stress was determined by the following equation: τ = 6μQ/Wh 2, where τ is the shear stress (dyn/cm2), μ is the viscosity of the medium (0.0084 poise), Q is the flow rate across the flow chamber and was controlled by a flowmeter (mL/s), h is the channel height (254 μm for standard gasket) and W is the channel width (3.5 cm for our chamber). A graduated pipette set at the top of the abluminal side of the culture insert was applied to measure the V w . During the flow experiments, the flow system (Figure 2) was kept at 37°C by putting the main reservoir in a temperature-controlled water bath.
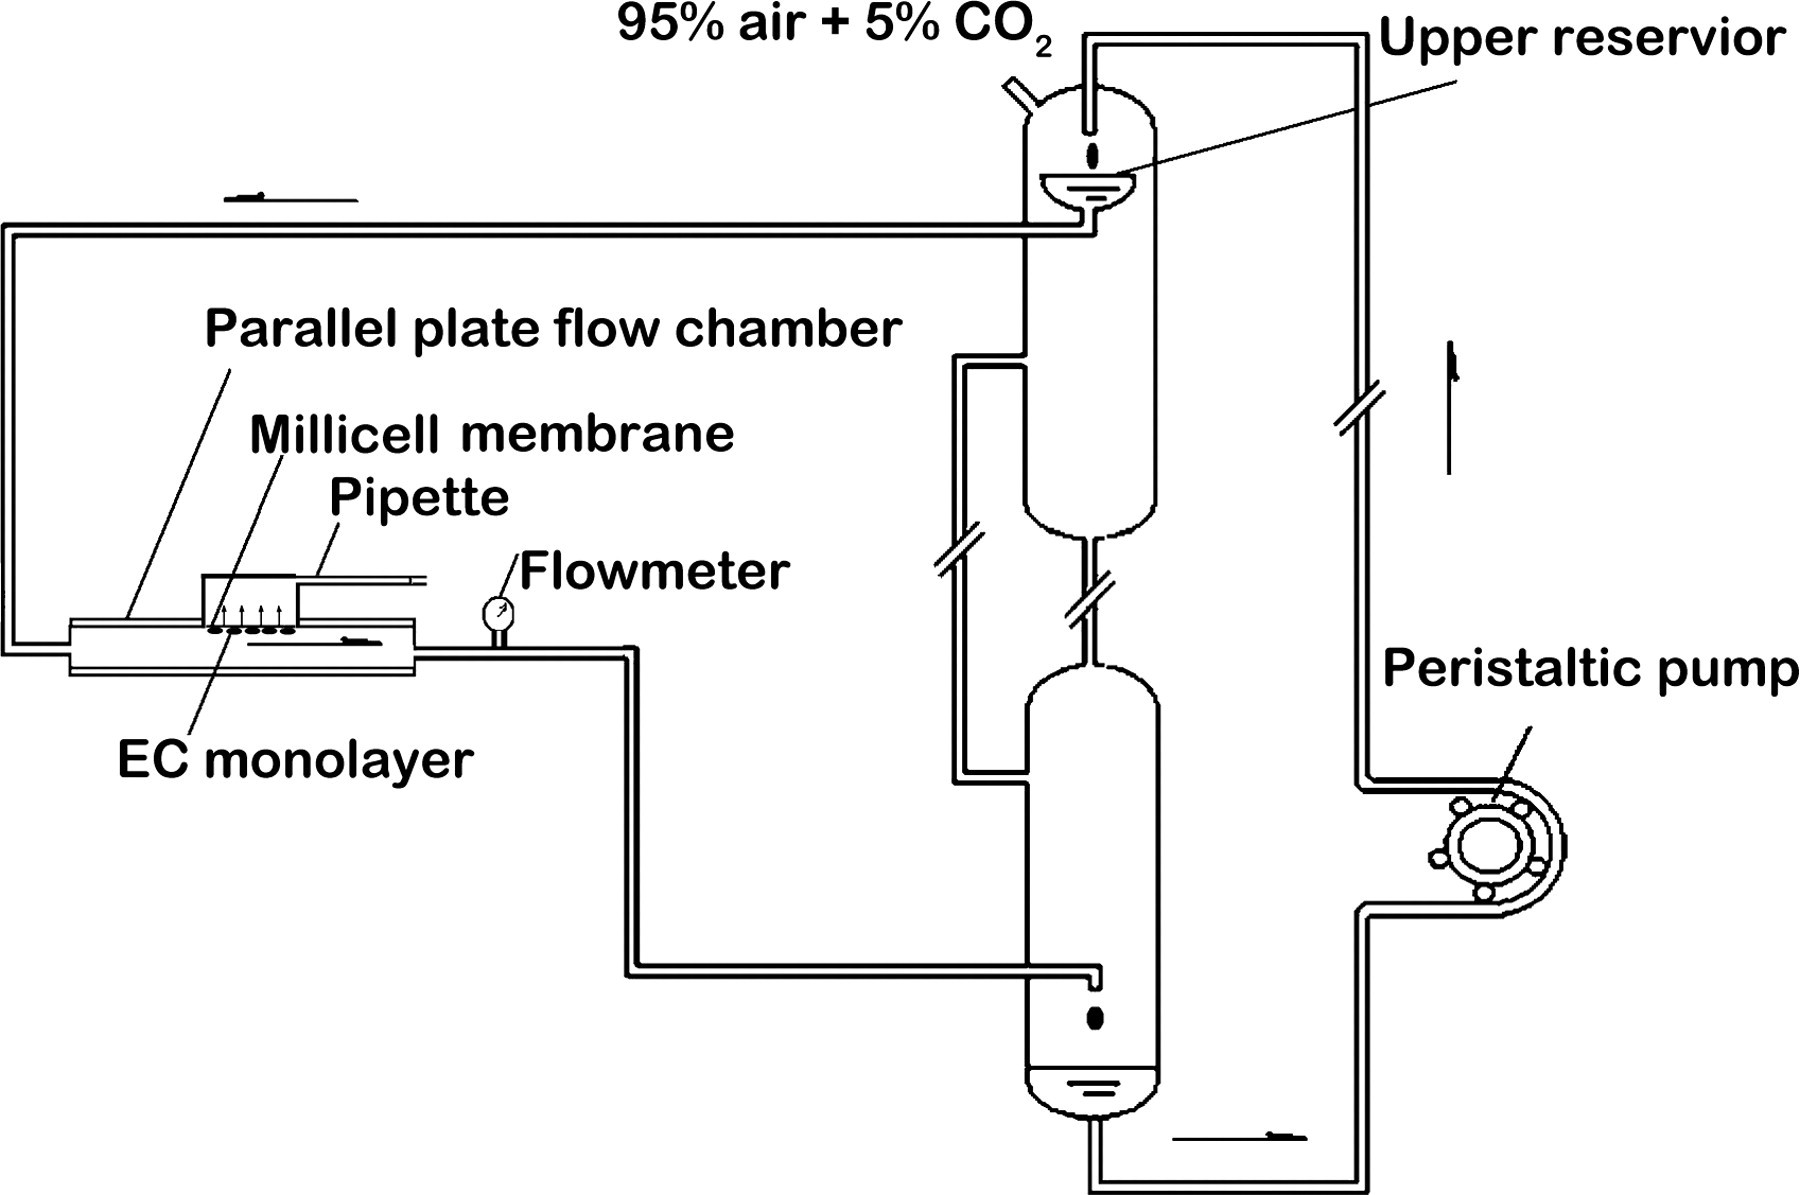
Schematic drawing of the experimental set-up. The upper reservoir provides a steady flow to the parallel plate flow chamber. EC, endothelial cell
Hep.III treatment and verification of the efficiency
Hep.III was used to cleave HS on the HUVEC surface. The enzyme was used at a concentration of 15 mU/mL in 1640 as described else where. 4 Briefly, the confluent monolayers on porous membranes were treated with this enzyme for 2 h in a six-well plate inside a 95% air and 5% CO2, 37°C incubator. Before mounting on the flow chamber, the monolayers were washed with fresh PBS twice. To verify the degrade efficiency of this enzyme, immunofluorescence antibody images for both untreated and pretreated cells were used following a modified staining procedure described by Florian et al. 4 Briefly, the confluence monolayer was washed twice with ice-cold PBS. Then cells were fixed with 4% paraformaldehyde and 0.5% glutaraldehyde for 20 min at 4°C and blocked with 5% BSA in PBS overnight. After being washed twice with ice-cold PBS, a solution of 5 μL HepSS-1 was diluted to 1 mL using PBS and applied to the monolayer for 15 min. To gain the fluorescence image, 5 μL Alexa Fluor 488-labeled secondary antibody was diluted to 1 mL with PBS and applied to the monolayer for another 15-min period. After washing with PBS for three times with 5-min interval, cells were observed under a fluorescence microscope (Olympus Optical, Tokyo, Japan) equipped with a charge-coupled device camera (TK-C1381; JVC, Tokyo, Japan). The overall fluorescence intensity was calculated for a series of image fields, using Image J (National Institutes of Health, Bethesda, MD, USA). Comparison of the fluorescence intensity of the untreated and treated image fields provided an estimate of the degree of HS removal associated with the heparinase treatment.
Effective charge density modification
MOPS-PSS of normal ionic strength (162 mmol/L), low ionic strength (81 mmol/L) and high ionic strength (323 mmol/L) mixed with 0.5% BSA were employed to modulate the charge density of the GCX (normal, high, low, respectively). 23 The osmolarity of MOPS-PSS, LO-MOPS and HI-MOPS was kept constant at 297 mosmol/L. Briefly, the culture insert coating with HUVECs was immersed in MOPS-PSS and incubated at 37°C in 5% CO2 for one hour. Before mounting on the flow chamber, the culture insert was washed three times in ice-cold PBS.
Measurement of V w
V w across the HUVEC monolayer was measured following a protocol described elsewhere. 13,24 In brief, after checking the integrity and confluence of the monolayer, the culture insert with HUVEC was installed at the bottom of the flow chamber and subjected to shear levels of 3, 12 and 20 dyn/cm2. RPMI 1640 supplemented with 20% FBS was used as the perfusate for the untreated and Hep.III treatment groups, while normal MOPS-PSS, LO-MOPS and HI-MOPS supplemented with 20% FBS were employed to perfuse the other three groups respectively. The luminal pressure was elevated to 100 mmHg by adjusting the height of the upper reservoir. The V w was evaluated every 5 min during the first hour and can be calculated as follows: V w = V/(t × S), where V is the water rising volume in a graduated pipette (mL), t is the filtration time (s) and S is the effective surface area of the membrane (cm2).
Measurement of luminal surface concentration of LDLs
The luminal surface concentration (C w ) of LDLs was assessed by measuring the fluorescence intensity of DiI-LDLs with a confocal microscope (×20 objective lens) (Leica TCS SPE; Leica Microsystems, Wetzlar, Germany). In this experimental set, RPMI 1640 supplemented with 5% FBS and 10 μg/mL DiI-LDLs was applied as the perfusate for untreated and Hep.III treatment groups, while normal MOPS-PSS, LO-MOPS and HI-MOPS supplemented with 0.5% BSA and 10 μg/mL DiI-LDLs were used to perfuse the other three groups, respectively. After a two-hour perfusion, images of the membrane surface were taken by a using rhodamine filter for DiI-LDLs. The overall fluorescence intensity was quantified by using Image J (National Institutes of Health) for a series of image fields.
Measurement of LDL uptake by endothelial cells
The amount of LDLs taken up by endothelial cells was evaluated by a procedure from Sakai et al. 25 Briefly, after the two-hour perfusion as aforementioned, the culture insert with HUVEC monolayer was removed and rinsed with PBS for three times. Cells were lysed with 1.5 mL of 0.4% triton X-100 in the dark for 10 min and detached from the membrane by a cell scraper. After pipetting several times, the supernatant was collected by centrifugation (1000 rpm, 15 min). The fluorescence of the supernatant was measured with a spectrofluorometer (Cary Eclipse) with excitation and emission wavelengths set at 549 and 564 nm, respectively. The final amount of DiI-LDLs taken up by endothelial cells was determined as a ratio of the respective value measured in the original perfusate.
Statistical analysis
Statistical analyses were performed by repeated-measures analysis of variance and paired t-test. Results are presented as means ± SE. Differences between means were considered significant if P < 0.05.
Results
Verification of HSPG removal efficiency
Figure 3 shows a representative immunostaining. As shown in Figure 3c, Hep.III pretreatment caused a 37.54 ± 2.2% (P < 0.05, n = 3) reduction in fluorescence intensity relative to the untreated controls.

(a) Representative immunostaining of HSPG on the control HUVECs. (b) HSPG on the Hep.III treatment HUVECs. The pictures are at the same magnification. (c) Hep.III treatment (15 mU/mL for 2 h) degraded the cell surface HSPG by 37.54 ± 2.2% (P < 0.05, n = 3). HUVEC, human umbilical vein endothelial cell; HPSG, heparan sulfate proteoglycans. (A color version of this figure is available in the online journal)
Effect of HSPG degradation or GCX charge density modification on V w across HUVEC monolayers
We exposed the untreated and the Hep.III treatment charge density modification HUVECs to flow shear stresses with different levels (3, 12 and 20 dyn/cm2) and evaluated V w every 5 min during one hour of each shear level. As evident from Figure 4, the V w increased with shear levels for both the untreated and the Hep.III or charge density modified cells. GCX perturbation (HSPG degradation or GCX charge density modification) enhanced V w significantly at all levels of shear stress (n = 12, P < 0.05). More specifically, V w varied with the extent of GCX charge density modification, that is, V w was the lowest for LO-MOPS, the medium for MOPS and the highest for HI-MOPS (Figure 4b).
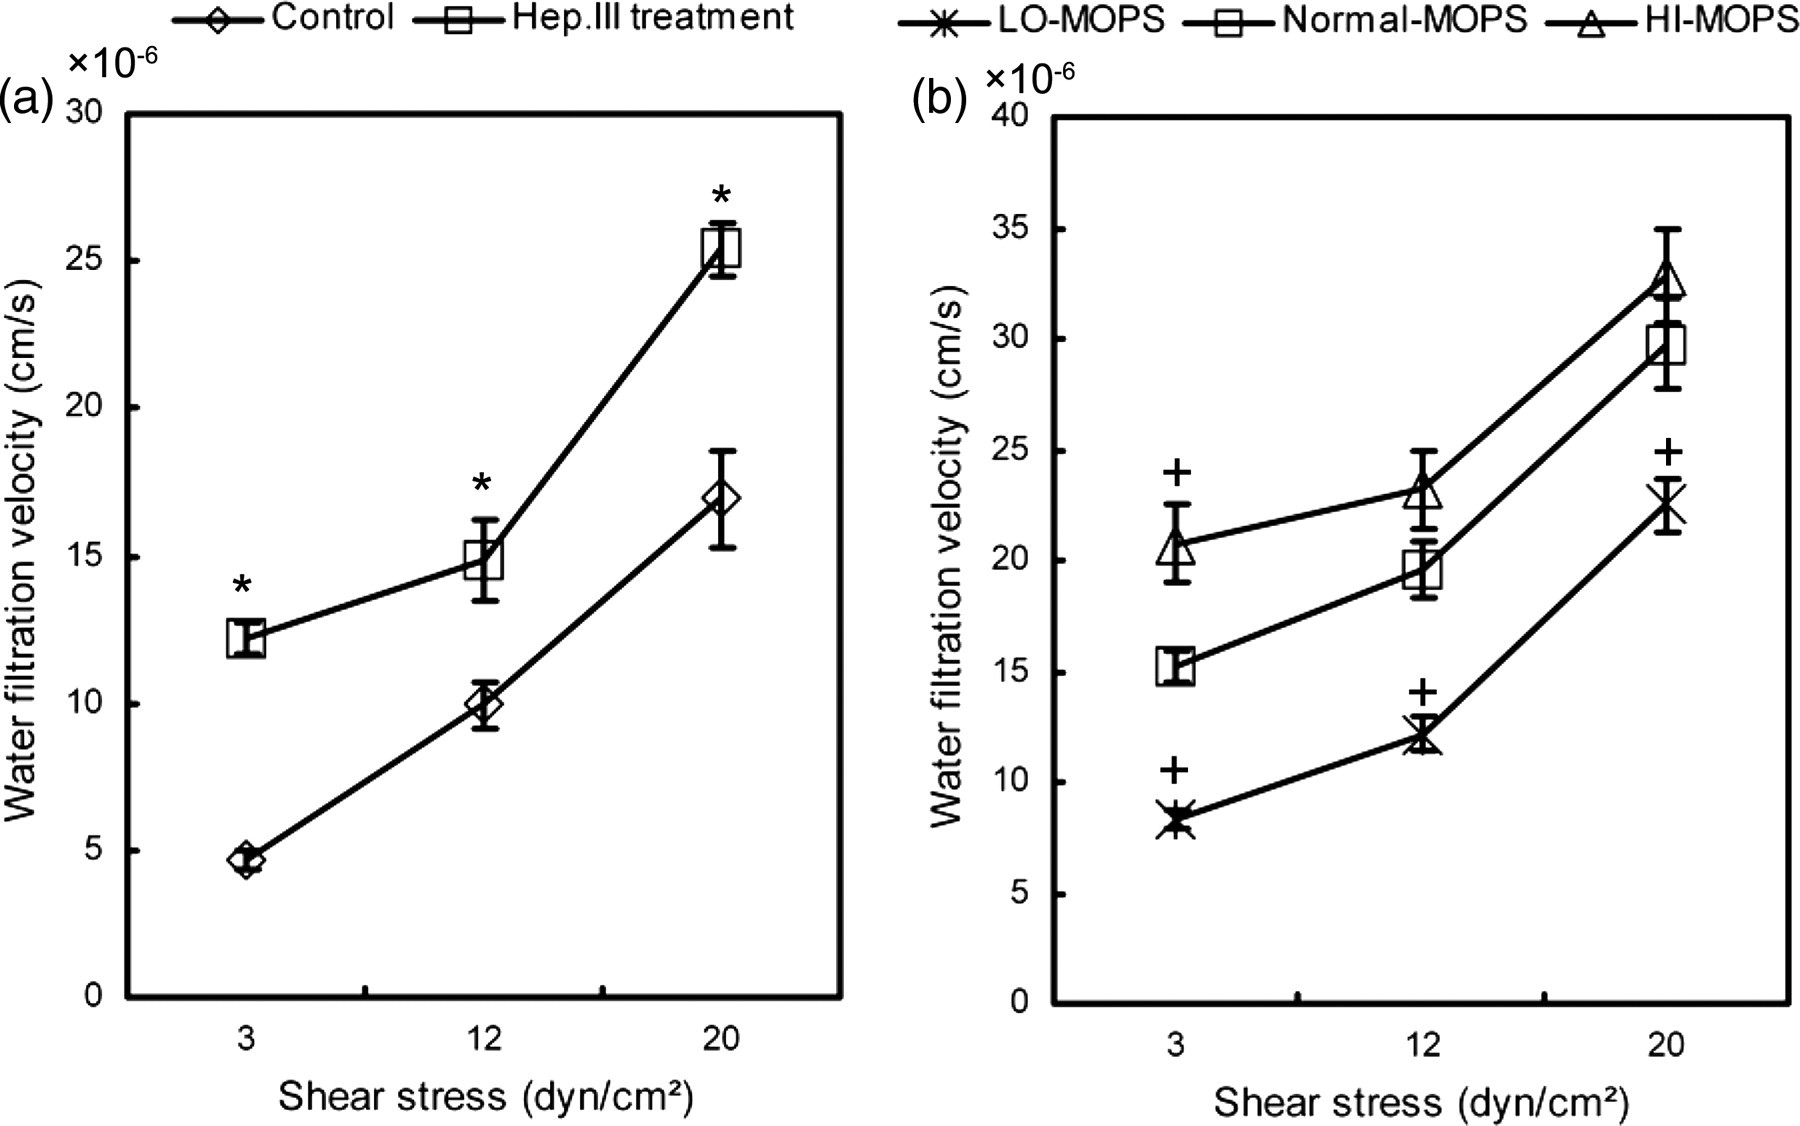
(a) V w of both the control and the Hep.III treatment HUVECs, showing that V w increased after HSPG degradation. *Statistical significant difference relative to the untreated control group (P < 0.05, n = 12). (b) V w of LO-MOPS, Normal-MOPS and HI-MOPS experiments, showing that V w increased with shear levels and GCX charge density modification extent. + Statistical significant difference relative to the Normal-MOPS group (P < 0.05, n = 12). V w , water filtration velocity; HUVEC, human umbilical vein endothelial cell; GCX, glycocalyx
Effect of HSPG degradation or GCX charge density modification on C w
In this set of experiment, both the untreated and the pretreated HUVECs (Hep.III or MOPS with low, normal and high ionic strength treatment) were subjected to a shear stress of 20 dyn/cm2 for two hours when 10 μg/mL DiI-LDLs was added to the perfusion media. Images before the experiment demonstrated that HUVECs showed a typically polygonal morphology and covered the porous membrane delicately (Figure 5a), while after the two-hour perfusion, DiI-LDLs accumulated on the luminal surface of the HUVEC monolayer and the cell outline became unclear (Figure 5b). The surface fluorescence intensity, reflecting the C w of DiI-LDLs, was quantified and normalized to the untreated group (Figure 5c). As shown in Figure 5c, GCX disruption (HSPG degradation or GCX charge density modification) accelerated atherogenic LDL accumulation at the HUVEC/flow interface, while the charge density modified groups showed higher LDL accumulation than the Hep.III treatment group (Hep.III treatment: 1.87 ± 0.16; LO-MOPS: 4.21 ± 0.17; Normal-MOPS: 5.79 ± 0.14; HI-MOPS: 6.37 ± 0.20).
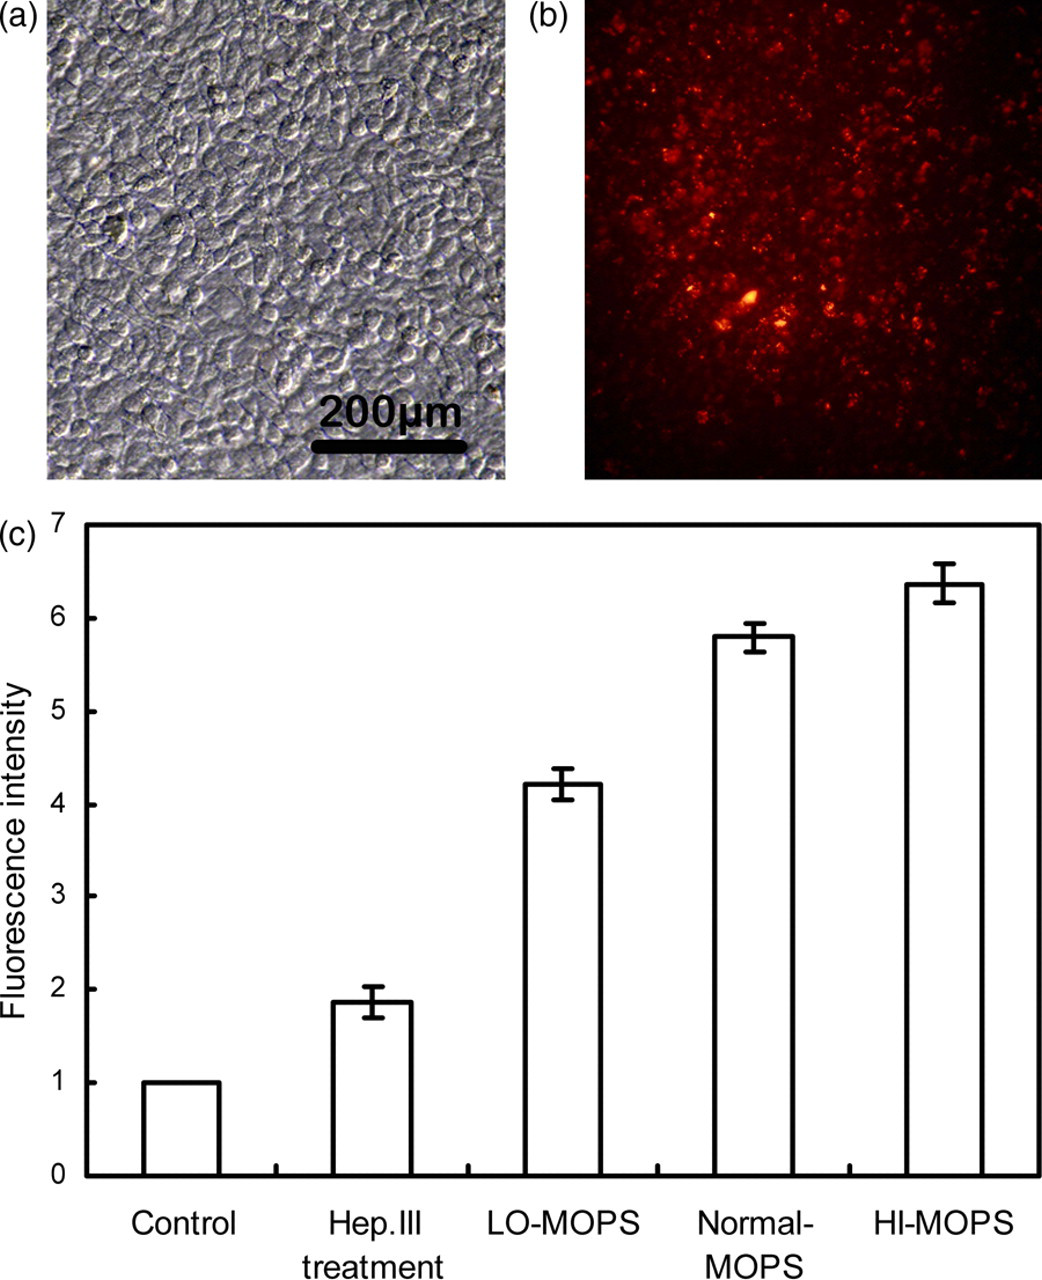
(a) Typical polygonal morphology of HUVEC monolayers cultured on a porous membrane. (b) DiI-LDL accumulation at the luminal/flow interface of the untreated cells. (c) Quantification of the fluorescence intensity of DiI-LDLs on the HUVEC surface, indicating that deposition of LDLs at the luminal/flow interface increased after HSPG degradation or GCX charge density modification. Data were normalized to the control group (n = 3). HUVEC, human umbilical vein endothelial cell; GCX, glycocalyx; LDL, low-density lipoprotein. (A color version of this figure is available in the online journal)
Effect of HSPG degradation or GCX charge density modification on DiI-LDL uptake by HUVEC monolayers
After a 2-h flow exposure, we lysed the HUVEC monolayer and detached cells from the culture insert. The supernatant containing DiI-LDLs released from HUVECs was collected and measured. As shown in Figure 6, the amount of DiI-LDLs taken up by HUVECs increased with shear levels for all experimental groups except for the HI-MOPS group; specifically, the increment became significant when the shear level increased to 20 dyn/cm2 (P < 0.05, n = 3). HSPG degradation (Figure 6a) or GCX charge density modification (Figure 6b) facilitated LDL uptake by HUVEC monolayers (relative to the untreated control group). In addition, it was noticed that the amount of DiI-LDL uptake by HUVECs became smaller little by little when the ionic strength of MOPS-PSS increased (Figure 6b).
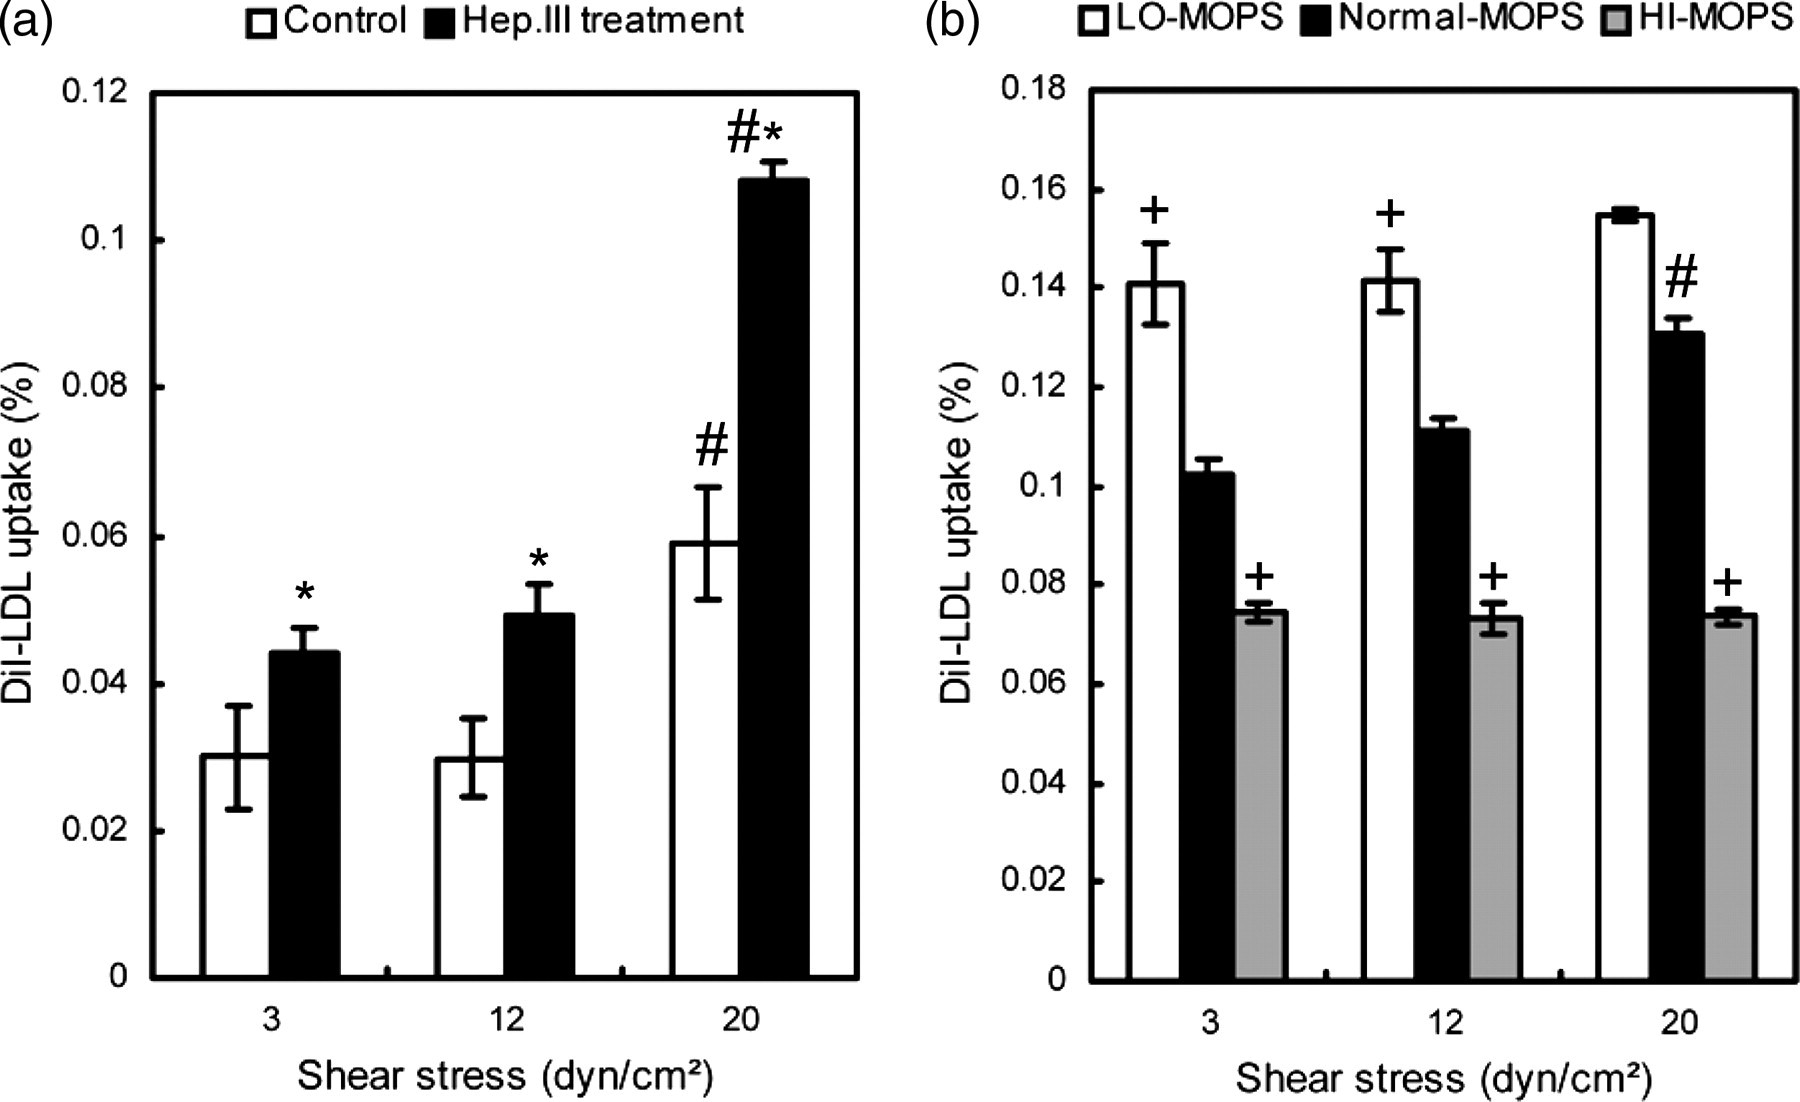
(a) Hep.III treatment facilitated the LDL uptake by HUVEC monolayers. *Statistical significant difference relative to the untreated control group (P < 0.05, n = 3). (b) The amount of DiI-LDL uptake by HUVECs decreased with the extent of GCX charge density modification. +Statistical significant difference relative to the Normal-MOPS group (P < 0.05, n = 3). #Statistical significant difference relative to the low shear level of 3 dyn/cm2 within each group. Data were presented as a ratio of the respective value to that of the original perfusate. HUVEC, human umbilical vein endothelial cell; GCX, glycocalyx; LDL, low-density lipoprotein
Discussion
Previous experiments have demonstrated that heparinase, an enzyme specific for cell surface HS, has the ability to alter the thickness 26,27 and the barrier property 28 of the GCX. It has been revealed by Florian et al. 4 that a concentration of 15 mU/mL of Hep.III can cause a 45% reduction in HS of bovine aortic endothelial cells (BAECs) but a negligible degradation of CS and undetectable protease activity. Haldenby et al. demonstrated that heparinase treatments could reduce fluorescence intensity by 27% to 51% using fluorescence-labeled wheat germ agglutinin in vitro. 29 The concentration and the duration for heparinase treatment to HUVECs in the present study were based on the report by Florian et al. The treatment led to a 37.54 ± 2.2% (P < 0.05, n = 3) reduction in fluorescence intensity, which was different from the results obtained by Florian et al. The discrepancy between their results and ours may be interpreted as follows: for one thing, the cell type used by them was BAECs, whereas ours was HUVECs. The differences in species and cell type cannot be neglected. Moreover, in the current study, the cells were fixed before staining and kept overnight on PBS and BSA, unlike in the study by Florian et al. The GCX is structurally composed of proteoglycans, GAGs, glycoproteins, glycolipids and adsorbed plasma proteins. The differences in technique between the studies could have an important effect on the GCX. Now that the reduction of fluorescence intensity was proportional to the degradation of HSPG on the cell surface, we could verify the effectiveness of our Hep.III treatment for HUVECs.
The phenomenon we observed in the present study that V w increased with shear stress has been discovered by Tarbell and co-workers 20 and Karino and co-workers 24 for many years. Nevertheless, explanations offered by the two groups for the underlying mechanisms are completely different. Tarbell and co-workers ascribed this phenomenon to a molecular mechanism through signal transduction, related to cyclic adenosine monophosphate and NO, 30 not just a purely physical mechanism such as deformation of fluid-conducting channels. In their latest study, they claimed that the endothelial GCX was the mechanotranduction element that mediates shear-induced Lp increases. 31 On the other hand, Karino and co-workers claimed that the shear-induced increase in V w was a result of concentration polarization of lipoproteins at the luminal surface of endothelial cells by observing that pure 1640 medium or 1640 supplemented with BSA did not trigger this phenomenon (shear-induced V w increases). 24 Our results that GCX perturbation by Hep.III treatment or MOPS-charge density modification did not inhibit shear-induced V w increases seems somewhat contradictory with the phenomenon observed by Tarbell et al. However, in order to totally exclude GCX-mediated changes in water fluid velocity, the entire GCX needs to be removed. In addition, we also found that after Hep.III treatment or MOPS-charge density modification, V w , was enhanced significantly at all shear levels (3, 12, 20 dyn/cm2) relative to the control group (n = 12, P < 0.05). This phenomenon is not difficult to be understood and could be interpreted as follows. It has been demonstrated that, the endothelial GCX integrated with some soluble molecules, either plasma or endothelium derived, 32 which are pivotal in preserving the (charge-) selectivity of the permeability barrier, is a highly delicate layer and the removal of any special component may result in the loss of function of the total. 33 In line with this, our compositional or charge density modification in this study has disturbed the integrity of the endothelial GCX, causing some relevant functions lost. That is, the perturbation of the endothelial GCX may result in reductions in water filtration resistance, which in turn increases V w across the HUVEC monolayers.
Deng et al. 13 has demonstrated by numerical and experimental studies that the surface concentration of LDLs increases linearly with filtration velocity. In the present study, we revealed that GCX perturbation accelerated the accumulation of LDLs at the HUVECs/flow interface, which was proportional to the GCX perturbation-induced V w increases. This is consistent with the study by Deng et al.
In the present experiment, we have observed that the amount of DiI-LDL uptake by HUVECs increased with shear stresses, which is in agreement with the results reported by Davies et al. 11 and Sprague et al. 34 It has been established that LDLs are taken up and internalized through two parallel compartmented routes: (i) a receptor-mediated process (adsorptive endocytosis) that involves coated pits/vesicles and endosomes, and (ii) a receptor-independent process (fluid endocytosis) carried out by a fraction of plasmalemmal vesicles. 35 Shear-induced uptake increases may be attributed to the activation of pinocytosis and receptor-mediated internalization as shown by Davies et al. 11 and Sprague et al. 34
Our result that GCX perturbation facilitated LDL uptake by HUVEC monolayers has further substantiated our hypothesis that diminished GCX at atherosclerotic lesion-prone sites accelerates the accumulation of LDLs on the luminal surface, observed in the present C w measurement. The bulk concentration of DiI-LDLs in our experiment was set at 10 μg/mL, which was high enough to saturate the specific high-affinity LDL receptors. 36 Under this condition, the uptake of DiI-LDLs by the HUVECs was mainly through a fluid-phase pathway and the latter has been verified to be positively correlated with the C w of LDLs. 35 It has been well established that under physiological conditions, endothelial cells play dual roles: first, take up plasma LDLs for its own membrane synthesis (a relatively small amount); and second, transport LDLs to the arterial wall or other cells in the surrounding tissue (a relatively large amount). Two different pathways for LDL transport across the endothelium have been proposed: (1) transcytosis 37 and (2) by porous pathways 38 between or through the endothelial cells provided by cell division 39 or death. 40 The former (transcytosis) has been revealed to be remarkably augmented by increasing LDL concentration, 10 that is, more and more LDLs will be transported across the endothelium with increasing LDL concentration by transcytosis and accumulated within the arterial intima, being a fundamental event of atherosclerosis.
Our result that the amount of DiI-LDL take up by HUVECs decreased with the augmentation of MOPS ionic strength was far beyond our expectation, since in the measurement of V w and C w , we found that both V w and C w increased with the augment of MOPS ionic strength, which was contradictory to results for DiI-LDL take up measurement. We speculate that this might be related to an inhibition effect of a too high LDL luminal surface concentration on LDL receptors. 41 To clarify this, more studies are required to elucidate the detailed mechanism.
Conclusions
In conclusion, compositional or charge density modification of the endothelial GCX will facilitate water filtration across the endothelium, enhance the accumulation of LDLs on the luminal surface and increase the amount of LDL uptake by endothelial cells. In one word, endothelial GCX perturbation in certain arterial sites accelerates flow-dependent concentration polarization of LDLs, which in turn, contributes to vulnerability of these arterial sites to atherosclerosis.
Footnotes
ACKNOWLEDGEMENTS
This work is supported by Grants-in-Aid from the National Natural Science Foundation of China (No. 11072023, 10632010) and the Innovation Foundation of BUAA for PhD Graduates.