
Abstract
This study investigated the effects of cadmium on bone microstructure and serum tartrate-resistant acid phosphatase 5b (Tracp 5b) in male rats. Sprague-Dawley male rats were divided into three groups that were given CdCl2 by subcutaneous injection at doses of 0, 0.1 and 0.5 mg/kg body weight (bw) for 12 weeks, respectively. Before killing at the 12th week, microcomputed tomography scanning was performed on the proximal tibia, and urine samples were collected from all of the rats. All rats were then killed, and their blood was collected for biomarkers assay. Bone tissues were dissected for mineral density determinations and histology. The concentration of cadmium in the blood, urine and bone of rats treated with cadmium were significantly higher than in the control group. The bone mineral density, bone mineral concentrations and bone microstructure index of rats treated with cadmium at 0.5 mg/kg bw were clearly lower than in the control rats. Histological investigation also revealed damage to the bone microstructure caused by cadmium. Tracp 5b concentrations in rats treated with cadmium were dose dependently higher than the control. The concentration of cadmium in blood, urine and bone was significantly correlated with Tracp 5b and bone microstructure parameters. Cadmium was shown to induce bone microstructure damage, especially to trabecular bone. The elevated concentrations of serum Tracp 5b suggest that bone resorption mediated via osteoclasts is an important mechanism for the toxic effects of cadmium on bone.
Keywords
Introduction
Cadmium (Cd) is a toxic heavy metal that is widely distributed in the environment. Bone is one of the target organs for Cd damage. 1 It has been demonstrated that Cd exposure can result in low bone mass and a high risk of osteoporosis and bone fractures in humans and experimental animals. 2–6 Recently, it was hypothesized that Cd can enhance bone demineralization and increase bone fragility in in vivo studies. 5–7 However, the mechanism of bone toxicity induced by Cd exposure has not been fully clarified.
It has previously been hypothesized that Cd-induced bone damage is mediated by renal dysfunction. 8 Cd can increase the excretion of calcium and reduce the generation of active vitamin D in the kidney. As a result, calcium uptake and resorption in the gastrointestinal gut are decreased, and bone formation and mineralization are inhibited. Cd primarily harms the kidney, followed by bone damage as a secondary effect. 9 Some epidemiological studies in Europe have suggested that a low concentration of Cd exposure, while unable to induce kidney damage, can decrease bone mineral density (BMD) and increase the risk of bone fracture. 10–12 A few studies in vitro have also suggested that Cd can alter the metabolism and activity of osteoblasts 13,14 and osteoclasts. 14,15 In other words, Cd may have a direct influence on bone.
Most previous population studies and animal studies focus on Cd effects on bone mass, including BMD and bone mineral content. Bone strength and stiffness depend strongly not only on bone mass, but also depend on the microarchitecture and tissue quality of both cancellous and cortical bone. 16 A few recent studies have suggested that Cd can influence bone biomechanical properties, but the mechanism of this influence is still unclear. 7,17 It has been suggested that bone structure and microarchitecture are important determinant aspects of bone strength and essential elements for the assessment of bone mechanical properties; 16,18 however, very few studies have investigated Cd effects on bone microstructure.
The skeleton is dynamic, with bone remodeling occurring in response to mechanical and metabolic demands. Osteoblasts and osteoclasts are two important bone-associated cells that concern bone formation and resorption, including the growth, modeling and remodeling of the skeleton. Uncoupling of the remodeling processes of bone formation and resorption could induce bone loss. 15 Some in vitro studies have indicated that Cd can inhibit bone formation and disturb collagen metabolism. 13,19 A few studies have suggested that osteoclasts may play an important role in the effects of Cd on bone, especially at relative low-level exposure. 5,14,15
Tartrate-resistant acid phosphatase 5b (Tracp 5b) is one of several new bone metabolic biomarkers that can be specifically secreted by osteoclasts. 20,21 Recent studies revealed that Tracp 5b could reflect the number and activity of osteoclasts and could also indicate bone mineral loss. 22–24 Moreover, Tracp 5b concentrations in serum are much more stable than other biomarkers and cannot be influenced by liver and kidney metabolism and circadian rhythms. 20
In the present study, we evaluated microstructure status in male rats treated with Cd using microcomputed tomography (MicroCT) and histology methods. Meanwhile, we chose Tracp 5b as marker to investigate the effect of Cd on osteoclasts in male rats.
Materials and methods
Experimental design
The protocol employed here was approved by the Local Ethics Committee for Animal Experiments at Fudan University. Twenty-one eight-week-old Sprague-Dawley male rats (Sippr/BK, Shanghai, China) weighing 180–200 g were housed in the specific pathogen free animal facilities under controlled conditions (temperature 21 ± 1°C; relative humidity 50 ± 10%; 12:12 h light − dark cycle). After acclimatization to laboratory conditions for seven days, the rats were randomly divided into three groups of seven rats: one control group and two Cd-exposed groups. The Cd-treated groups were given CdCl2 by subcutaneous injection at the doses of 0.1 and 0.5 mg/kg body weight (bw) five times per week for 12 weeks. The control rats were given sodium chloride free of Cd throughout the whole experiment. The body weight of each rat was measured every week, and the volume of injection was adjusted to keep the levels of exposure constant. All the rats were administered intraperitonealy with tetracycline (30 mg/kg bw) and calcein (5 mg/kg bw) on the 14th and fourth days before being killed.
To create a model of human environmental exposure in low and heavily polluted areas, the dose of 0.1 and 0.5 mg Cd/kg bw was chose in this study according to our pilot experiment and other literatures. 5,7,17
MicroCT analysis
Before killing, microCT scanning was performed in four randomly selected rats from the 0 and 0.5 mg Cd/kg bw groups on the proximal tibia using a GE eXplore locus scanner (GE healthcare, Waukesha, WI, USA), imaged with an X-ray tube voltage of 80 kV and a current of 450 μA. Rats were anesthetized by chloral hydrate and fixed on the scanning platform. A spatial resolution with a voxel size of 45 μm was chosen to scan the left tibia of each rat. The standard analysis software (Microview 2.1.2) provided by the manufacturer was used to assess structural parameters. Trabecular bone was selected and reconstructed for analysis within a conforming volume of interest (cortical bone excluded) beginning at a distance of 1 mm from the growth plate and extending a further longitudinal distance of 0.5 mm in the distal direction. 25 Bone volume fraction (BV/TV), trabecular thickness (Tb.Th), trabecular separation (Tb.Sp) and trabecular number (Tb.N) were then calculated.
Sample collection
At the 12th week after the 24-h urine collection, all rats were anesthetized with 20% urethane (0.5 mL/100 g bw), and blood was collected from the carotid artery. The part of the blood collected without anticoagulant was clotted and centrifuged for serum isolation. To ensure that the vessels were Cd-free, they were washed with diluted nitric acid followed by deionized water. Blood and urine samples were divided into aliquots and frozen at −20 and −80°C, respectively, until analysis. After killing, lumbar spines (L1–L5) were isolated from any soft tissue and wrapped with gauze in cold sodium chloride solution for BMD measurement. The L4 and right tibia were obtained for bone histology. The left femur was selected for the Cd assay.
Cd analysis
Cd concentrations in blood, urine and bone were assayed by inductively coupled plasma mass spectrometry (ICP-MS; Thermo Elemental Co, Ltd, Waltham, MA, USA) using the US Environmental Protection Agency method. Briefly, 0.5 mL whole blood and 1 mL urine were digested with HNO3 (70% HNO3 for trace metal analysis). After partial evaporation and cooling, H2O2 (36.5–38.0% for trace metal analysis) was added, and the solution was completely evaporated. The precipitate was dissolved in 1 mL HNO3, and analysis was performed with ICP-MS after appropriate dilution. Concentrations were measured using a standard calibration curve.
After being ashed in a muffle oven (Yiheng, Shanghai, China) at 600°C for six hours, the right tibia was dissolved in HNO3 (70% HNO3 for trace metal analysis). Analysis was subsequently performed with ICP-MS. The detection limit for Cd using ICP-MS was 0.4 ng/L.
Bone densitometry
The measurements of BMD of L1–L5 were obtained by dual-energy X-ray absorptiometry (DEXA) using a Hologic QDR 4000 (Bedford, MA, USA) densitometer with Small Animal Software. The coefficient of variation (CV) for repeated measurements in vivo was evaluated to be below 1%. All measurements were made on the same day, and the densitometrical parameters were analyzed by the same examiner.
Bone histology
Hematoxylin and eosin (HE) stain and Goldner's trichrome stain were used in the histology analysis. L4 was fixed in 10% formalin for three days at 4°C and then decalcified in ethylenediaminetetraacetic acid for three days at room temperature, embedded in paraffin and sliced for HE staining. The right upper tibia was fixed in Million's solution at 4°C for three days, and the solution was changed every day. The tibia was dehydrated through a series of ascending ethanol solutions (40–100%) and then cleared with dimethylbenzene, filtered with methylmethacrylate and embedded in methylmethacrylate. After polymerization, the blocks were trimmed with a saw to remove excess plastic. Sections, 8 μm in thickness, were obtained using a rotary microtome (Leica 2255, Wetzlar, Hesse, Germany) for Goldner's trichrome stain. Meanwhile, 20-μm-thick slices were prepared for mineral apposition rate (MAR) analysis using a fluorescence microscope (Nikon 80, Tokyo, Japan).
Scanning electron microscope (SEM) analysis was conducted using a Hitachi S520 SEM (Tokyo, Japan). After removing all organic materials from the specimens, the L2 was cut in half from the middle using a saw and then washed with distilled water three times to remove any debris from the samples. The bone was then mounted on the SEM stub with carbon tape and carbon-coated.
Biomarker assay
A rat TRAPTM enzyme immunoassay (EIA) kit (IDS, Tyne & Wear, UK) and a rat-mid osteocalcin (OC) EIA kit (IDS) were used in the determination of Tracp 5b and OC. The intra-assay CV of the method for Tracp 5b was 3.5–5.8%, the recovery rate was 92–105%, the standard sample supplied by the kit was 1.7 (1.3–2.2) U/L and the obtained result in our laboratory was 1.62 U/L. The intra-assay CV of the method for OC was 5.5–7.7%, the recovery rate was 83–106%, the standard sample supplied by the kit was 191.9 (154.8–232.2) ng/mL and our result was 189.4 ng/mL.
Statistical analysis
SPSS 11.5 (SPSS Inc, Chicago, IL, USA) was used for data management and statistical analysis. Data are expressed as means ± SD. One-way analysis of variance was used to evaluate the statistically significant differences between the control and Cd-exposed groups. Pearson correlation analysis was applied to investigate the relationship among variables. P values below 0.05 were considered statistically significant.
Results
Body weight
Before euthanasia, the body weights of rats were collected every two weeks (Figure 1). All rats increased their weight during the experiment. We found that Cd had no obvious influence on the body weight of rats.
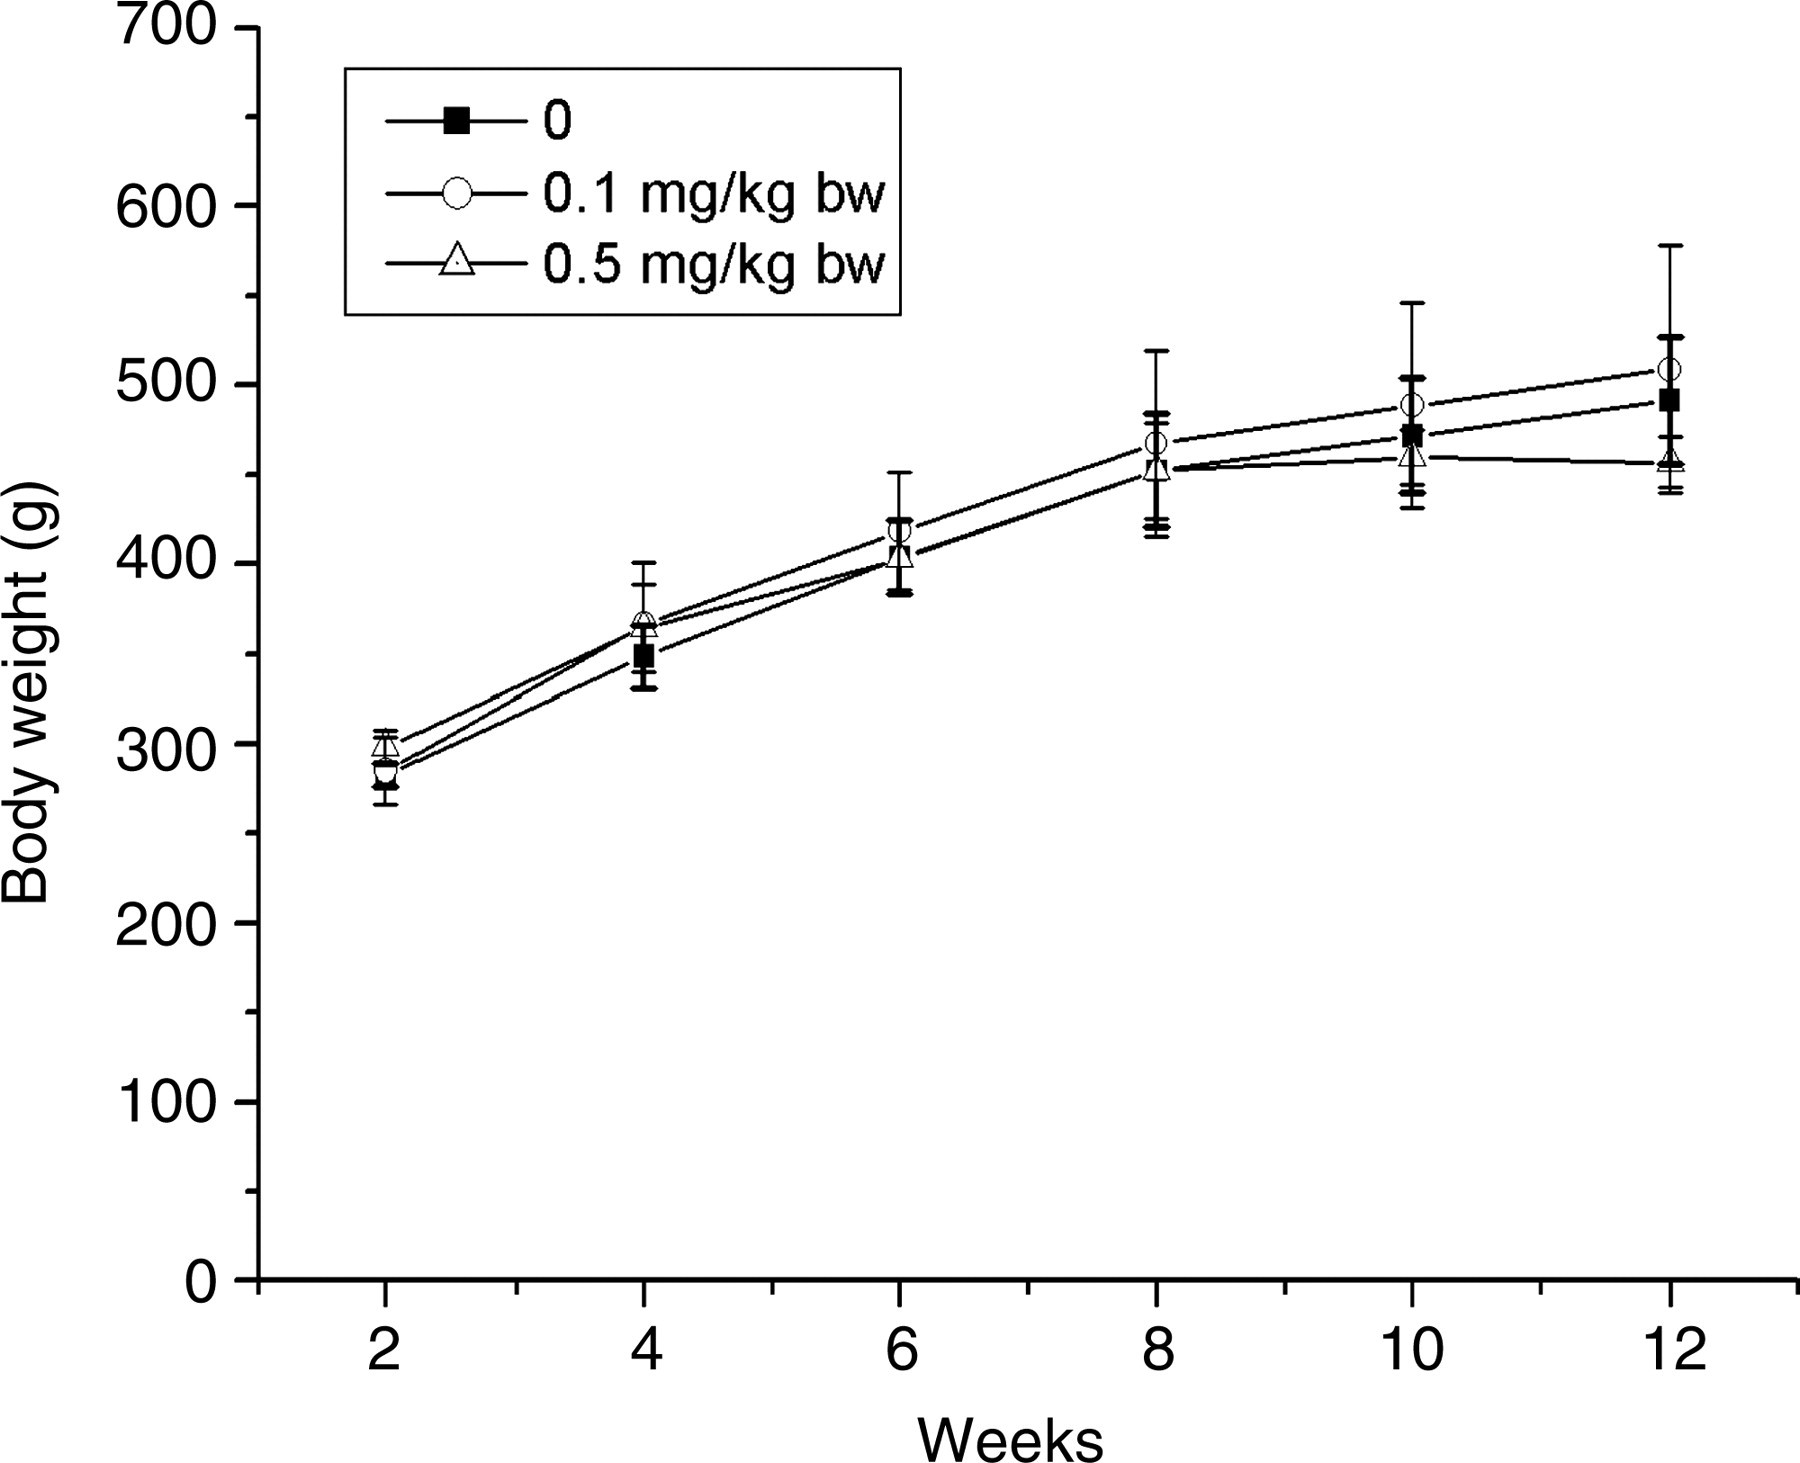
Body weight (bw) of control (0) and cadmium-treated rats. bw data were collected every two weeks. Data were shown as means ± SD (n = 6–7)
Exposure assay
At the 12th week, blood, urine and bone tissue were obtained for Cd analysis (Figure 2). Cd concentrations in the blood, urine and bone of control rats were very low. Exposure to Cd caused a dose-dependent increase in the body burden of this metal, as evaluated by blood and urinary Cd and its accumulation in the femur. Cd concentrations in blood, urine and bone were much higher in exposure groups when compared with the control. UCd (cadmium in urine) levels of rats in the 0.1 and 0.5 mg/kg bw groups were close to human environmental exposure in low and highly polluted areas. 3 Cd concentrations in the blood, urine and bone of those rats demonstrated that the experimental model well reflected the Cd exposure.
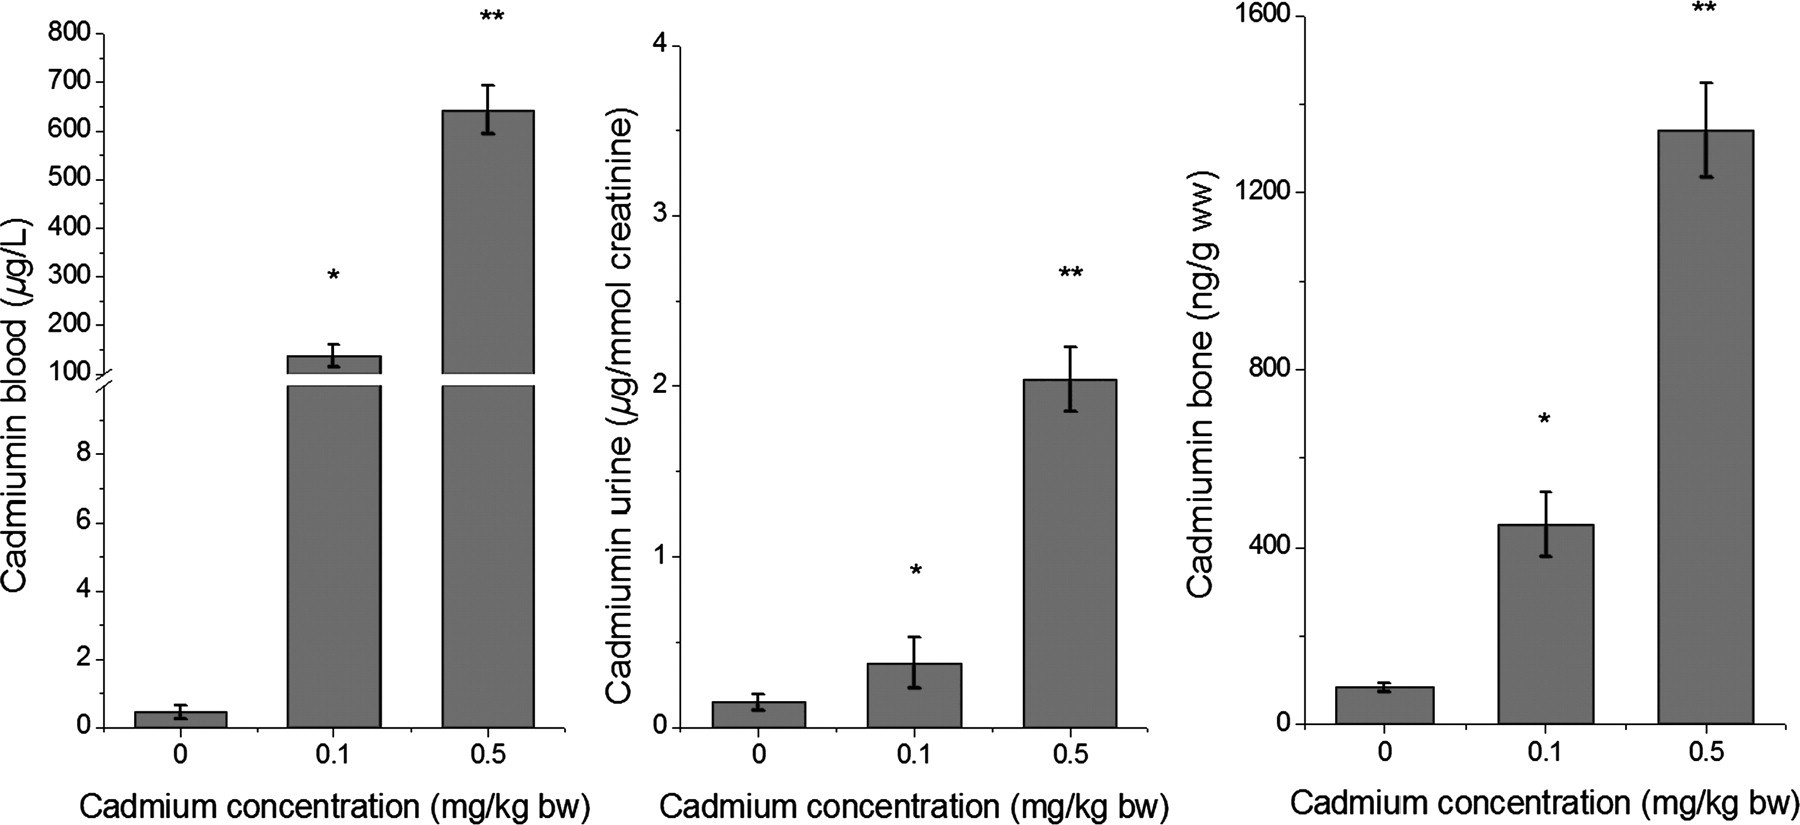
Cadmium in blood, urine and bone were determined using inductively coupled plasma mass spectrometry. Data are shown as means ± SD (n = 6–7). Statistically significant difference (P < 0.01): *significantly different versus 0; **significantly different versus other two groups
BMD of the lumbar spine
L1–L5 BMD was measured using DEXA (Figure 3a). BMD of rats treated with Cd were decreased relative to the control. Exposure to 0.5 mg Cd/kg resulted in a significant decrease of BMD relative to the control by 10%, whereas exposure to 0.1 mg Cd/kg had no statistically significant influence on BMD.
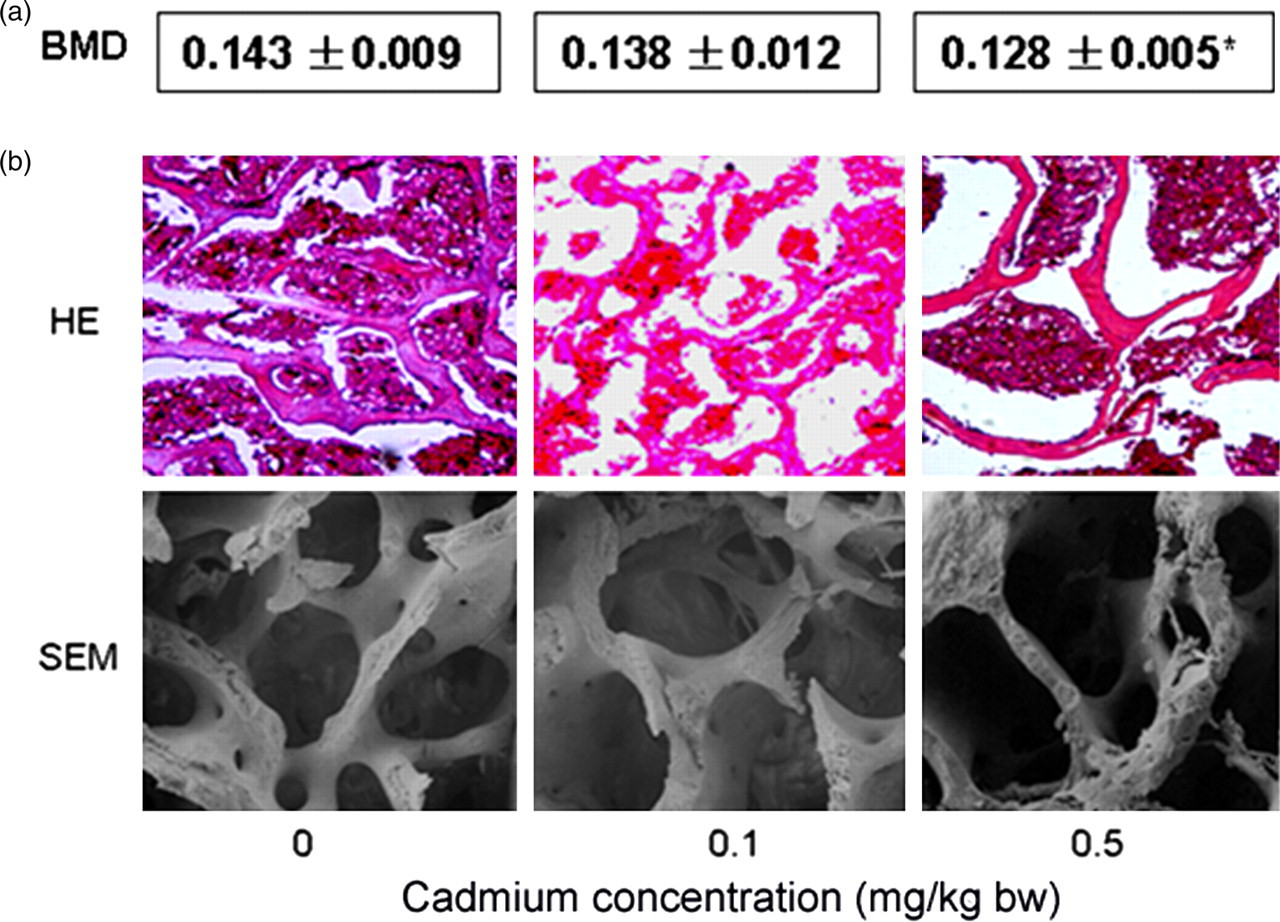
(a) Lumbar spine (L1–L5) bone mineral density (BMD) of control (0) and cadmium-treated rats. The measurements were done by dual-energy X-ray absorptiometry. Data are shown as means ± SD (n = 6–7). (b) Bone histology using hematoxylin and eosin (HE) stain and scanning electron microscopy (SEM) for lumbar spine of control (0) and cadmium-treated rats. *Significantly different versus 0 (A color version of this figure is available in the online journal)
Bone histology and histomorphometry
Two-dimensional (2D) images, obtained using HE stain for lumbar (Figure 3b) and Goldner's trichrome stain for tibia (Figure 4a), revealed that Tb.N and Tb.Th decreased and Tb.Sp increased relative to the control group. Bone morphometry analysis using microCT showed that BV/TV, Tb.N, Tb.Th (Figure 4b) and MAR (Figures 4c and 4d) decreased and Tb.Sp (Figure 4b) increased in Cd-exposed groups relative to the control group, especially in rats exposed to 0.5 mg Cd/kg. MicroCT reconstruction images (Figure 5a) and SEM (Figure 3b) also showed obvious trabecular bone damage (Tb.N decreased and Tb.Sp increased) in rats exposed to Cd. Otherwise, trabecular conjunction points were obviously decreased, and dissociated ends were significantly increased in groups treated with Cd in 2D and 3D images, especially in the group treated with 0.5 mg Cd/kg bw. Cd may cause damage to bone microstructure and induce bone demineralization.
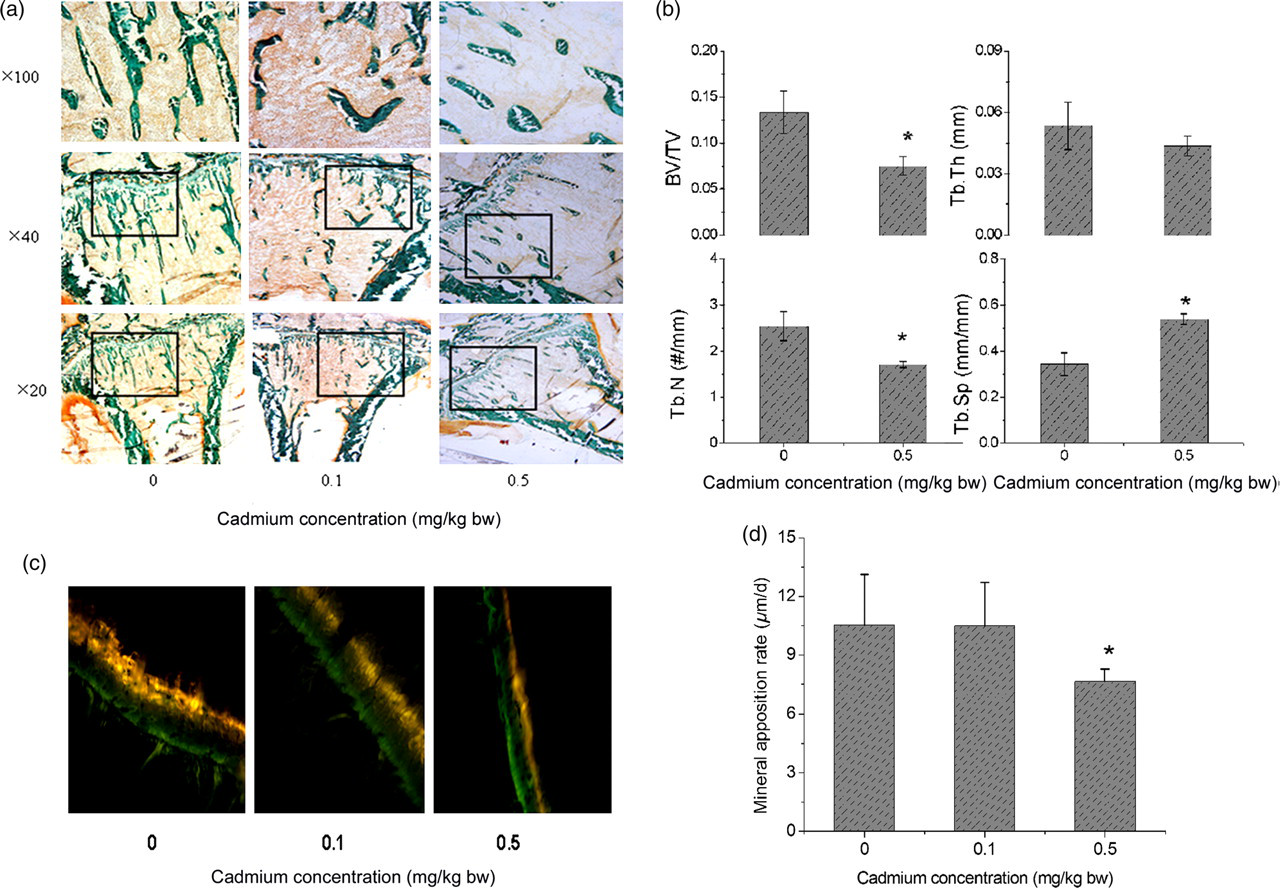
Bone morphometry of control (0) and cadmium-treated rats. Goldner's trichrome stain for tibia (a); microcomputed tomography analyses were performed in four randomly selected rats of 0 and 0.5 mg Cd/kg bw groups on the proximal tibia using the GE eXplore locus scanner (GE healthcare) based on bone volume fraction and bone trabecular analysis (b). After being marked with tetracycline and calcein, bone mineral levels was evaluated by the mineral apposition rate in the tibia using fluorescent microscopy (c, d). Data are shown as means ± SD (n = 4–7); *significantly different (P < 0.05) versus 0. BV/TV, bone volume fraction; Tb.N, trabecular number; Tb.Th, trabecular thickness; Tb.Sp, trabecular separation (A color version of this figure is available in the online journal)
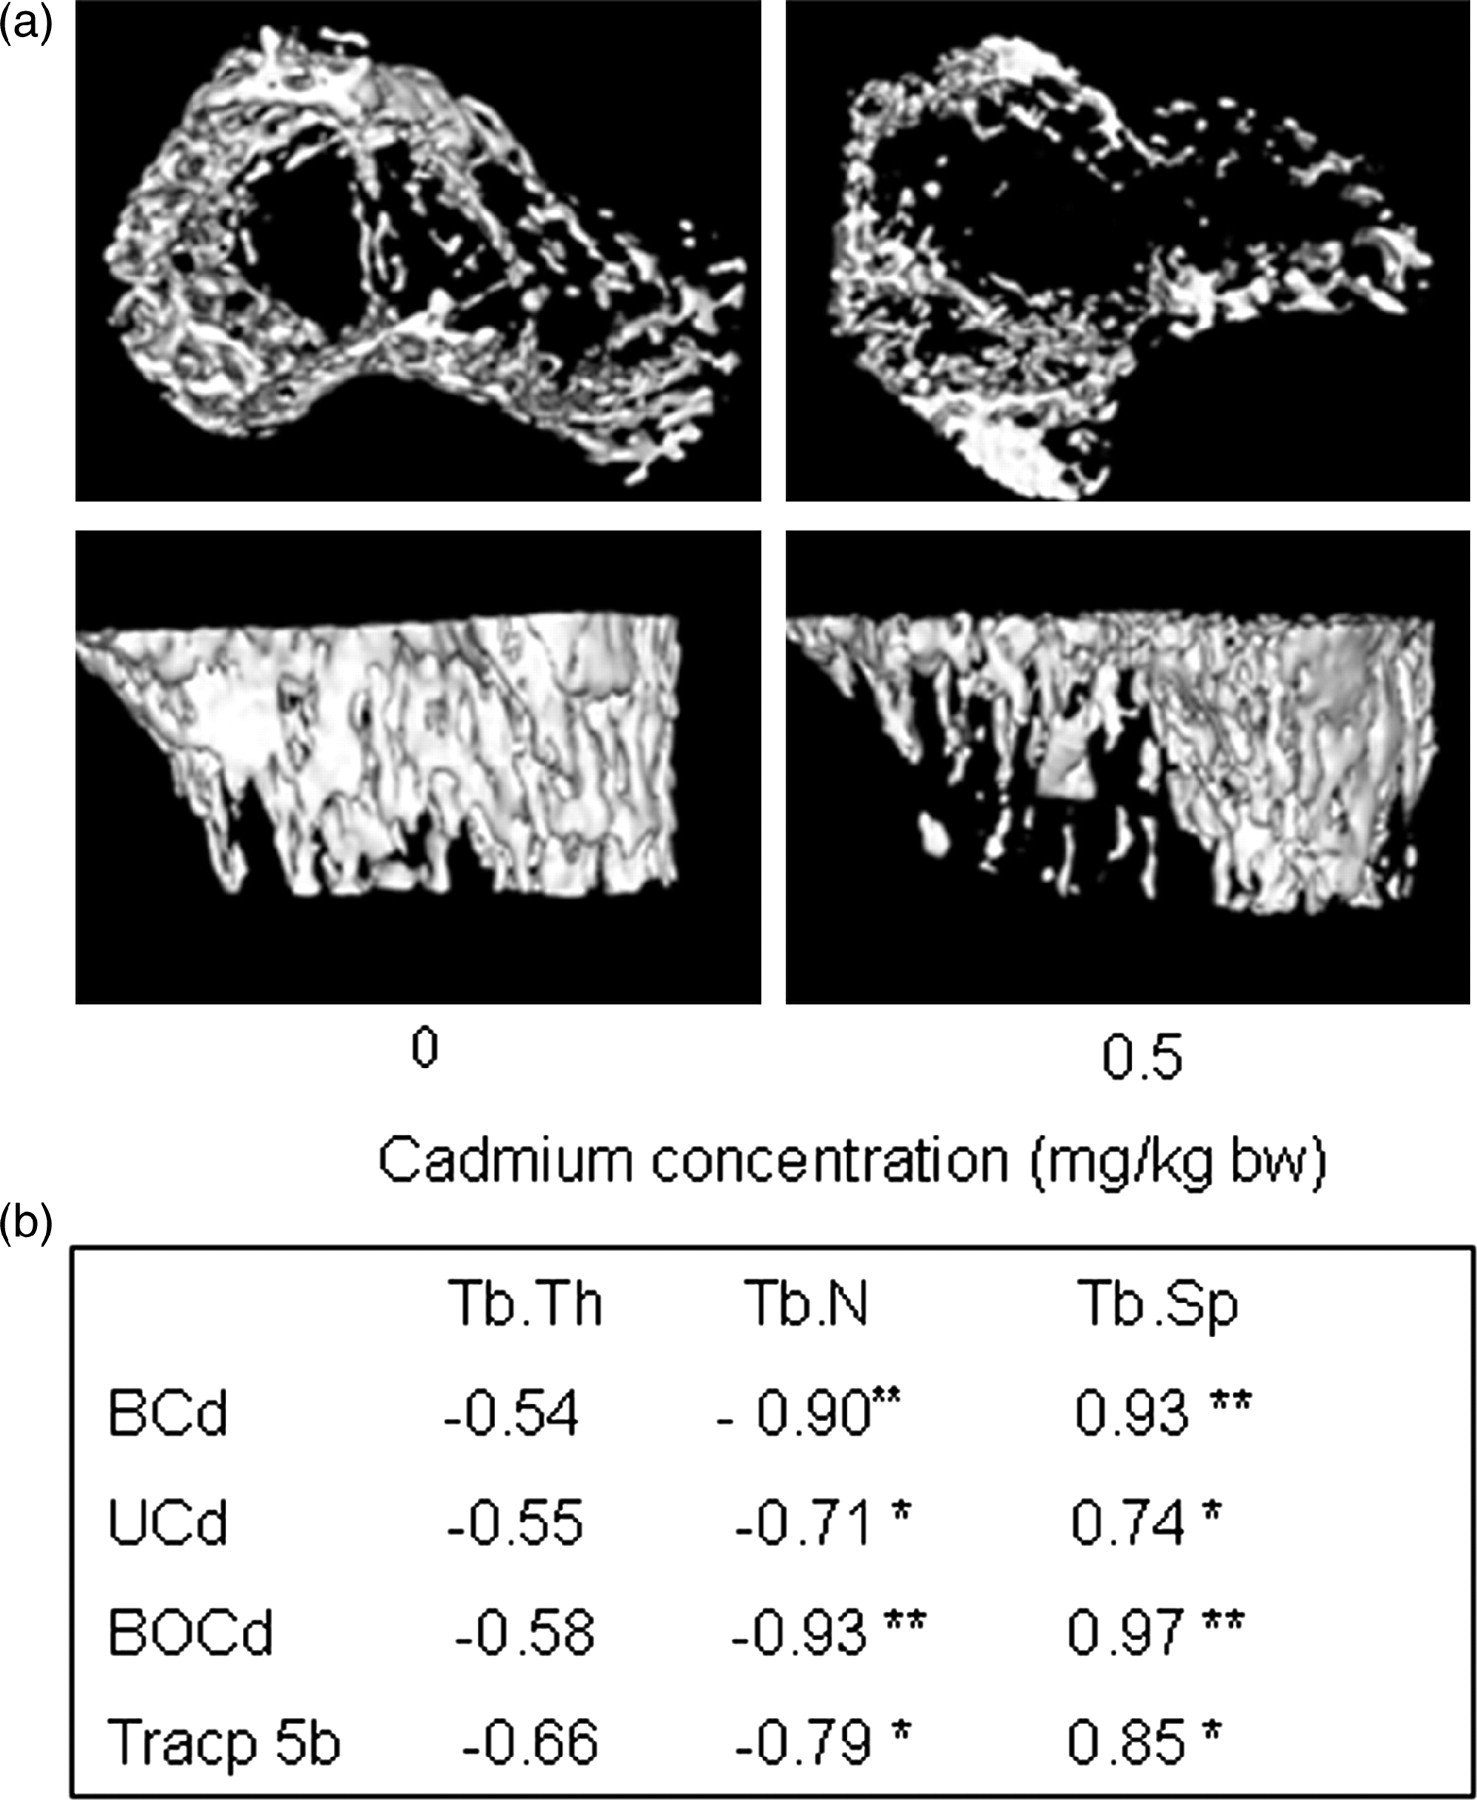
Microcomputed tomography analyses (a) were performed in randomly selected rats of control (0) and 0.5 mg Cd/kg bw groups on the proximal tibia using the GE eXplore locus scanner (GE healthcare). Pearson correlation analysis (b) was performed to investigate the relationship among trabecular parameters and cadmium and serum tartrate-resistant acid phosphatase 5b (Tracp 5b) concentrations. BCd, cadmium in blood; UCd, cadmium in urine; BOCd, cadmium in bone; Tb.N, trabecular number; Tb.Th, trabecular thickness; Tb.Sp, trabecular separation. Significantly different: **P < 0.01; *P < 0.05
Bone metabolic biomarkers
The Cd treatment, regardless of the exposure level, had no obvious influence on serum concentrations of OC (Figure 6), except for an increasing tendency of OC in the 0.5 mg Cd/kg group. However, the Tracp 5b concentration was much higher in the Cd exposure group relative to the control (Figure 6). Tracp 5b increased with increasing Cd exposure. Serum Tracp 5b increased markedly by approximately 150% and 250% in the 0.1 and 0.5 mg Cd/kg groups relative to the control.
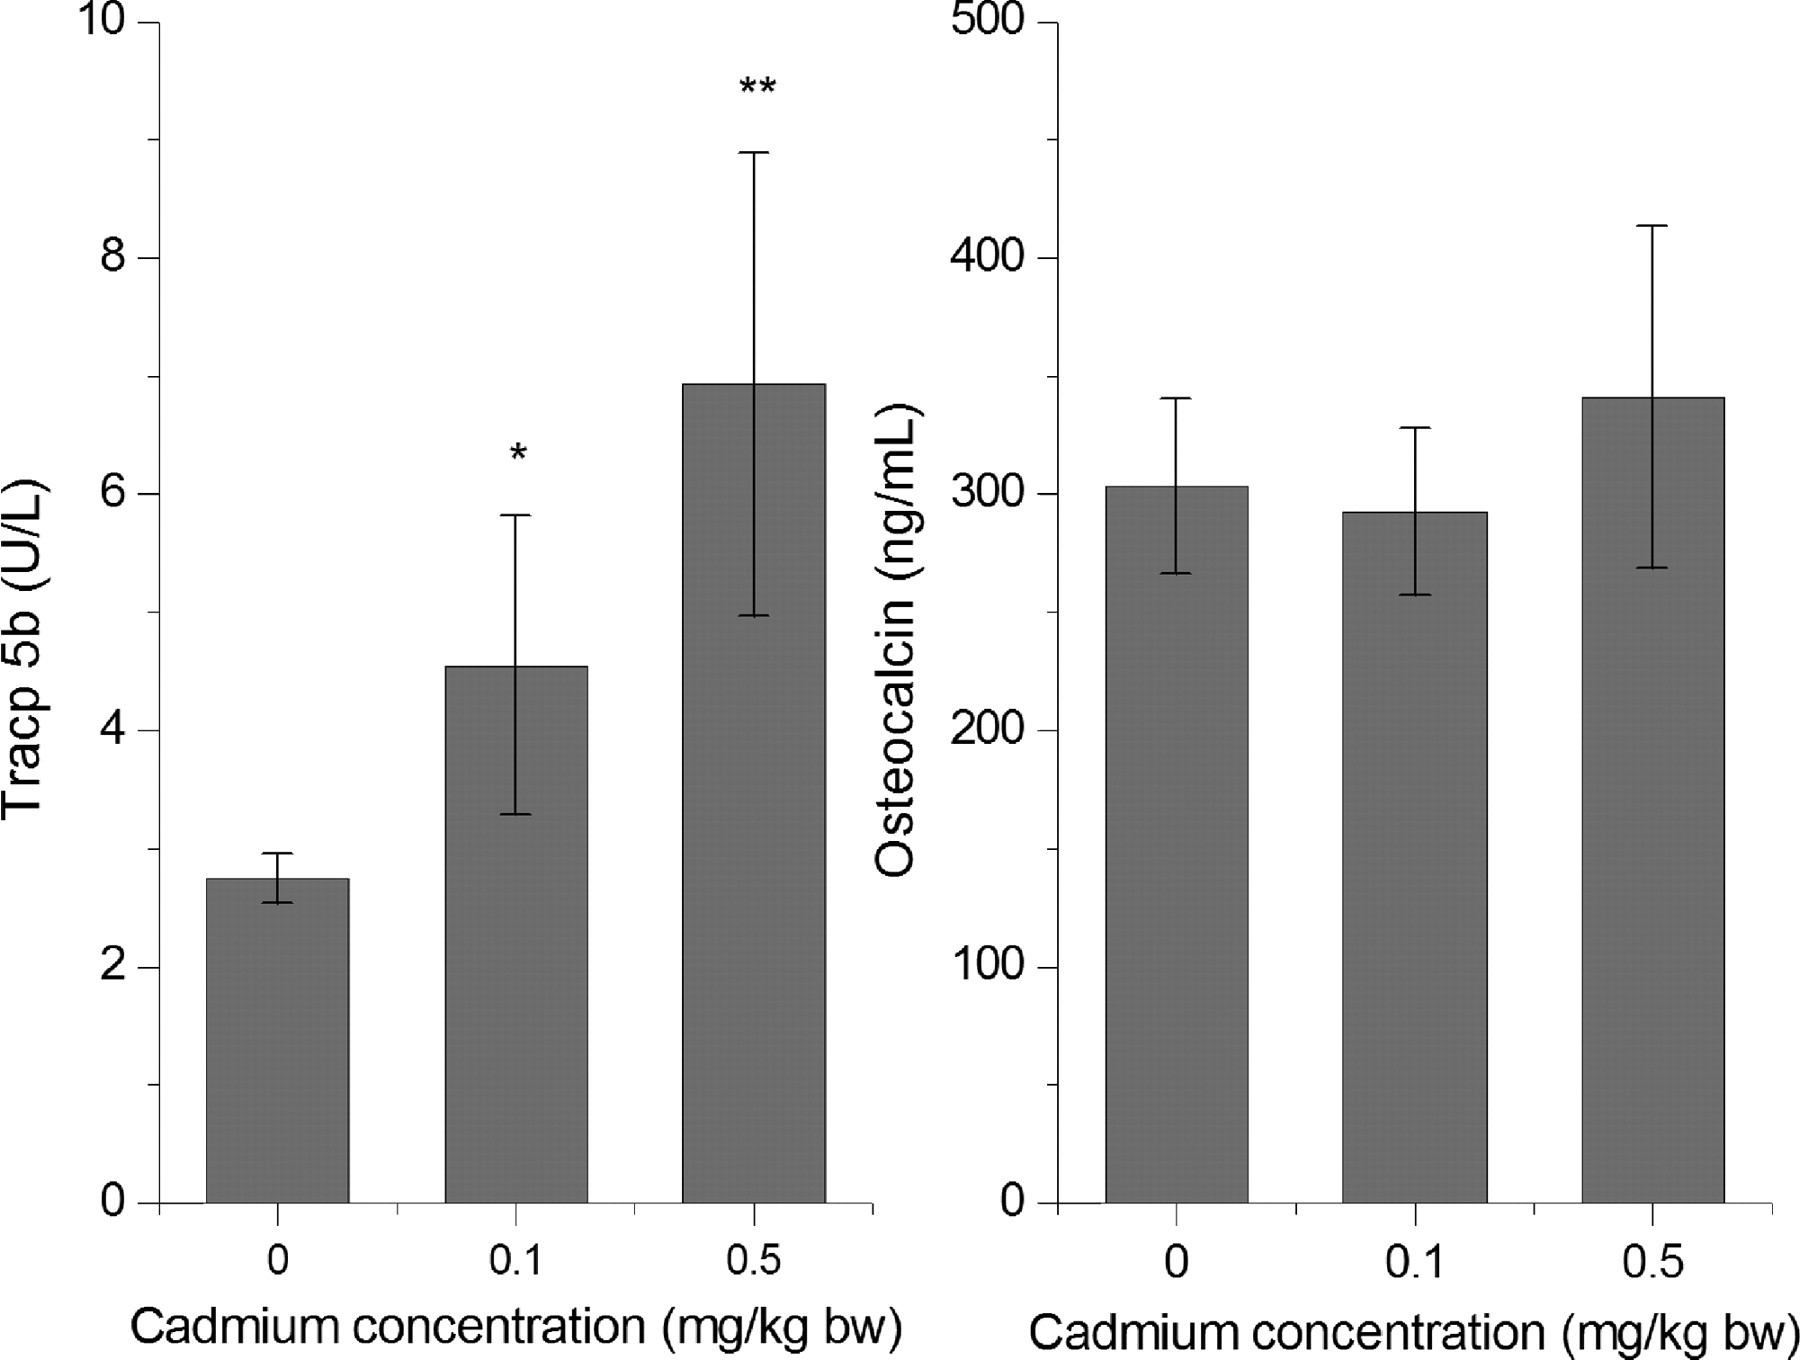
Serum tartrate-resistant acid phosphatase 5b (Tracp 5b) and osteocalcin (OC) concentrations in different groups were measured using the enzyme immunoassay. Tracp 5b increased with the increase of cadmium exposure, but no obvious difference was found for OC. Data are shown as means ± SD (n = 6–7). *P < 0.05 versus 0; **P < 0.01, versus other two groups
Correlation analysis
Table 1 summarizes the correlations between the Cd concentration and bone-related variables in a single regression. BMD and MAR were negatively correlated with Cd concentration in bone (BOCd) and blood BCd (P < 0.01 and P < 0.05). However, Tracp 5b was positively correlated with BCd, UCd and BOCd (r = 0.868, 0.727 and 0.779, respectively, P < 0.01). Bone-related variables were also negatively correlated with UCd, but there were no significant differences. BCd, UCd, BOCd and Tracp5b (Figure 5b) were significantly correlated with Th.N and Th.Sp (P < 0.001).
Correlation coefficients among different variables
BMD, bone mineral density; Tracp 5b, tartrate-resistant acid phosphatase 5b; OC, osteocalcin; BCd, cadmium in blood; UCd, cadmium in urine; BOCd, cadmium in bone; MAR, mineral apposition rate
Pearson correlation analysis was performed to investigate the relationship among variables. Data are shown as correlation coefficients (r)
**P < 0.01; *P < 0.05
Discussion
The present study aimed to estimate the effects of Cd on bone microstructure and serum Tracp 5b concentrations. Cd concentrations in the blood, urine and bone (recognized as markers of exposure to this metal) of rats exposed to Cd were significantly higher than those in rats treated with sodium chloride. Cd had obvious effects on bone microstructure and serum Tracp 5b concentrations.
Recently, osteoporosis was defined as a disease characterized by low bone mass and structural deterioration of bone tissue, which leads to bone fragility and an increased susceptibility to fractures. 26 However, previous studies on bone damage caused by Cd focused primarily on bone mass, including BMD, bone mineral content and bone biomechanical properties. A few studies have demonstrated that Cd can influence bone structural parameters in ovariectomized rats. 27 In the present study, to generally observe the effects of Cd on bone, we investigated bone status not only in terms of bone mass but also from the aspect of bone structural properties.
The BMD of rats treated with Cd decreased relative to the control. For the 0.1 mg Cd/kg group, no significant difference in BMD was found compared with the control. However, the BMD of rats exposed to 0.5 mg Cd/kg decreased significantly compared with the control. Cd exposure can therefore cause a relatively large decrease in BMD. Changes in BMD caused by Cd might occur later than other markers such as bone microstructure parameters and metabolic biomarker.
Bone quality can be quantitatively evaluated by bone mass and bone strength. Bone strength is a complex property involving mass, density, biomechanical status, microarchitecture, degree of collagen cross-linking and the conditions of testing. 28,29 BMD is a useful indicator for the diagnosis of osteoporosis; however, this parameter only provides information regarding the quantity of mineral in bone, which is only one component of bone strength. 30 Bone mass alone accounted for only about 76% of the variability in strength, but a combination of bone volume and structural features explained up to 90% of variability in strength. 31
Bone microstructure seems to be an important factor in understanding the mechanisms of bone fragility. It has been indicated that microstructural alternation is an important determinant of bone fragility that is independent of bone density. 32,33 Microarchitecture is based on the number, thickness and separation of trabecula as well as on their spatial organization. There are several methods to assess bone structure, particularly at the trabecular level. In particular, histomorphometry, which is based on the use of optical microscopy and on the principles of quantitative histology, evaluates microarchitecture two dimensionally. In addition, new computerized methods such as microCT, which allows the acquisition of more sophisticated measurements, have been introduced to integrate the use of the microscope. 16 In our study, both optical microscope and microCT methods were adopted.
Previously, it was demonstrated that Cd exposure could decrease bone mass, bone density and bone biomechanical properties. 2,5–7 In this study, we used histology and histomorphometry methods to reveal that Cd could cause damage to bone microstructure, especially to cancellous bone. Using a morphormetry assay, it was observed that BV/TV and Tb.N decreased and Tb.Sp increased after Cd exposure at a concentration of 0.5 mg/kg. HE staining for lumbar and Goldner's trichrome staining for proximal tibia also showed that trabecular bone became sparse, Tb.Sp increased and trabecular connectivity decreased according to 2D images. Moreover, SEM scanning for lumbar and microCT scanning revealed that Tb.N and trabecular conjunctions decreased in 3D images. We also found that the bone MAR declined after 0.5 mg Cd/kg treatment, which means Cd could inhibit bone mineralization; however, no obvious inhibition was found at 0.1 mg Cd/kg. Recent studies including experiments in vitro carried out on bone cultures suggest that Cd acts directly on the activity and metabolism of bone cells and mineralization. 5,7,17,34 Our present study was consistent with those findings.
Unfortunately, microCT scanning was only conducted on the control and 0.5 mg Cd/kg groups in this study due to the high cost of measurements. However, the histological study showed that bone microstructure may be broken even at the 0.1 mg Cd/kg exposure level. Recently, it was suggested that Cd exposure can cause osteoporosis and osteomalicia and can increase the risk of bone fracture at environmentally relevant levels. 2,3,11,35 Microstructure damage may be one of the direct lines of evidence of the toxic effects of Cd on bone.
Osteoclasts are a type of bone cells that are involved in bone resorption. Normal bone structure depends on the balance of resorption and formation. 15 Tracp 5b is one kind of new bone metabolic biomarker that can be specifically secreted by osteoclasts. 21 Recent studies determined that Tracp 5b could reflect the number and activity of osteoclasts and could also indicate bone mineral loss. 22 Tracp 5b concentrations in serum could be used instead of histology assays to evaluate the number of osteoclasts. 22–24 It has been shown that Cd exposure could increase the number of Trap-positive osteoclasts in ovariectomized rats. 27 In the present study, we found that Cd increased Tracp 5b concentrations even at a dose of 0.1 mg Cd/kg. The concentration of Tracp 5b in serum was about 1.5–2.5-fold higher in Cd-treated rats relative to the control. Therefore, Cd can clearly increase bone resorption ability by increasing the number of osteoclasts or their activity, and the change of Tracp 5b was earlier than the change of bone mass caused by Cd exposure. It has been shown that Cd may accelerate the differentiation of osteoclasts from their progenitor cells and enhance their activity in vitro 14,15 and that chronic Cd exposure could induce uncoupling between bone formation and bone resorption. 28 It has also been demonstrated that Cd can stimulate osteoblasts to secrete prostaglandin E2 in vitro 36 and increase serum parathyroid hormone levels; 37 both of these hormones can induce osteoclast formation. We believe that the increased resorption ability of osteoclasts may play a crucial role in the toxic effects on bone caused by Cd; however, the mechanism of action of Cd on osteoclasts is not understood.
Some markers, such as cross-linked c-telopeptide of type I collagen and cross-linked n-telopeptide of type I collagen, could be used as indicators for bone resorption. 38,39 However, concentrations of those markers in blood or urine can be influenced by feedings, kidney and liver function. 21,40,41 Renal function can influence the concentrations of these markers because the markers are cleared from the circulation through the kidneys. 21,40 When renal dysfunction occurs, the markers cannot be cleared from the blood, leading to increased marker values in serum. Tracp 5b is cleared from the circulation through the liver and, thus, kidney function has no effect on serum Tracp 5b values. 21,40 Otherwise, Tracp 5b is inactivated and degraded to fragments before clearance from circulation by the liver. Therefore, active Tracp 5b does not accumulate even in the case of hepatic failure. 21,42 Our data show that serum Tracp 5b was correlated with Cd in blood, urine and bone and MAR, Tb.N, Tb.Sp. Therefore, we hypothesize that Tracp 5b can be used as an effective marker for Cd damage to bone even though Cd exposure can cause renal dysfunction and liver damage.
In conclusion, the present study demonstrates that the Cd that accumulates in the body can induce damage to cancellous bone microstructure. The presence of Cd may accelerate bone loss via increasing the number or activity of osteoclasts and inhibiting bone formation. Tracp 5b may be used as a biomarker of bone toxicity caused by Cd. Further analysis is required to address these several outstanding issues.
Footnotes
Acknowledgements
This study was funded by Shanghai Health Bureau (08GWD09).