
Abstract
It is well recognized by orthopedic surgeons that fractures of alcoholics are more difficult to heal successfully and have a higher incidence of non-union, but the mechanism of alcohol's effect on fracture healing is unknown. In order to give direction for the study of the effects of alcohol on fracture healing, we propose to identify gene expression and microRNA changes during the early stages of fracture healing that might be attributable to alcohol consumption. As the inflammatory stage appears to be the most critical for successful fracture healing, this paper focuses on the events at day three following fracture or the stage of inflammation. Sprague–Dawley rats were placed on an ethanol-containing or pair-fed Lieber and DeCarli diet for four weeks prior to surgical fracture. Following insertion of a medullary pin, a closed mid-diaphyseal fracture was induced using a Bonnarens and Einhorn fracture device. At three days' post-fracture, the region of the fracture calluses was harvested from the right hind-limb. RNA was extracted and microarray analysis was conducted against the entire rat genome. There were 35 genes that demonstrated significant increased expression due to alcohol consumption and 20 that decreased due to alcohol. In addition, the expression of 20 microRNAs was increased and six decreased. In summary, while it is recognized that mRNA levels may or may not represent protein levels successfully produced by the cell, these studies reveal changes in gene expression that support the hypothesis that alcohol consumption affects events involved with inflammation. MicroRNAs are known to modulate mRNA and these findings were consistent with much of what was seen with mRNA microarray analysis, especially the involvement of smad4 which was demonstrated by mRNA microarray, microRNA and polymerase chain reaction.
Introduction
Alcoholics have increased numbers of orthopedic trauma resulting in fractures that frequently lead to retarded or non-union. Alcohol consumption has long been known to be associated with increased traumatic and non-traumatic bone fracture, to the extent that multiple rib fractures were once diagnostic of alcoholism. 1–4 It has been shown that the relative risk of some fracture types is increased in alcoholism and this association is so strong that the fracture itself can become a marker for alcoholism. 5,6 The high frequency of fractures is also in part due to the fact that alcohol abusers have a lower bone mass. 7,8 Bone samples from alcoholic patients have a low trabecular bone volume, thinner trabeculae and increased trabecular number due to trabecular perforation. 9,10 It also reduces the density and strength of cortical bone, which it attempts to compensate for by increasing the cross-sectional area. 11 It has also been recognized by orthopedic surgeons 12,13 that fractures of alcoholics are more difficult to heal successfully and have a higher incidence of non-union. 14,15 Early suggestions have attributed this increased morbidity to a suppressed immune defense, an inhibited wound healing, general muscle atrophy or a defective osteoblastic function induced by ethanol as reviewed by Tonnesen et al. 12 Sears et al. 16 have recently demonstrated suppressed serum markers of inflammation in alcohol-fed animals in response to injury.
In a prior study of the effects of alcohol on actively growing rat bone, the amount and rate of growth of the epiphyseal growth plate was dramatically reduced in alcohol-fed animals. 17 The height of the last hypertrophic lacuna decreased with age from 32 μm at week 4 of the project to 26 μm at week 8, and the rate of cell proliferation per column per day was also dramatically decreased in alcohol-fed animals. In light of the fact that callus formation during fracture healing undergoes a process similar to endochondral bone formation, 18 our central hypothesis is that alcohol consumption will adversely affect fracture healing through a perturbation of the normal cytokines and growth factors needed for normal fracture healing.
Normal bone healing requires coordination among many different cell types and regulatory proteins. Bone morphogenetic proteins (BMPs) are the best understood, but other factors such as PDGF (platelet-derived growth factor), IGF-1 (insulin-like growth factor 1), TGF-β (transforming growth factor β), LMP-1 (latent membrane protein 1) and bFGF (basic fibroblast growth factor) have also been documented in bone healing. 19–21 The first event after fracture is bleeding from the damaged bone ends. 22 The accumulated blood forms a clot that fills the space between the fracture surfaces. Then an acute inflammatory response begins, and inflammatory cells invade the soft tissues surrounding the fracture site, which initiate a full scale preparation for bone repair. 19,22 TGF-β, PDGF and BMP-2/4 have been identified in the first stage of bone healing, most likely released from platelets, local osteocytes and matrix. This early stage of bone healing involves complex cellular processes including cell migration, invasion, adhesion and proliferation, 22 which requires methods of study that allow for the simultaneous study of many events. TGF-α1 expression is high during chondrogenesis and endochondral ossification, but low during intramembranous ossification. 21 BMPs induce differentiation of mesenchymal osteoprogenitor cells, the most effective being BMP-2, -6 and -9, 23 PDGF acts early in the process by stimulating migration and proliferation of fibroblasts, and TGF-β is a stimulator of collagen production, angiogenesis 24 and osteoblast recruitment. Rundle et al. 25 demonstrated 6555 genes with significant changes during days 3 and 11 of normal fracture healing, with specific and unique patterns of expression during each of the first two phases covered by their experiment. However, their model did not address impaired healing, such as alcohol treatment. Callaci et al. 26 and Himes et al. 27 have associated alcohol-induced bone changes with transcriptome analysis but did not study fracture healing. At present, little is known about the altered microenvironment of fractures due to alcohol consumption. The present study is concerned with transcriptome changes during the inflammatory stages of fracture healing that can be attributed only to alcohol consumption.
It has been suggested that the required healing sequence is regulated by these signaling proteins and that aberrations lead to delayed or non-union. The therapeutic application of growth factors to stimulate fracture healing has had mixed success. 28 Microarray analysis is one of the most promising means of determining differences in the biological milieu. Comparing the gene expression profiles in normal and alcohol-treated tissue may reveal valuable information concerning the pathophysiology of the healing process in the alcoholic patient. We propose to identify gene changes during the inflammatory stage of fracture healing that might be attributable to alcohol consumption in order to give focus to future alcohol research. This paper focuses on the events at day three following fracture or the stage of inflammation.
Materials and methods
Animals
Weanling, four-week-old male Sprague–Dawley rats were placed on ethanol-containing (52.8 ± 0.7 g initial wt) or pair-fed Lieber and DeCarli diets (53 ± 1.5 g initial wt) following one week of environment equilibration. They received the special diets for four weeks. The rats were thus nine weeks when fractured. This age is comparable to the adolescent growth spurt, which is a time of peak injury in humans and is also an age for which much previous work with alcohol and bone has been conducted. This research was conducted in conformity with the American Physiological Society's Guiding Principles in the Care and Use of Animals and all procedures were approved by Scott and White's Institutional Animal Care and Use Committee.
Diet
Ethanol-fed animals were placed on a modified Lieber and DeCarli liquid diet (Bio-Serve Inc, Frenchtown, NJ, USA; Ca 1.3 g/L; P 1.75 g/L) with ethanol (8.1–9.4% v/v) added so that the diet contained 36% ethanol-derived calories. Liquid diet (pair-fed) control animals were treated the same as the ethanol-fed rats except they were pair-fed to rats in the ethanol group and fed the liquid diet with the ethanol replaced by isocaloric and isovolumetric amounts of maltose dextrins. There were originally four animals per group. Samples that did not pass our quality control check using the Agilent 2100 Bioanalyzer (Agilent Technologies, Santa Clara, CA, USA) were not included in the array studies, leaving three animals in each group that were analyzed.
Surgical procedure
Preoperative and intraoperative anesthesia of the rats was accomplished by intramuscular injections of ketamine (87 mg/kg body weight) and xylazine (13 mg/kg body weight). A small skin incision was made in the right knee, and the patella deflected. A 1.0-mm diameter hole was drilled into the intercondylar notch of the femur, and a stainless steel pin was inserted into the medullary canal and recessed about 1 mm. The skin was closed with wound clips. 29 A closed transverse mid-diaphyseal fracture was induced using a Bonnarens and Einhorn 30 fracture device. Acetaminophen (110–300 mg/kg orally, every 4 h as needed) was available for administration postoperatively as an analgesic for 48 h or until no sign of pain. 31 Postoperatively, the rats were allowed to bear weight as tolerated. The animals appeared to have little or no postoperative pain and were walking and raising up on their hind limbs as soon as they were awake.
The rats were euthanized at three days following fracture in order to study the first or inflammatory stage of healing. Euthanasia was performed using Euthanasia solution (w/324 mg/mL pentobarbital) at 100 mg/kg body weight and while under a plane of anesthesia. Twenty-microliter samples of blood were collected into heparinized microcapillary pipettes and placed into vials with a mixture of 0.6 N perchloric acid and 4 mmol/L n-propanol in double distilled water, which served as an internal control. The vials were capped tightly with a septum-sealed lid and stored at room temperature until analysis by headspace gas chromatography (Varian Associates, Palo Alto, CA, USA; model 3400) at least 24 h after collection.
The entire region of the bony fracture was harvested from the right hind-limb, frozen in liquid nitrogen and stored below −80°C for the microarray analysis.
The frozen samples were homogenized in 2 mL Trizol reagent using a Spex Freezer Mill (SPEX SamplePrep, St Metuchen, NJ, USA). The powder was quantitatively transferred to culture centrifuge tubes containing Trizol and RNA was isolated according to the manufacturer's directions for the Trizol kit (Invitrogen, Carlsbad, CA, USA). The RNA was then transferred to the Systems Biology Genomics facility (Temple, TX, USA) where they performed microarray analysis against the entire rat genome.
Sample designation
There were three replicates for each sample source, for example, A1, A2 and A3. There were six sample pairs with dye-swap replicates for each pair to make up the total of 12 two-color arrays for the experiment.
Microarray
After checking the quality and quantity of isolated total RNA from the day 3 rats using an Agilent 2100 Bioanalyzer, unclear purified total RNA samples were purified again using a MEGAclear™ purification kit (Cat #1908; Ambion, Austin, TX, USA). Total RNA samples (1–2 μg) were then used to generate double-stand DNA (dsDNA) by two rounds of reverse transcription. Synthesized dsDNA underwent in vitro transcription to produce amplified antisense RNA (aRNA) comprising amino allyl-modified UTP from the dsDNA template; we used aRNA amplification kits for these amplification steps (Cat #1753; Ambion).
After purifying the aRNA, the quality of the aRNA was analyzed again using the Agilent 2100 Bioanalyzer. Subsequently, coupling reactions of qualified aRNA (8–10 μg) and Cy3 or Cy5 mono-reactive dyes (Amersham Bioscience, Piscataway, NJ, USA) were performed with the procedures of Ambion kits (Cat #1795-7).
A Rat Array Ready Oligo Set (AROS) Version 3.0 containing 26,962 longmer probes representing 22,012 genes and 27,044 gene transcripts (Operon, Huntsville, AL, USA) was spotted to UltraGAPS™ coated glass slides (Corning, Fisher Scientific, Pittsburgh, PA, USA), and went through a prehybridization process to remove the excess DNA and reduce background noises. The dye-coupled aRNA was fragmented to improve the hybridization kinetics and signals produced on microarrays through using RNA Fragmentation Reagents (Cat #8740; Ambion). The fragmented aRNA was applied to the glass arrays and hybridized overnight for 17–19 h in an environmentally controlled oven at 42°C. After hybridization, the slides were washed by using Hyb Buffer Kits (Operon), and then read using the Axon 4000A scanner (Molecular Devices, Sunnyvale, CA, USA), which is a dual scanner that scans the 635 nm (red) and 532 nm (green) wavelengths simultaneously.
Data analysis
For each analysis, the dye-swap replicates were normalized and combined in GeneSpring GX (Version 7.3; Agilent Technologies) to get six pairs of sample data from original 12 pairs of sample data. The detailed normalization order in GeneSpring GX is listed below:
Data transformation: set measurements ≤1.0; Data transformation: dye swap (applied to half of the experiments); Per spot per chip: intensity dependent (Lowess) normalization; Per chip: normalize to a median or percentile; Per gene: normalize to median.
These six pairs of sample data were then quantile normalized in the R statistics environment and intensities were then log2-transformed.
Next, the TMeV program from TIGR (The Institute for Genomic Research, Rockville, MD, USA) was used for statistics tests on the array data. P values were calculated by ‘between subjects’ t-test.
Differentially expressed genes (DEGs) were with the criteria that −log10(P value) is more than 1.5 and the fold change is more than 2 (up-regulated) or less than 1/2 (down-regulated). P values for significant DEGs are thus less than 10−1.5, i.e. ∼0.0316, and all the effect values (absolute t-values) are more than 3.8, so we used effect size 3.8 and P value 0.0316 to do statistical power analysis with n = 3 to get a power value of 0.858. This indicates that we have adequate statistical power for our experimental data with sample size 3 by selecting genes based on the utilized t-test with a significance cut-off level of ∼0.0316 on the P value and also a fold-change cut-off as described. The combined criteria gave the consequent strong statistical power. We also considered genes differentially expressed if they displayed less than a two-fold change, but the P value of the change was small (P ≤ 0.01). Using a fold change of two or greater for average expression or a small P value (here P ≤ 0.01) is a common practice for identifying differentially expressed genes from microarray data. Because of the relatively small sample sizes used here, more stringent approaches would resist efforts for further analysis by producing smaller lists of differentially expressed genes. Although our approach thus has a heightened risk of producing false-positives, this risk is minimized by focusing attention on group-wise analysis in the form of Gene Ontology (GO) enrichment, Kyoto Encyclopedia of Genes and Genomes (KEGG) pathway enrichment and manual analysis of gene functional categories. These group-wise analyses are robust to individual false-positives, and we have applied stringent statistical criteria for the enrichment analyses (i.e. Bejamini–Hochberg-adjusted P values ≤0.05).
Enrichment analyses
Genes with greater than two-fold change
Genes with a P value of ≤0.01
Polymerase chain reaction
In order to verify the microarray results, polymerase chain reaction (PCR) was conducted on several of the up- and down-regulated genes taken from the cell migration and development categories identified in the discussion section. The primer sets used for PCR were as follows: Maea1, sense 5′ TGCATGCATCGGTGGAGTCGGCGGCTCAGT 3′, antisense 5′ GGCATGCATCAGAGTATTTATCGTTGCTCA 3′; Mtap2, sense 5′ CCTCTTCTGGAAGCATCAAC 3′, antisense 5′ GTAACAATTACTACAGTTGG 3′; Actn4, sense 5′ TATCACGCGGCGAACCA 3′, antisense 5′ TCATCCTCCTGGGCCATGT 3′; Mustin-1, sense 5′ ATGCGAGAGTGTGAGCAAGCT 3′, antisense 5′ TTCTCAGCCGAAGACACTCTTGT 3′; Testin, sense 5′ TCTAGAGAYGTNGARTGGAAYGARTGG 3′, antisense 5′ GGTRAGYAAGGTRAGNTGYAGAGATCT 3′; Smad4, sense 5′ GTTGCAGATAGCTTCAGGGC 3′, antisense 5′ GGATCCACGTATCCATCCAC 3′.
Reverse transcription was performed in a total volume of 20 μL with the high capacity cDNA Reverse Transcription kit (Applied Biosystems, Carlsbad, CA, USA) using 2 μg of RNA (final volume 10 μL), 2 μL of RT buffer (10×), 0.8 μL of 100 mmol/L dNTP mix (25×), 2 μL RT Random primers (10×), 1 μL of 50 U MultiScribe reverse transcriptase, 1 μL of 20 U RNase inhibitor and 3.2 μL of nuclease-free water. The reverse transcription reactions were incubated at 25°C for 10 min and then at 37°C for 120 min followed by 85°C for five minutes in order to inactivate the reverse transcription, using an Eppendorf Mastercycler PCR system (Eppendorf, Hamburg, Germany).
Conventional PCR was carried out in a total volume of 20 μL containing 4 μL reverse-transcribed cDNA, 0.5 μL of 50 pmol/L each primer, 5 μL of nuclease-free water and 10 μL of Universal PCR master mix (Applied Biosystems). PCR amplification was performed in the Eppendorf Mastercycler PCR system (Eppendorf). The amplification conditions used were: 95°C for 10 min, followed by 40 cycles of 95°C for 30 s, annealing at 60°C for one minute. PCR products were analyzed by 1.5% agarose gel electrophoresis stained with ethidium bromide for visualization under ultraviolet light.
MicroRNA array profiling
To identify regulating miRNAs of the identified processes, miRNA array was performed on four samples from each group. The quality of the total RNA was verified by an Agilent 2100 Bioanalyzer profile. One microgram total RNA from the sample and reference were labeled with Hy3™ and Hy5™ fluorescent labels, respectively, using the miRCURY™ LNA Array power labeling kit (Exiqon, Vedbaek, Denmark) following the procedure described by the manufacturer. The Hy3™-labeled samples and Hy5™-labeled samples were mixed pair-wise and hybridized to the miRCURY™ LNA array Version 10.0 (Exiqon), which contains capture probes targeting all miRNAs for all species registered in the miRBASE Version 10.0 at the Sanger Institute. The hybridization was performed according to the miRCURY™ LNA array manual using a Tecan HS4800 hybridization station (Tecan, Grödig, Austria). After hybridization, the microarray slides were scanned and stored in an ozone-free environment (ozone level below 2.0 ppb) in order to prevent potential bleaching of the fluorescent dyes. The miRCURY™ LNA array microarray slides were scanned using the Agilent G2565BA Microarray Scanner System (Agilent Technologies) and the image analysis was carried out using the ImaGene 8.0 software (BioDiscovery Inc, Segundo, CA, USA). The quantified signals were normalized using the global Lowess (LOcally WEighted Scatterplot Smoothing) regression algorithm.
MicroRNA realtime PCR
Selected microRNAs (miRNAs) were converted into cDNA by reverse transcription. Then, the cDNA was amplified by realtime PCR using the miCURY™ LNA miRNA PCR system. The experiment was performed with eight miRNAs and three endogenous controls. The stability of the endogenous controls was evaluated using the SLqPCR R-package, which is similar to the geNorm application. The three endogenous controls were used for normalizing the quantified signal (Cp) of the miRNAs. The relative expressions were calculated based on the efficiency corrected ▵▵Ct method. The PCR efficiency was estimated from a serial dilution of cDNA generated from pooled RNA of the samples.
Results
Result of testing differentially expressed genes for KEGG pathway enrichment
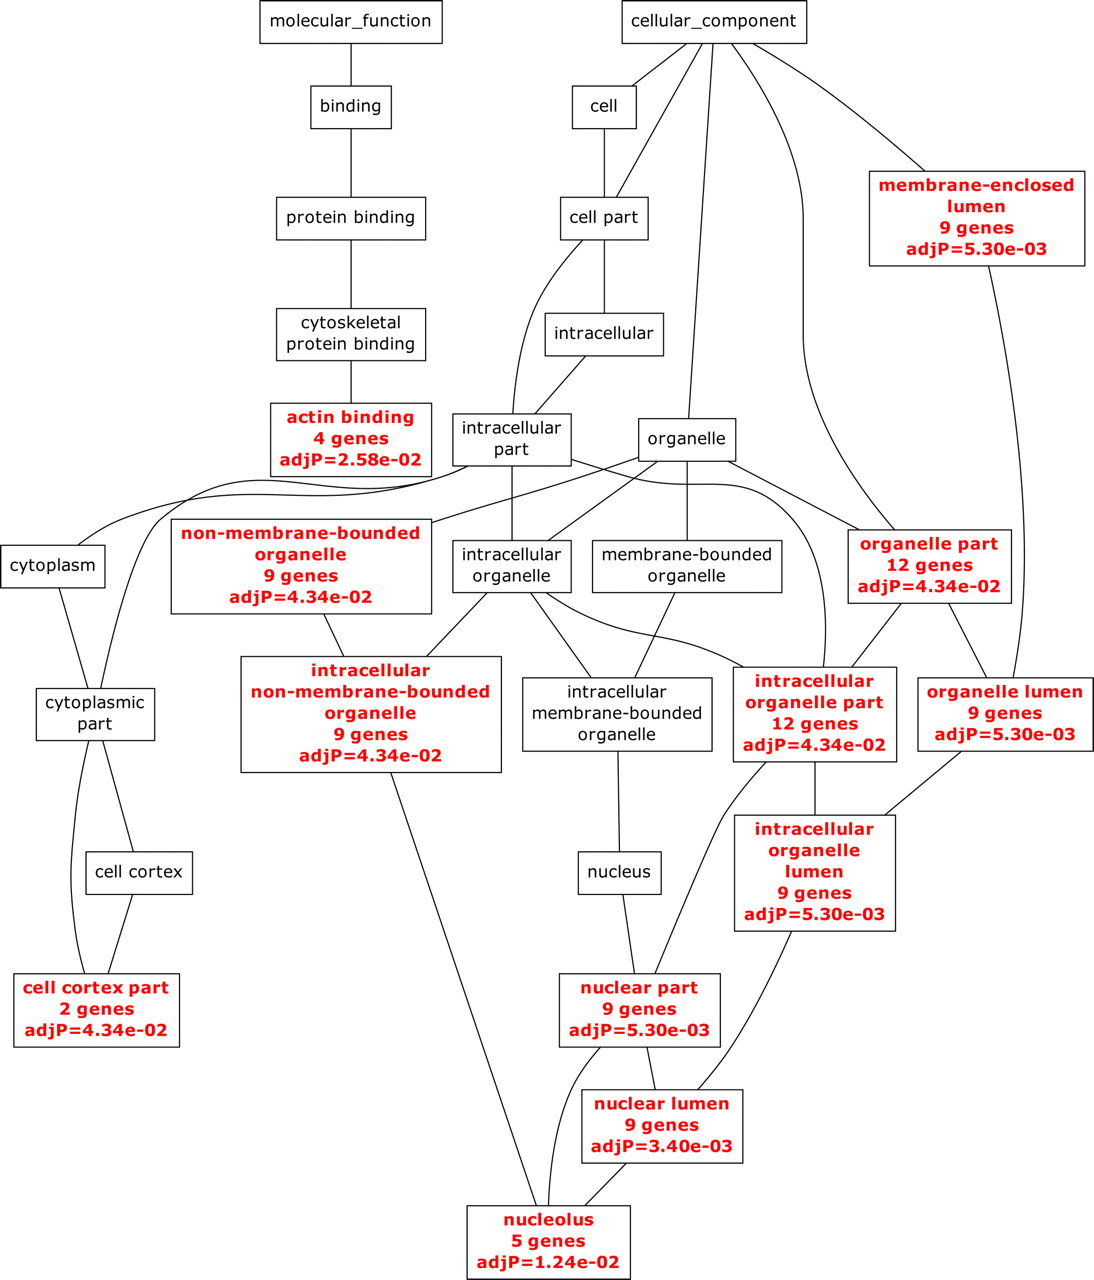
For this analysis, we used the same compiled list of 45 non-redundant genes as in Figure 1
Result of testing differntially expressed genes for miRNA target enrichment
For this analysis, we used the same compiled list of 45 non-redundant genes as in Figure 1
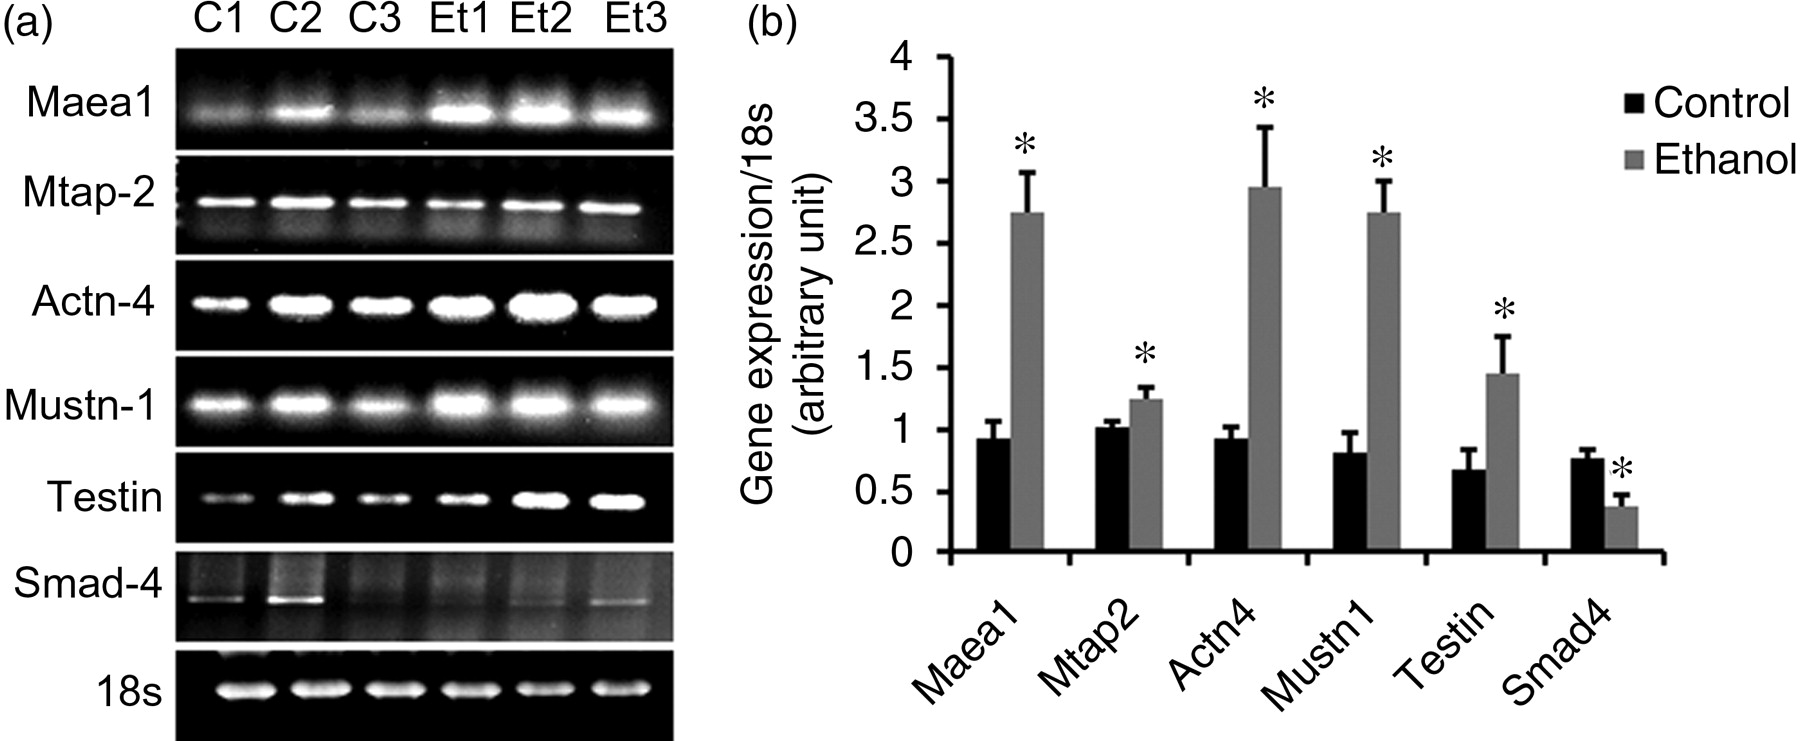
Polymerase chain reaction of genes selected from the cell migration and development category to verify microarray results. (a) Columns c1–c3 are from pair-fed animals and Et1–Et3 are from alcohol-fed animals. 18s is the internal control. (b) A graph of the gene expression versus 18s
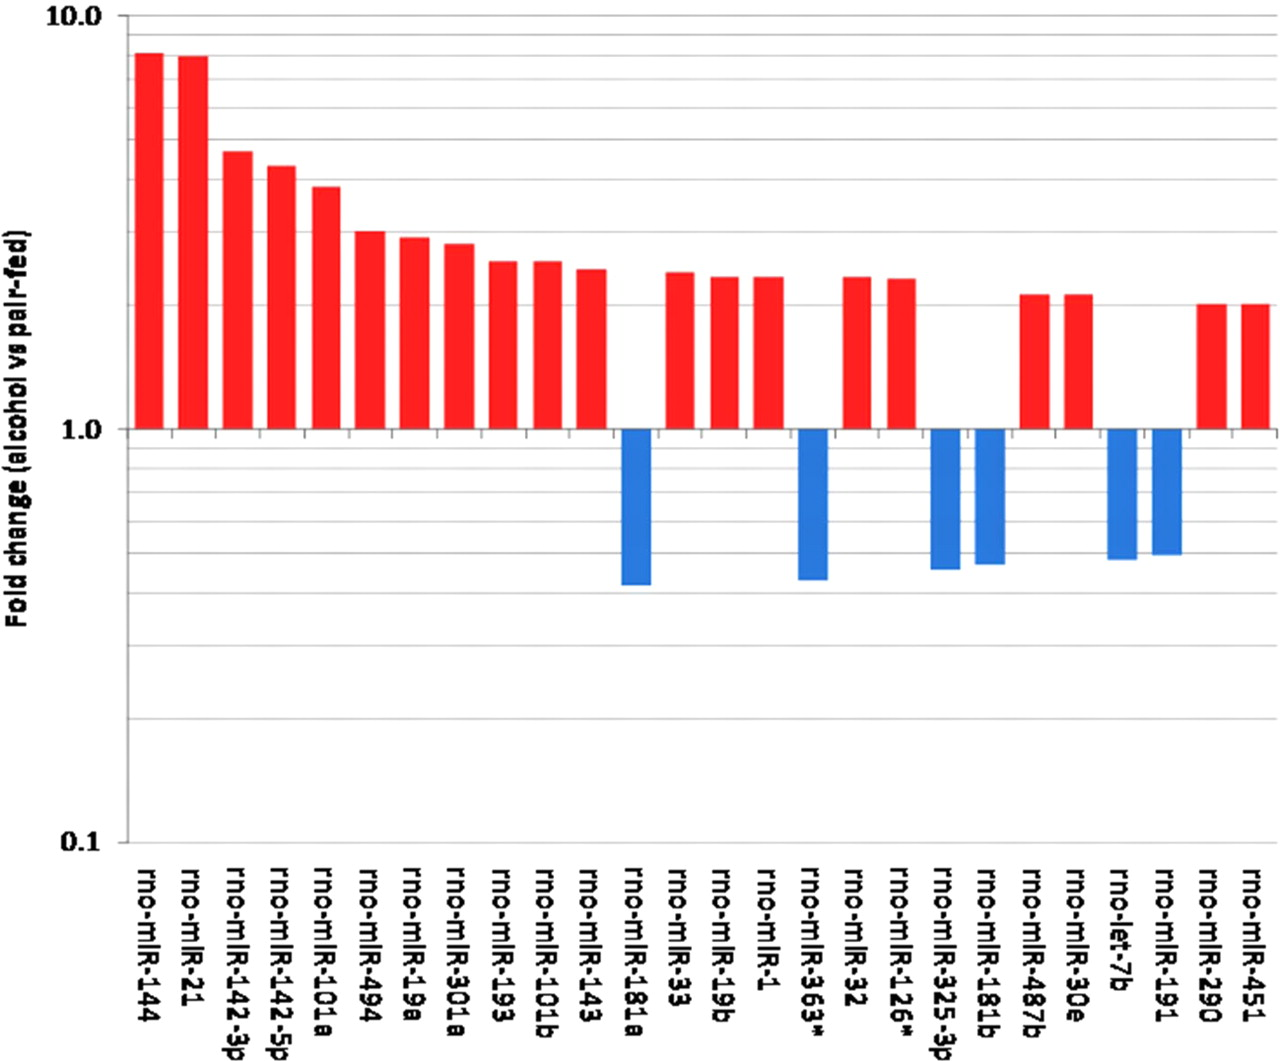
Differentially expressed miRNAs between alcohol and pair-fed rats. Each bar represents the fold change between the alcohol- and pair-fed animals. There are 20 miRNAs that are up-regulated in the alcohol-fed rats as indicated in red and six that were down-regulated as indicated in blue. *Statistical significance at P ≤ 0.05 using the paired t-test. Error bars = SEM
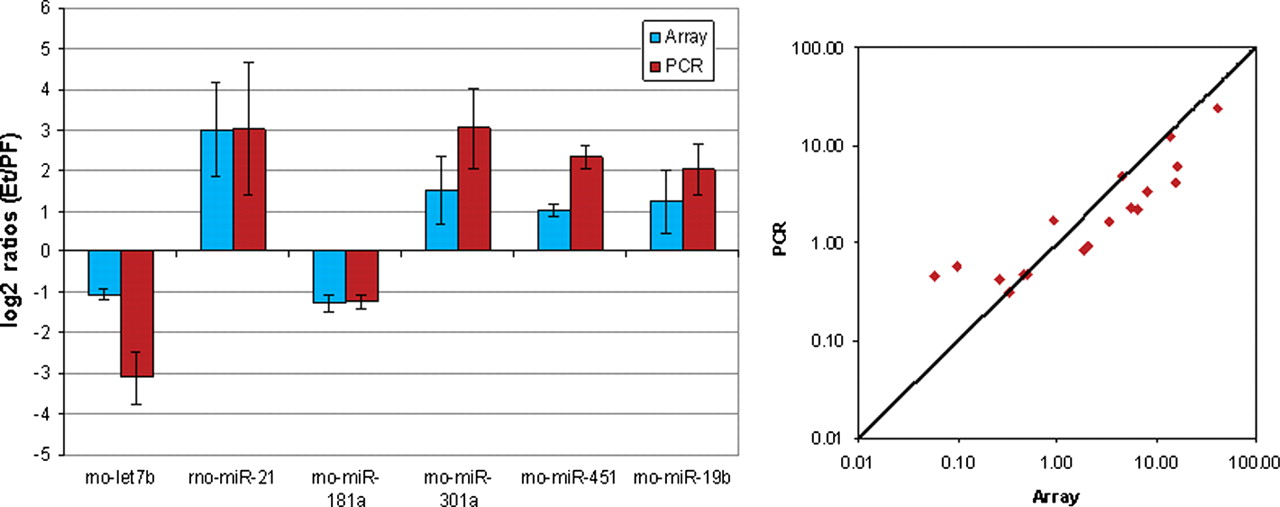
The diagram on the left gives the average relative expression between the two groups ‘Ethanol’ and ‘Pair-Fed’. Positive values indicate an up-regulation in ‘Ethanol’ and negative values indicate a down-regulation in ‘Ethanol’ compared with ‘Pair-Fed’. The relative expression is shown in log2 ratios and the error bars are SEM. The scatter plot on the right shows the agreement between array and quantitative polymerase chain reaction (qPCR) comparing the relative expression of array data with the relative expression of the qPCR data. The relative expressions are based on four technical replicates. The Pearson correlation of all samples and all miRNAs between array and qPCR is 0.939
Using a fold change of 2 or greater for average expression or a small P value (here P ≤ 0.01) is a common practice for identifying differentially expressed genes from microarray data. Because of the relatively small samples sizes used here, more stringent approaches would resist efforts for further analysis by producing smaller lists of differentially expressed genes. Although our approach thus has a heightened risk of producing false-positives, this risk is minimized by focusing attention on group-wise analysis in the form of GO enrichment, KEGG pathway enrichment and manual analysis of gene functional categories. These group-wise analyses are robust to individual false-positives, and we have applied stringent statistical criteria for the enrichment analyses (i.e. Bejamini-Hochberg-adjusted P values ≤0.05).
The major groupings identified with the mRNA expression microarray experiment were an increased expression of genes involved in the broad category of cell migration, a decreased expression of genes that regulate proliferation and an increase in genes related to development. Each of these groupings will be considered in the Discussion section below.
Discussion
Animal model studies of fracture healing of alcohol-consuming animals have been controversial 32–35 and have recently been extensively reviewed by Chakkalakal. 36 In an attempt to unravel the mechanisms involved with alcohol-induced inhibition of bone repair, Perrien et al. 37,38 demonstrated an elevation of tumor necrosis factor (TNF)-α and interleukin (IL)-1 in distraction osteogenesis and that an over-expression of IL-1 and TNF-α in alcohol-treated distraction osteogenesis fracture studies attenuated ethanol-induced inhibition of bone formation during distraction osteogenesis. These results were later duplicated in conventional transverse tibial fractures. 39 TNF-α was demonstrated to be expressed locally during fracture healing of chronic alcohol-consuming animals and to inhibit osteoblast proliferation. 38,40 These effects of ethanol were later duplicated for TNF, but not for IL-1. 41 A recent study 42 using demineralized allogeneic bone matrix cylinders showed that alcohol abuse resulted in decreased bone formation within the implant, suggesting a reduced osteoinduction. It is interesting that our study did not highlight the usual cytokines and growth factors such as those seen by Rundle et al. 25 to be needed for fracture repair as reviewed in the introduction, but it must be kept in mind that this study is focused solely on the effects of alcohol on the healing process and, moreover, focused on only the early stage of inflammation. Lauing et al. 43 recently demonstrated changes in the canonical Wnt signaling pathway, which increased during callus formation in the later stages of fracture healing and then subsided, but consistent with the present study, it did not appear to be involved in the early stage of inflammation. Our studies shed additional light on the identity of osteoinduction factors that are affected by alcohol, and divide these candidates into three broad categories: cell migration, proliferation and development.
Chemotaxis and cell migration
Genes associated with chemotaxis and migration
In addition to the altered transcription of protein-coding genes caused by alcohol during the inflammatory stage of fracture healing, more importantly, miRNAs reported to regulate inflammation and hematopoietic differentiation are also changed in the present study. MicroRNA-126 and miR-21 have been identified to have an association with vascular inflammation and leukocyte adherence to endothelial cells. 57 Others, such as miR-142-3p and 5p, miR-181a and b and miR-451 have been associated with immune function and hematopoietic differentiation. 58–61 Additional studies will be needed in order to unravel the relationship between the specific gene and miRNAs.
A matricellular protein, thought to be secreted by platelets and fibroblasts, 62 that was increased +1.3-fold during fracture healing of alcohol-consuming animals was thrombospondin-2 (Thbs2). Thbs2 is usually seen later in the wound healing process and has also been demonstrated to stimulate chemotaxis and diapedesis of T-cells and other leukocytes. 63 Interestingly, Thbs2 null mice appear to have accelerated wound healing, 64 and during glomerulonephritis, they have increased inflammation in the early stages of the disease. 65 Complementing this increase in inflammatory cell recruitment was our demonstration of the suppression (−2.6) of an anti-inflammatory gene 66,67 tyrosine kinase Fps/Fes. Many miRNAs associated with megakaryocyte differentiation, 68 such as Let-7b, miR-30e, miR-32, miR-101a, miR-126 and miR-181b, are altered during fracture healing of alcohol-consuming animals.
In addition to increased expression of chemotactic factors in three-day alcohol-influenced fracture healing, factors required for cytokinesis and motility were also observed. These include microtubule-associated protein 2 (Mtap2) (+1.7) which is involved in the stabilization and rearrangement of microtubules and actin filaments; 69 Actn4 (+1.2), a cytoskeletal associated protein implicated in the regulation of cell motility; 70 LIMAB1 (+1.4), an actin-binding protein; 71 and Nedd1 (+1.3) which functions in microtubule organization; 72,73 all of which might participate in the movement of leukocytes to the inflammatory site.
Other up-regulated genes related to microtubule polymerization, cell shape changes or migration that were seen in this study were ODC (+1.3), the first rate-limiting step in polyamine synthesis, which is required for microtubule formation during gastric mucosal healing 74 and Rohn (+1.6), which is involved in the organization of cytoskeletal components. Sytl5 (+1.5) is involved in exocytosis and Rab27-dependent membrane trafficking 75 as is Chic2 (+2.4). 76
This study demonstrated also proteins involved in cytokinesis and motility whose gene expression was down-regulated, such as Corolc (−1.4) which is an actin-binding protein involved in cell locomotion and whose absence strongly inhibited wound closure in wound healing assays, 77,78 and myosin-VIIb that is thought to play a role in linking the actin cytoskeleton to adhesion receptors on the cell surface 79,80 (−1.5). These data are consistent with decreased fracture healing as a consequence of alcohol consumption.
Proliferation
Genes associated with proliferation
Similarly, Let-7b, miR-21, miR-19a,b, miR-32 and miR-181a have been reported to be associated with cell cycle and multiple myeloma, 92–94 and miR-144, Let-7b and miR-19s have been reported to been involved in activation of caspase cascade and apoptosis, indicating that alcohol could possibly interfer with the regulation of cell cycle gene expression.
Development
Genes associated with development
Smad4 (−2.2) is a developmental gene whose expression is decreased during fracture healing in the present study with alcohol-treated animals, but is greatly increased during fracture healing of normal animals. 102 Smad4 (−2.2) interacts with phosphorylated Smad 1 or 5 and enters the nucleus to activate transcriptional machinery for early BMP response genes involved in cartilage and bone formation 102–104 or with Smad 2 or 3 to induce TGF-β for later stages of fracture healing. 102 Interestingly, Smad4 has been reported to be a target for miR-301a, which this study identifies as up-regulated. As a result, we observed a down-regulation of the Smad4 gene in the alcohol-treated rats. Interestingly, Mustn1 is also a target for miR-301a and we observed an up-regulation of the gene expression in the alcohol-treated rats. It will be a point of interest that under similar pathology, miR-301a is a negative regulator for Smad4 and a positive regulator for Mustn1 gene expression. The current finding becomes more intriguing since both these genes are regulating osteoinduction factors related to the development of the bone.
Figure 5 demonstrates alignment between Smad4 and miR-301a. Since miRNAs usually inhibit their target gene, this up-regulation of miR-143 is consistent with the down-regulation of the Smad4 gene. Since, Mtrr has been found to have a significant correlation with osteocalcin levels and bone turnover,
105
it is interesting that we found a 2.4-fold decrease in fracture healing of alcohol-consuming animals.
A sequence alignment between miR-301a and smad4 which has an alignment score of 151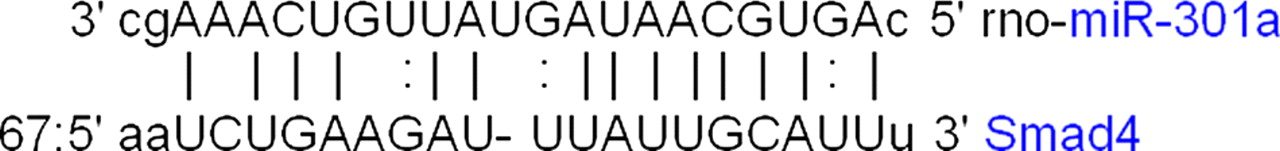
In summary, while it is recognized that mRNA levels may or may not represent protein levels successfully produced by the cell, these studies reveal changes in gene expression that support the hypothesis that alcohol consumption affects events involved with inflammation. MicroRNAs are known to modulate mRNA and confirmed much of what was seen with mRNA microarray analysis, especially the involvement of smad4 which was demonstrated by mRNA microarray, miRNA and PCR.
Footnotes
Acknowledgements
This study was supported in part by a grant from the Association Internationale pour Osteosynthese Dynamique (AIOD) and the Center for Bone, Joint and Spine Research, Department of Orthopedics, Scott and White Hospital, Temple, TX, USA. The authors express appreciation to Alaina C Dearman MS who isolated the RNA, and Usha Chowdhury MS and Hung-Chung Huang who ran the hybridizations.