
Abstract
The interferon-stimulated gene 15 (ISG15) pathway is highly elevated in breast cancer; however, very little is known about how the ISG15 pathway contributes to breast tumorigenesis. In the current study, using the gene disruption approach, we demonstrate that both ISG15 and UbcH8 (ISG15-specific conjugating enzyme) disrupt F-actin architecture and formation of focal adhesions in ZR-75-1 breast cancer cells. In addition, ISG15 and UbcH8 promote breast cancer cell migration. We also demonstrate that ISG15 inhibits ubiquitin/26S proteasome-mediated turnover of proteins implicated in tumor cell motility, invasion and metastasis. Together, our results suggest that the aberrant activation of the ISG15 pathway confers a motile phenotype to breast cancer cells by disrupting cell architecture and stabilizing proteins involved in cell motility, invasion and metastasis. Because the cellular architecture is conserved and the ISG15 pathway is constitutively activated in tumor cells of different lineages, it is reasonable to assume that our observations in breast cancer must hold true for many other tumors.
Introduction
ISG15 (interferon-stimulated gene 15 kDa) was originally discovered in 1979 by Farrell et al. 1 as an early interferon-stimulated gene (ISG) induced by type I interferons (interferon α [IFN-α] and IFN-β). 2 ISG15 protein was subsequently named ubiquitin cross-reactive protein (UCRP) due to its ability to cross-react with ubiquitin-specific antibodies. 2 Later, more comprehensive crystallographic and biochemical studies have revealed that ISG15 is composed of two ubiquitin homology domains, each of which contains the signature β-grasp fold found in ubiquitin and other ubiquitin-like proteins. 3 The tandem ubiquitin domains are connected by a short linker peptide. 3 Due to this close structural and sequence resemblance to ubiquitin, ISG15 has been categorized as the first member of the UBL superfamily of proteins. 4
ISG15 is synthesized as a 17-kDa precursor containing a C-terminal extension peptide. 5 Co-translational processing of this tail exposes the C-terminal Gly–Gly motif through which ISG15 is covalently conjugated to cellular proteins, a process referred to as ‘ISGylation’. 6 ISGylation occurs by a mechanism similar to that of ubiquitin, but using distinct enzymes. 7 UbE1L is an E1-like protein that catalyzes the ATP-dependent activation of the ISG15 carboxyl terminus. 8 UbcH8 is an ISG15-specific E2 conjugating enzyme that forms an obligate thiolester catalyzed by UbE1L. 9,10 Although several E3s have been identified as possible ISG15 E3 ligases, the major E3 for ISG15 appears to be HERC5. 11 However, the incomplete loss of the ISG15 conjugates in HERC5-ablated cells suggests that other ISG15 E3 ligases may contribute to the ISG15 conjugation in vivo. 11 ISGylation is reversible through the action of UBP43, a deISGylating enzyme for ISG15. 12 All ISG15 conjugating and deconjugating enzymes identified to date, like ISG15 itself, are strongly induced by type I interferons. 4 ISG15 is conjugated to a multitude of targets within the cell upon interferon stimulation. 7 These targets are involved in the majority of vital cellular functions, including DNA replication/repair, metabolism, apoptosis, signal transduction and cytoskeletal organization, among others, 13 suggesting that ISGylation regulates both cytoplasmic and nuclear functions.
ISG15 is also known to be secreted upon IFN treatment. 14 Early studies demonstrated that secreted ISG15 serves as an immunomodulatory cytokine. 14 As an extracellular cytokine, purified ISG15 can activate natural killer and cytotoxic T-cells, 15 stimulate IFN-γ production, 14 induce dendritic cell maturation 16 and neutrophil recruitment. 16 Other studies with Sindbis virus show that the conjugated form of ISG15 mediates its antiviral activity. 17 Together, these studies reveal that both conjugated and free ISG15 play an important role in innate immunity against viral infection (reviewed in ref. 18 )
Although ISG15 does not directly target proteins for 26S proteasome-dependent degradation, ISG15 promotes proteasomal degradation of PML/RARα. 19 In contrast, ISG15 appears to exert its biological effect by antagonizing ubiquitin-dependent targeting. 20 ISG15 inhibits the ubiquitylation of Gag and Tsg101 which prevents their interaction and blocks retroviral replication and release. 21 In addition, ISG15 inhibits Nedd4 ubiquitin ligase and, consequently, the ubiquitylation of VP40 viral particles essential for budding of Ebola viruses. 22 Furthermore, ISG15 inhibits ubiquitin-mediated degradation of interferon regulatory factor 3, a transcription factor involved in the interferon response, and enhances innate antiviral immunity. 23 ISG15 also inhibits camptothecin-induced, ubiquitin-mediated degradation of topoisomerase I in tumor cells. 24 Several groups have now demonstrated that ISG15 inhibits polyubiquitylation by modulating the activities of the ubiquitin E2 and E3 ligases (reviewed in ref. 13 ). Dysregulation of the ubiquitin ligases is, therefore, expected to decrease protein polyubiquitylation and the subsequent degradation of selected cellular proteins. Consistent with this idea, ISG15 inhibits polyubiquitylation and the subsequent 26S proteasome-mediated degradation of target proteins in breast cancer 20 and ataxia telangiectasia 25 cells.
Given the crucial role of the ubiquitin/26S proteasome pathway in normal cell homeostasis, one expects that ISG15-induced downregulation of the selected ubiquitin pathway might contribute to tumor cell viability. Indeed, considerable evidence implicates ISG15 in tumorigenesis.
4
Early studies from our laboratory demonstrated that ISG15 is highly elevated in breast cancer cells.
20
More comprehensive studies from Bektas et al.
26
demonstrated that both ISG15 mRNA and protein concentrations are increased in human breast cancers. Furthermore, the Oncomine™ Cancer Profiling Database (
Materials and methods
Cells
A ZR-75-1 (ZR) breast cancer cell line used for making shRNA clonal cells was obtained from ATCC (Manassas, VA, USA). ZR/control, ISG15 and UbcH8 shRNA stable transfectants are described in ref. 24 All cell lines were routinely monitored for any changes in the morphology, growth curves and bacterial contamination using the ToxinSensor™ Chromogenic Assay Kit (GeneScript Corp, Piscataway, NJ, USA).
Construction of lentiviral ISG15 shRNA stable transfectants
Preparation of lentiviral particles and infection
Five shRNA constructs (TRCN0000007420-5) for the ISG15 in a pLKO1 vector and one control non-targeting shRNA lentiviral vector (SHC002V) were purchased from Sigma Aldrich (Sigma, St Louis, MO, USA). Among the five shRNA constructs tested, TRCN0000007422 NM_005101.1-295S1C1 shRNA that showed efficient ISG15 knocked down (>75%) in ZR-75-1 cells was used for the production of lentiviral particles. Lentiviral particles were generated by transfecting HEK293T cells with the lentiviral shRNA vector (pLKO.1-Puro harboring ISG15 or SHC002V vector harboring control shRNA), together with the packaging (psPax2) and an envelope (pMD2.G) vectors (Addgene, Cambridge, MA, USA), using a standard calcium phosphate precipitation as described in ref. 27 Six to eight hours’ post-transfections, cells were washed once and replenished with the fresh Dulbecco's modified Eagle's medium, and allowed to grow for an additional 48 h. The viral supernatants were then harvested and filtered through a 0.45-μm pore size filter.
Transduction of ZR-75-1 cells
ZR-75-1 cells (65,000 cells/mL) were plated in a six-well tissue culture plate 24 h prior to the viral infection. The next day, culture medium was replaced with 1 mL of fresh medium containing 6.5 μg/mL of polybrene (Chemicon International, Temecula, CA, USA). Cells were infected with lentiviral particles containing ISG15 or control shRNA and incubated in a tissue culture incubator overnight. After 12 h of incubation, all transduced cells were replenished with the fresh culture media without polybrene. Two days’ post-transduction, cells were split (1:5) and allowed to grow under normal conditions (37°C and 5% CO2). Selection medium that contained 6.5 μg/mL puromycin dihydrochloride (Sigma) was then added to the cells 48 h after re-plating. Individual colonies were picked following five weeks of puromycin selection and screened for ISG15 expression by Western blotting analysis using anti-ISG15 antisera.
Transient knockdown of ISG15 with small interfering RNA
Silencing of the ISG15 gene using ISG15-specific small interfering RNAs
Immunoblotting and immunostaining
Cells were grown on either glass or nanofiber-coated glass coverslips in 12-well cell culture plates as described. 28 Cells were fixed in 4% paraformaldehyde and stained for F-actin with phalloidin-Alexa Fluor 488 (1:100; Sigma), anti-vinculin (1:200; hVin-1; Sigma) or E-cadherin (Santa Cruz Biotechnology, Inc, Santa Cruz, CA, USA) for 1 h. After washing with phosphate-buffered saline (PBS), cells were incubated with anti-mouse secondary IgG Cy3 (1:200) for vinculin. All cells were then mounted on slides in antifade mounting medium with DAPI (Invitrogen, Carlsbad, CA, USA), and then viewed by means of a Carl Zeiss fluorescent microscope (Axiovert 405 M; Carl Zeiss, Thornwood, NY, USA). The phalloidin images were captured with Kodak Pro 400 film (Kodak, Rochester, NY, USA) using a Nikon camera (Nikon, Melville, NY, USA). Acinar F-actin confocal imaging was done with a Zeiss LSM-410 microscope (Carl Zeiss MicroImaging, Thornwood, NY, USA), and vinculin images were acquired with a Leica DMRA2 upright microscope run through SlideBook software (Intelligent Imaging Innovations, Denver, CO, USA).
Cell migration and invasion assays
Cell migration by scratch wound healing was done as described in ref. 29 An electrical cell-substrate impedance sensing (ECIS) assay for cell migration was carried out as described in ref. 30 CytoSelect™ 24-well cell migration assay was done in accordance with the manufacturer's protocol (Cell Biolabs, San Diego, CA, USA).
Results
Elevated expression of ISG15 disrupts tumor cell architecture
The ISG15 pathway is over-expressed in a variety of tumors and transformed cell lines.
20,26
However, whether the elevated ISG15 pathway is causally related to tumorigenesis is not known and, hence, is investigated. There were two options to examine the contribution of the ISG15 pathway in breast tumorigenesis: (1) to test if the downregulation of the ISG15 pathway (by gene disruption) could revert transformed phenotypes of breast cancer cells; or (2) to test if the over-expression of the ISG15 pathway could transform normal mammary cells. We opted to use the gene disruption approach for the following reason: we have previously demonstrated that the ISGylation (ISG15 conjugation) is essential for antagonizing ubiquitylation.
20
Conjugation of ISG15 requires the cooperative activity of three enzymes; UbE1L (E1-ISG15), UbcH8 (E2-ISG15) and one of the several E3-ISG15 ligases.
7
Therefore, to test whether ISG15 conjugation transforms normal cells, there would need to be concomitant expression of E1, E2, E3 and ISG15 (since ISG15 pathway is not constitutively elevated in normal cells
20
) in normal mammary cells. However, the ISG15-specific E3 ligase(s) involved in tumorigenesis is unknown. Therefore, the over-expression of the ISG15 pathway in normal cells was not feasible. We therefore silenced ISG15 expression in ZR-75-1 breast cancer cells. As shown in Figure 1a, left upper panel, the expression level of ISG15 in ZR-75-1 cells treated with ISG15-specific siRNA was significantly reduced as compared with that in ZR-75-1 cells treated with control siRNA (>80%; as quantified by using the Kodak Image Station 2000R) (extreme left panel). Transient transfection of a siRNA specific to ISG15 resulted in distinct morphological changes in ZR-75-1 breast cancer cells (Figure 1). As shown in Figure 1a, ZR-75-1 cells transfected with control siRNA retained their original shape and ability to grow in multiple layers, a characteristic of transformed tumor cells. On the other hand, ISG15-silenced ZR-75-1 cells exhibited a flattened and spread morphology, a characteristic of most non-transformed normal cells (Figure 1a, right upper panel). In addition, ISG15 siRNA-transfected cells stained with phalloidin showed extensive actin polymerization and formation of actin stress fibers (see arrow in Figure 1a, right lower panel). In contrast, ZR-75-1 cells transfected with control siRNA and stained with phalloidin showed few actin stress fibers and disorganized actin polymerization (Figure 1a, left lower panel). The most striking signs of the transformed phenotypes are the severe disruption of the actin cytoskeleton and alteration of the cell morphology.
29,31
The extensive actin polymerization and altered cell morphology of ISG15 siRNA-treated ZR-75-1 cells thus indicated that elevated ISG15 disrupts the cellular architecture of breast cancer cells.
Silencing of ISG15 expression altered cell morphology of ZR-75-1 breast cancer cells. (a) Breast cancer ZR-75-1 cells were transiently transfected with a control siRNA (left panels) or ISG15 (right panels) siRNA. Cells were photographed 72 h after siRNA transfection (upper panels). Seventy-two hours after transfection with control (left lower panel) or ISG15 (right lower panel) siRNA, ZR-75-1 cells were stained with phalloidin for F-actin. Representative confocal microscope images of phalloidin-stained cells are shown. To confirm the effectiveness of ISG15 siRNA in knocking down the ISG15 expression in ZR-75-1 cells, duplicate plates of ZR-75-1 cells identically grown and transfected with ISG15 and/or control siRNA were lysed and processed for Western blot analysis using anti-ISG15 antibodies (extreme right panel). The same membrane shown in the upper panel was stripped and re-probed using anti-tubulin antibody (lower panel). The experiment was repeated two times with reproducible results; scale bars 10 μm. (b) Representative fluorescence images of phalloidin-Alexa Fluor-stained ZR/control- (first panel) and ISG15-shRNA 1 (second panel) clonal cells grown on the glass cover slips (two-dimentional) are shown. The bar graph shows the cell size (area) measured using ImageJ software from captured pictures (error bars represents ± SEM) (third panel); scale bars 10 μm. (c) Representative fluorescence images of phalloidin-Alexa Fluor-stained ZR/control- (left panel) and ISG15-shRNA 1 (right panel) clonal cells grown on the nanofiber-coated (three-dimensional) cover slips are shown; scale bars 10 μm. (d) A series of confocal sections (from top to bottom) of multicellular spheroid (acini) composed of ZR/ISG15-shRNA 1 clonal cells grown on nanofibers and stained with phalloidin-Alexa Fluor are shown. Note the lumen extending through the acini. Confocal analysis of acini formed on nanofibers was repeated two times; scale bars, 10 μm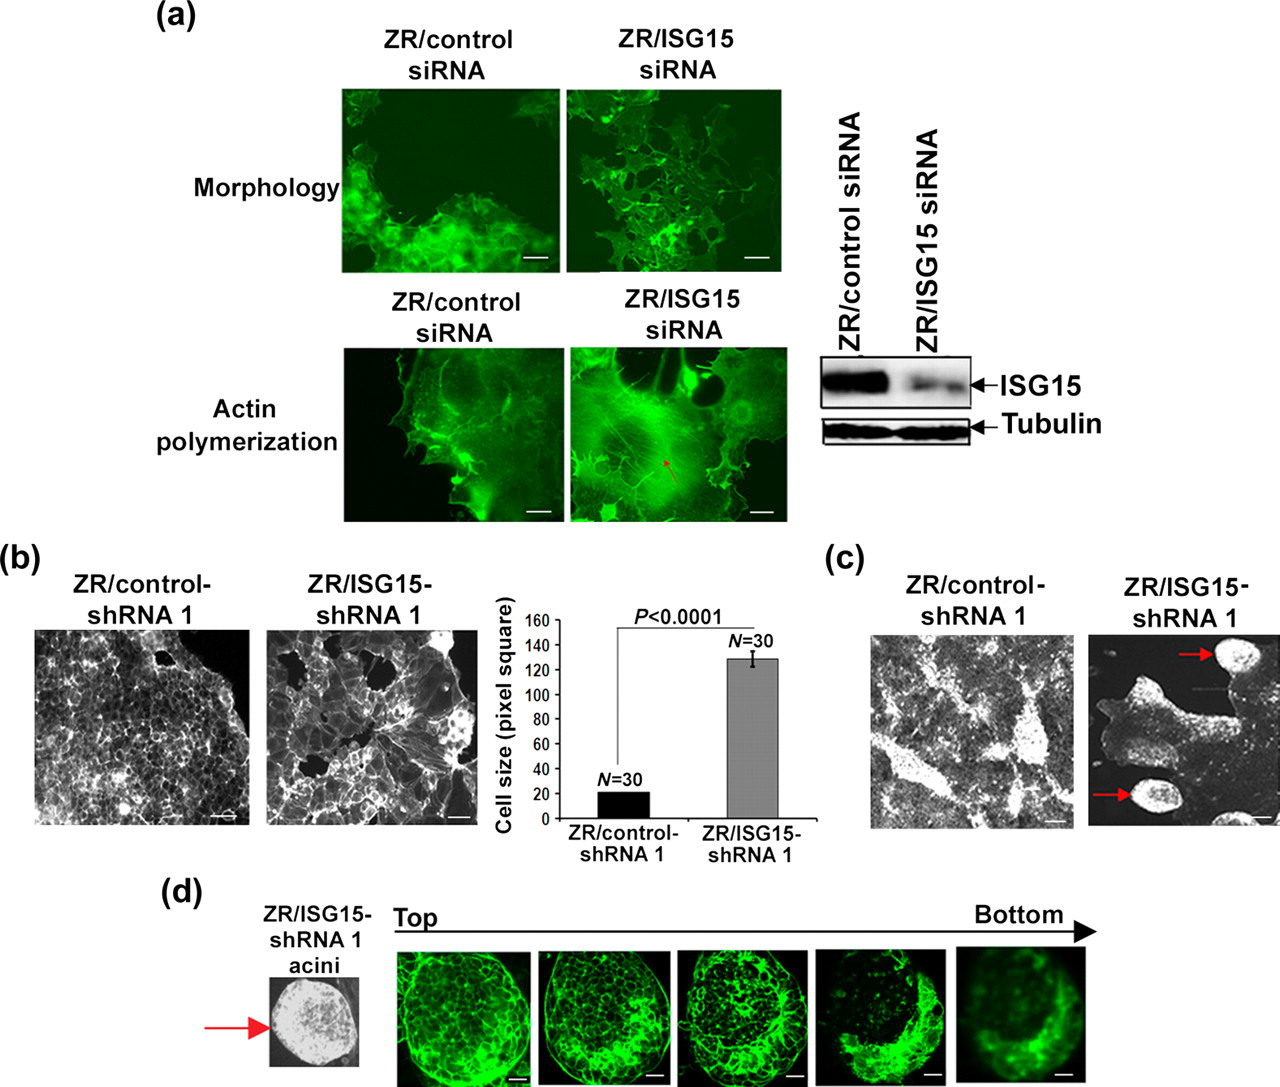
To further examine the effects of ISG15 on cellular architecture, we tested previously generated ZR-75-1 clonal cell lines stably expressing ISG15 and control shRNA (ZR/control-shRNA 1 and ZR/ISG15-shRNA 1 described in ref. 24 ). Since attenuation of ISG15 levels by transient expression of ISG15 siRNA displayed morphological changes (Figure 1a), we examined the morphology of ZR/ISG15- and control-shRNA 1 cells grown on glass cover-slips (two-dimensional culture) by phase-contrast microscopy (Figure 1b). We observed similar but more obvious morphological changes in ZR/ISG15-shRNA 1 clonal cells than those observed in ZR-75-1 cells transiently transfected with ISG15 siRNA (Figure 1b). As shown in Figure 1b, first panel, the ZR/ISG15-shRNA 1 cells were large and flattened, whereas ZR/control-shRNA 1 cells (second panel) retained the elliptical shape characteristic of wild-type ZR-75-1 breast cancer cells. The bar graph shows the cell size (area) measured using ImageJ software (NIH, Bethesda, MD, USA) from captured pictures (error bars represents ± SEM) (third panel).
We also cultured ZR/control- and ISG15-shRNA 1 cells on a three-dimensional nanofibrillar surface composed of electrospun polyamide nanofibers. These fibers mimic the topology and physical structure of the extracellular matrix or basement membrane. 28 In addition to increased spreading (data not shown), cultured ZR/ISG15-shRNA 1 cells showed rounded morphology resembling that of typical mammary acinar cells (Figure 1c). Confocal fluorescence microscopic analysis of these rounded structures (see arrow) showed a hollow lumen surrounded by a single layer of cells, as is characteristic of mammary acini (Figure 1d). 32 In contrast, ZR/control-shRNA 1 cells did not form acini on three-dimensional cultures, but instead generally grew as disorganized aggregates (Figure 1c, left panel). Acini formation is a hallmark phenotype of normal breast cells. 32 Thus, our results suggest that ISG15 knockdown leads to reversion of the malignant phenotypes of breast cancer cells.
Like ZR-75-1 cells transiently expressing ISG15 siRNA, ZR/ISG15-shRNA 1 clonal cells stably expressing ISG15 shRNA also showed extensive polymerization of actin with phalloidin staining and formation of actin stress fibers (Figure 2a, left and right [higher magnification] lower panels). In contrast, ZR/control-shRNA 1 cells showed little staining with phalloidin (Figure 2a, left and right [higher magnification] upper panels). The bar graph (Figure 2b) shows the intensity of actin staining in ZR/control- and ISG15-shRNA cells measured using ImageJ software (error bars represents ± SEM).
Stable expression of ISG15 shRNA induces actin polymerization in ZR-75-1 breast cancer cells. (a) Representative confocal microscope images of phalloidin-stained ZR/control-shRNA 1 cells are shown in the upper left and right (higher magnification) panels. Representative confocal microscope images of phalloidin-stained ZR/ISG15-shRNA 1 cells are shown in the lower left and right (higher magnification) panels. The levels of ISG15 in ZR/control- and ISG15-shRNA 1 cells are shown in the extreme right panel. Two independent experiments gave reproducible results; scale bars, 10 μm. (b) The bar graph shows the intensity of actin staining in ZR/control- and ISG15-shRNA cells measured using ImageJ software (error bars represents ± SEM). (c) Representative phase contrast images of ZR/LV-control (left panel) and ISG15- (right panel) shRNA cells are shown to depict altered cell morphology; scale bars 10 μm. (d) Cell–cell junctions in ZR/LV-control- (left panel) and ISG15- (right panel) shRNA 1 cells were visualized using an anti-E-cadherin antibody. Both images were taken using fixed exposure time; scale bar 10 μm. (e) Actin polymerization in ZR/LV-control-shRNA 1 (first panel), ISG15-LV-shRNA 1 (second panel) and ISG15-LV-shRNA 2 (third panel) cells was visualized using phalloidin (left panels), and phalloidin and DAPI (right panels) (see red arrows for actin fibers). Representative fluorescence images are shown; scale bars, 10 μm. The levels of ISG15 in ZR/control- and ISG15-shRNA clonal cells are shown in the right panel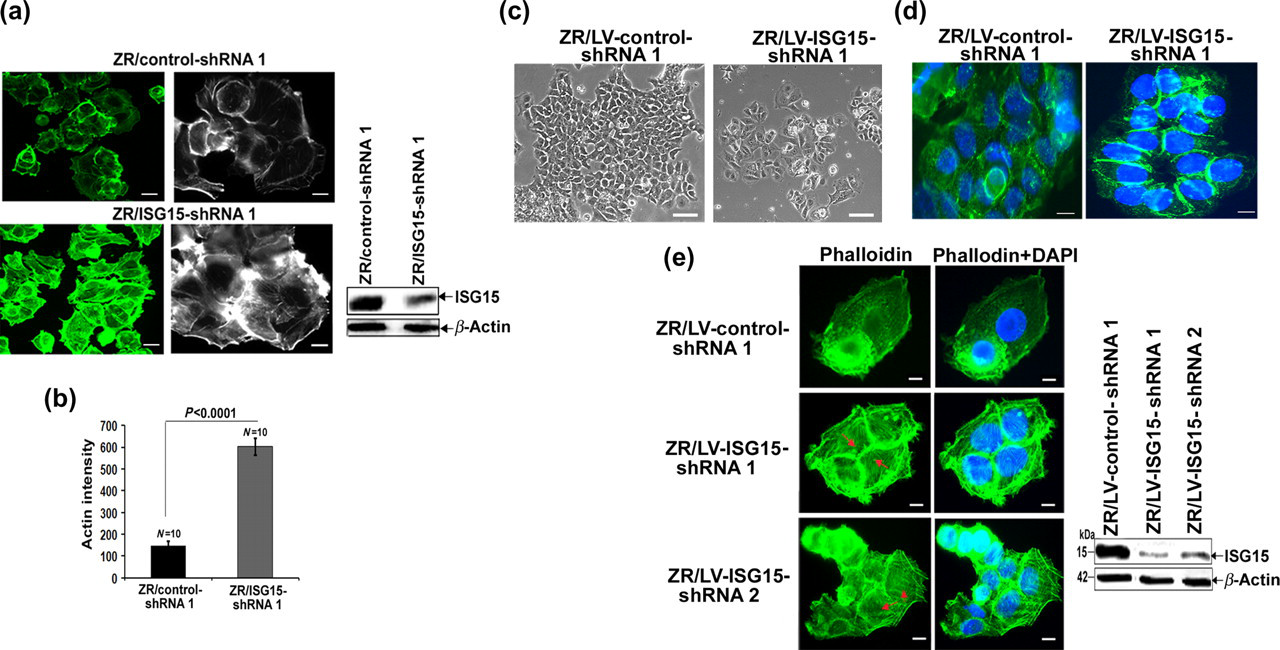
To rule out the possibility that the effect of the ISG15 shRNA on actin polymerization is not an off-target effect, we generated lentiviral particles expressing a distinct ISG15 shRNA (Sigma TRCN0000007422 NM_00501.1-1631C1) targeting a different region of the human ISG15 gene and control (Sigma SHC002-non-target shRNA) shRNA. ZR-75-1 cells were transduced with the lentiviral particles and the stable clones of ZR-75-1 expressing ISG15 (ZR/LV-ISG15-shRNA 1 and 2) and/or control shRNA (ZR/LV-control-shRNA 1) were selected as described in the Materials and methods section. The expression level of ISG15 in ZR/LV-control-shRNA 1 and ZR/LV-ISG15- shRNA 1 and 2 clonal (two distinct clones) cells is shown in Figure 2e, extreme right panel. The reduced levels of ISG15 confirmed the effectiveness of ISG15 shRNA in knocking down ISG15 gene expression in ZR/LV-ISG15-shRNA 1 and 2 cells (extreme right panel). Similar to ZR/ISG15-shRNA 1 cells, ZR/LV-ISG15-shRNA 1 cells, in general, also exhibited large and flattened morphology (Figure 2c, right panel). On the other hand, ZR/control-shRNA 1 cells retained the elliptical shape characteristic of wild-type ZR-75-1 (Figure 2c, left panel). In addition, E-cadherin, a marker of cell–cell junctions, was found to be very densely and distinctly expressed at cell–cell contacts in ZR/LV-ISG15-shRNA cells (Figure 2d, right panel). In contrast, in ZR/LV-control-shRNA cells, E-cadherin was only marginally localized to cell–cell interfaces, with the majority of expressions occurring throughout the cytoplasm (Figure 2d, left panel). These results revealed that ISG15 silenced ZR-75-1 cells form highly organized cell–cell junctions. As shown in Figure 2d, the left panel, ZR/LV-ISG15-shRNA 1 and 2 cells stably expressing TRCN0000007422 ISG15 shRNA (Sigma) also showed extensive polymerization of actin with phalloidin staining and formation of actin stress fibers as compared with the ZR/LV-control-shRNA 1 cells (second and third panels). These results are thus consistent with the results obtained with transient transfection of ISG15 siRNA shown in Figure 1 and in ZR-75-1 clonal cells stably expressing distinct ISG15 shRNA shown in Figure 2a. Together, the F-actin content seemed to be less structured, and cell morphology is altered in ZR-75-1 cells expressing control shRNA (over-expressing ISG15) than in ZR-75-1 cells stably expressing ISG15 shRNA (expressing low levels of ISG15).
The extensive actin polymerization and altered cell morphology of ISG15-silenced ZR-75-1 cells indicated that elevated ISG15 disrupts the cellular architecture of breast cancer cells. The observed changes in actin polymerization (Figures 1 and 2) prompted us to examine focal adhesion morphology in ZR/control- and ISG15-shRNA 1 cells. As shown in Figure 3a, ZR/control-shRNA cells displayed small punctate focal adhesions at the cell peripheries using anti-vinculin antibodies (Figure 4a, upper panel, see red arrow in vinculin-stained image and a larger view). In contrast, ISG15 knockdown cells had large elongated focal adhesions at both the central and peripheral regions, which co-localized with the ends of actin fibers (Figure 3b, lower panel, see red arrows in vinculin-stained image and a larger view). The focal adhesion area and total number of focal adhesions counted (N) are shown in Figure 3c. A two-fold increase in focal adhesion area, indicating the presence of large focal adhesions, was found in ZR/ISG15-shRNA cells (see bar graph in panel c). The levels of vinculin protein as judged by Western blotting were almost the same in both ZR/control and ISG15 knockdown ZR-75-1 cells, indicating an increase in focal adhesion formation rather than increased vinculin expression (Figure 3d). Together, the results shown in Figures 1
–4 revealed that ISG15 over-expression leads to disorganization of cell architecture by disruption of actin polymerization and focal adhesions.
ISG15 shRNA stimulates formation of focal adhesions in ZR-75-1 breast cancer cells. (a and b) Focal adhesions in ZR/control- (upper panel) and ISG15- (lower panel) shRNA 1 cells were visualized using an anti-vinculin antibody (red color). The larger views of ZR/control- and ISG15-shRNA cells are shown in the extreme right panels; scale bars, 10 μm. (c) Digital images of the vinculin channel were masked and segmented with tools in SlideBook. Mask statistics were extracted and manually filtered by comparing each object to the corresponding pixel values. This step allowed determination of individual focal adhesion, thereby avoiding the inclusion of coalesced adhesions. The data were then exported to GraphPad Prism for statistical analyses using a Student's t-test. Values represent average area of focal adhesions (in μm2); ‘N’ represents the number of individual focal adhesions (FAs) measured from vinculin-stained digital images. (d) Cell lysates of ZR/control- and ISG15-shRNA 1 cells were analyzed for vinculin protein expression using an anti-vinculin antibody in a Western blot analysis ISG15 promotes breast cancer cell migration. (a) To assess cell migration by the ‘scratch’ wound assay, wounds were created by scraping confluent monolayers of cultured ZR/control- and ISG15-shRNA 1 cells in 60-mm culture dishes. The scratched monolayer cultures were photographed under phase contrast microscope after various times. The experiment was repeated two times on different days with similar results. (b) For the electrical cell-substrate impedance sensing wound healing assay, ZR/ISG15- and ZR/control-shRNA 1 cells were grown to confluence on the surface of culture dishes with gold film electrodes as described in Experimental procedures. Electrical resistance across the cell layers before and after applying electrical current (2.5 V, 40,000 Hz alternative current for 10 s) was measured. Normalized resistance versus time plot (left panel) and mean recovery time (right panel) (from two different experiments run in duplicates) are shown. (c) Cell migration was examined using a CytoSelect™ 24-well cell migration assay kit according to the manufacturer's protocol. The experiment was repeated two times and samples were analyzed in duplicate (error bar represents ±SEM)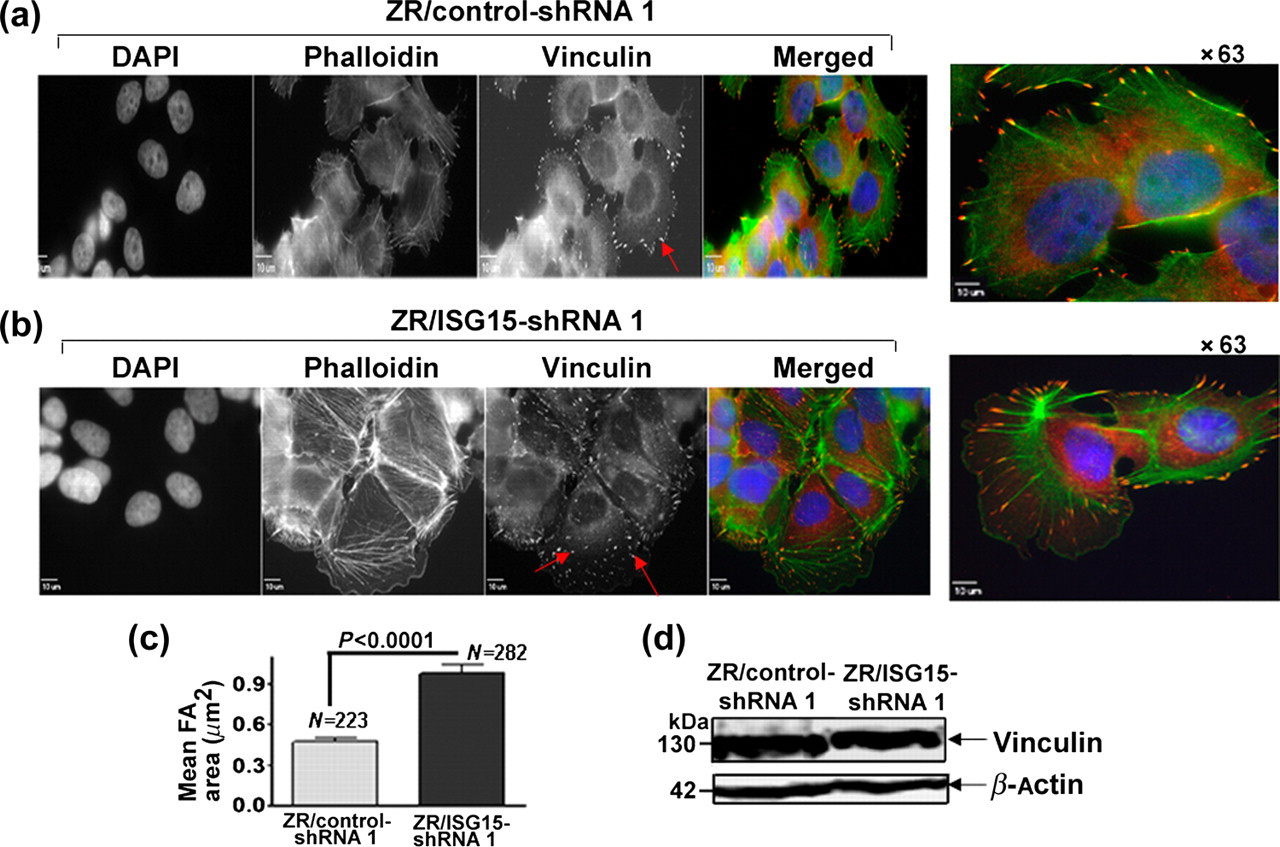

ISG15 confers a motile and invasive phenotype to breast cancer cells
The formation of stable, mature focal adhesions tethered to actin stress fibers is a prerequisite for cell spreading and migration. 33 Extensive re-modeling of the actin cytoskeleton in ISG15-silenced ZR-75-1 cells (Figures 1–3) prompted us to determine the functional impact of ISG15 on cell migration. To examine the effect of ISG15 on cell migration, we used three complimentary model systems: the CytoSelect™ 24-well cell migration assay, and two wound healing assays, a traditional ‘scratch’ assay 34 and another using an ECIS. 30 In the ‘scratch’ wound healing assay, a scratch was introduced to the cell monolayer by a pipette tip. The cells were allowed to migrate to the wounded gap and images were taken by a phase contrast microscope. The result of the wound-healing assay is shown in Figure 4a. The wound closure in ZR/ISG15-shRNA 1 was significantly slower than that of ZR/control-shRNA 1 at 48 h (Figure 4a, upper and lower panels). Decreased cell migration of ZR/ISG15-shRNA cells is not due to decreased cell proliferation, as these cells proliferated at the same rate as the ZR/control-shRNA cells. ImageJ software was used in order to measure the distance between the wound edges. Three vertical lines at semi-random horizontal distances were drawn and the distances between the intersections of the lines with the wound edges were measured using ImageJ software as described by Adams. 35 The average of the ‘wound widths’ was used to calculate the % wound healing at 48 h. The healing area of control cells reached 100% in 48 h, while ZR/ISG15-shRNA 1 cells showed only 30% wound healing in the same time frame (see black horizontal lines for the ‘wound widths’).
The slower migration of ZR/ISG15-shRNA 1 cells observed in the scratch wound healing assay was further confirmed by the ECIS wound healing assay (Figure 4b), which replaces the traditional ‘scratch’ assay. Instead of disrupting the cell layer mechanically with a pipette tip and following the migration of cells to ‘heal’ the wound with a microscope, this technique involves electric signals to both wound and also monitor the healing process, which is recorded using Electrical Cell-Substrate Impedance Sensor Model 1600R (Applied BioPhysics, Troy, NY, USA). Briefly, this device measures a non-invasive alternative current current as it flows through the culture medium. As cells attach and spread on the surface of the electrodes, the current is impeded, resulting in high resistance that is then recorded by the instrument.
30
For the ECIS wound healing assay, ZR/ISG15- and ZR/control-shRNA 1 cells were grown to confluence on the surface of culture dishes with gold-film electrodes. After 24 h, an elevated field was applied (at the arrow), wounding the cells on the small electrode. As shown in Figure 4b, left panel, the application of this electric field resulted in a very rapid drop in the resistance of cell layers associated with the cell-free electrode (see arrow). In the next few hours, this resistance increased back to levels of the initial cell-covered electrode (see resistance curves), due to the migration of cells from the perimeter of the electrode inward to replace the killed cells (healing). As seen in Figure 4b, left panel, the resistance curve for ZR/control-shRNA 1 cells returned above the starting value within 13 h after receiving the electric pulse (see Figure 5b, left panel for resistance and right panel for mean recovery time of wound healing). On the other hand, the ZR/ISG15-shRNA resistance curve failed to reach the starting value even 24 h after receiving the electrical pulse (see Figure 4b, left panel for resistance and right panel for the mean recovery time of wound healing). Thus, the ECIS data demonstrate that the time required for the healing phase, determined by the rate of cell migration (reflected in the slopes of the data in Figure 4b), is much longer for ZR/ISG15-shRNA 1 cells (>24 h) compared with ZR/control-shRNA 1 cells, which showed complete healing within 13 h. These results and those of the scratch wound assays are thus in agreement.
ISGylation disrupts breast cancer cell architecture. (a) Representative confocal microscope images of phalloidin-stained ZR/control-shRNA 1 and 2 (left upper and lower panels) and UbcH8-shRNA 1 and 2 (right upper and lower panels) cells are shown; scale bars, 10 μm. (b) Focal adhesions (FA; red color) tethered to the actin filaments (green color) in ZR/control- (left panel) and UbcH8- (right panel) shRNA 1 cells were visualized using an anti-vinculin antibody and phalloidin (with DAPI); scale bars, 10 μm. The statistical calculation to show a mean area of focal adhesions (± SEM) was done as described in Figure 3c (right panel)
The potential effect of ISG15 on cell migration was further assessed using the CytoSelect™ 24-well cell migration assay. In this assay, ZR/ISG15-shRNA 1 cells migrated through the 8-μm membrane pores two-fold more slowly than did ZR/control-shRNA 1 cells in eight hours (Figure 4c, compare bars 1 and 2). Together, these results indicate that the elevated ISG15 pathway contributes to cell motility.
ISGylation disrupts breast cancer cell architecture and migration
ISG15 has two functions, one as a post-translational modifier of cellular proteins (ISGylation [ISG15 conjugation]) and the other as a secretory immune cytokine.
15
Because previous data do not address whether free ISG15 or ISG15 conjugates contribute to tumor cell re-organization and increased cell motility, we employed previously generated ZR-75-1 cells stably expressing UbcH8 (the ISG15-specific E2 essential for ISG15 conjugation) shRNA (ZR/UbcH8-shRNA 1 and ZR/UbcH8-shRNA 2 cells are described in ref.
24
). Similar to ZR/ISG15-shRNA 1 cells, ZR/UbcH8-shRNA 1 and 2 clonal cells stably expressing UbcH8 shRNA also showed extensive polymerization of actin with phalloidin staining (Figure 5a) reminiscent of the parallel observation of ISG15 knockdown (Figures 1 and 2). We then examined the status of focal adhesions in the ZR/UbcH8-shRNA 1 cells. Similar to ZR/ISG15-shRNA 1 cells (Figure 3), ZR/UbcH8-shRNA 1 cells had large elongated focal adhesions (see vinculin staining [red color] and arrows) at both the central and peripheral regions, which co-localized with the ends of actin fibers (see phalloidin staining [green color]) (Figure 5b, left panel). In addition, ZR/UbcH8-shRNA 1 cells also showed significant increase in focal adhesion area (indicating the presence of large focal adhesions) as compared with ZR/control-shRNA 1 clonal cells (see the bar graph for the quantitation). A similar increase in focal adhesion area was observed in ZR/UbcH8-shRNA 2 clonal cells (Desai et al., unpublished data). Moreover, both ZR/UbcH8-shRNA 1 (Figure 6a, right panels) and 2 (data not shown) cells also showed decreased rates of migration as compared with the ZR/control-shRNA 1 (Figure 6a, left panel) and 2 (data not shown) cells using the scratch wound healing and ECIS (Figure 6b) assays. As shown in Figure 6a, the wound closures in ZR/UbcH8-shRNA 1 cells were significantly slower than that of ZR/control-shRNA 1 cells. The healing area of ZR/control-shRNA 1 and 2 cells reached 100% in 52 h, while ZR/UbcH8-shRNA 1 and 2 cells showed only 32–33% wound healing (calculated using ImageJ software [data not shown]) in the same time frame (see vertical black lines for the ‘wound widths’). Similar to the wound-healing assay, the resistance curve for ZR/control-shRNA 1 cells returned above the starting value within 13 h after receiving the electric pulse (due to the migration of cells from the perimeter of the electrode inward to replace the killed cells [healing]); however, the ZR/UbcH8-shRNA 1 resistance curve failed to reach the control level even in 24 h after receiving the electrical pulse (Figure 6b). Together, the results of two different wound healing assays suggest that the time required for healing the wound is much longer for ZR/UbcH8-shRNA as compared with the ZR/control-shRNA cells.
ISGylation promotes breast cancer cell migration. (a) To assess cell migration by the ‘scratch’ wound assay, wounds were created by scraping confluent monolayers of cultured ZR/control- and UbcH8-shRNA 1 cells in 60-mm culture dishes. The scratched monolayer cultures were photographed under phase contrast microscope after various times. (b) The electrical cell-substrate impedance sensing assay was performed as described in Figure 4b. Normalized resistance versus time plot is shown (left panel). Both the experiments were repeated two times with the reproducible results. (A color version of this figure is available in the online journal)
Similar to ZR-75-1 breast cancer cells, MDA-MB-231 breast cancer cells stably expressing ISG15- and UbcH8-shRNA also displayed altered morphology and decreased cell migration (Desai et al., unpublished data). Since, the free ISG15 levels remained constant in both ZR/UbcH8- (see Figure 5a, right panel) and MDA-MB-231/UbcH8- (Desai, et al., unpublished data) shRNA cells, our results suggest that ISG15 conjugates, and not free ISG15, majorly contribute to the tumor cell re-organization and motility. Together, these results using two different shRNAs targeting two different components of the ISG15 pathway (ISG15 and UbcH8) in two different breast cancer cell lines strongly suggest the role of the ISG15 pathway in re-organization of tumor cell architecture and motility.
ISG15 upregulates expression of cellular proteins associated with cell motility, invasion and metastasis
ISG15 antagonizes the ubiquitin pathway.
20
We therefore speculated that ISG15 may promote tumor cell migration by stabilizing cellular proteins involved in this process. Hence, we measured the steady-state levels of NFAT5 and S100A4 transcription factors involved in cell motility and invasion in ZR/control- and ISG15-shRNA 1 cells.
36
We selected NFAT5 and S100A4 proteins for this study because NFAT5 is a known target of the ubiquitin pathway,
37
and NFAT5 regulates S100A4.
36
We therefore expected that ISG15 would antagonize targeted degradation of NFAT5 which in turn, would stabilize S100A4. As shown in Figure 7a, the steady-state levels of both NFAT5p (first panel) and S100A4p (second panel) were attenuated in ZR/ISG15-shRNA 1 cells compared with ZR/control-shRNA 1 cells over-expressing ISG15.
ISG15 stabilizes cellular proteins associated with cell migration, invasion and metastasis. (a) ZR/control- and ISG15-shRNA 1 cell lysates were analyzed for NFAT5 and S100A4 proteins using their specific antibodies in Western blotting. (b) The rate of degradation of NFAT5 protein in cycloheximide-treated cells was measured as described in ref.
20
using anti-NFAT5 antibody (left panel). ZR/ISG15-shRNA 1 cells were treated with MG132 (5 μmol/L) for 0–12 h. Cell lysis and analysis of NFAT5 (right panel) was done as described above. (c) The rate of degradation of S100A4 protein in cycloheximide-treated cells was measured as described in ref.
20
using anti-S100A4 antibody (left panel). ZR/ISG15-shRNA 1 cells were treated with MG132 (5 μmol/L) for 0–12 h. Cell lysis and analysis of S100A4 (right panel) was done as described above. (d) The rate of degradation of paxillin in cycloheximide-treated cells was measured as described above using anti-paxillin antibody. All experiments described in (b–d) were repeated two times with similar results. (e) Cell invasion was examined using a CytoSelect™ 24-well cell invasion assay kit according to the manufacturer's protocol. The experiment was repeated two times and all samples were analyzed in duplicate (error bar represents ±SEM)
Since ISG15 interferes with the ubiquitin pathway, 20 and NFAT5 is a known substrate of the ubiquitin pathway, 37 we examined if the increased steady-state levels of NFAT5 is due to the inhibition of its degradation via the ubiquitin/proteasome pathway in ZR/control-shRNA 1 cells over-expressing ISG15. We compared the rate of degradation of NFAT5 protein in ZR/control- and ISG15-shRNA 1 cells in the presence of cycloheximide to block protein synthesis. 20 Figure 7b shows little turnover of NFAT5 (left panel) in ZR/control-shRNA cells in the presence of cycloheximide for up to four hours (t 1/2 = 40 h) (left panel, lanes 1–3). In contrast, NFAT5 was rapidly degraded within four hours of cycloheximide treatment in ZR/ISG15-shRNA 1 cells (t 1/2 = 7 h) (left panel, lanes 4–6). In addition, a time-dependent increase in the levels of NFAT5 occurred in ZR/ISG15-shRNA 1 cells treated with the proteasome inhibitor MG132, indicating that turnover of the proteins was mediated by the 26S proteasome (Figure 7b, right panel, compare lanes 1–4).
The metastatin/S100A4 is regulated by NFAT5. 36 To the best of our knowledge, whether S100A4 is a substrate of the ubiquitin/proteasome pathway is not known. Studies were therefore performed to test if S100A4 is a substrate of the 26S proteasome, and whether ISG15 inhibits its degradation by interfering with the ubiquitin-dependent targeting pathway, increasing steady-state levels of S100A4 protein in ZR/control-shRNA 1 cells (shown in panel a). We measured the rate of degradation of S100A4 protein in ZR/control- and ISG15-shRNA 1 cells in the presence of cycloheximide. Figure 7c, left panel, shows little turnover of S100A4 in ZR/control-shRNA 1 cells in the presence of cycloheximide for up to four hours (t 1/2 = 69 h). In contrast, S100A4 was rapidly degraded within four hours of cycloheximide treatment in ZR/ISG15-shRNA 1 cells (t 1/2 = 1 h) (left panel, compare lanes 2 and 4 for S100A4). In addition, a time-dependent increase in the level of S100A4 occurred in ZR/ISG15-shRNA cells treated with the proteasome inhibitor MG132, indicating that turnover of the S100A4 was mediated by the 26S proteasome (Figure 7c, right panel, compare lanes 1–4).
As an internal control, we also examined steady-state levels of paxillin, an adaptor protein of focal adhesions. Paxillin is modified by Lys63-linked polyubiquitin chains; 33 however, Lys63-linked polyubiquitin chains do not target proteins for the 26S proteasome-dependent degradation. 38 In both ZR/control- and ISG15-shRNA 1 cells treated with cycloheximide, steady-state levels of paxillin remained unaltered (Figure 7d). The latter observation demonstrates that ISG15-dependent stabilization of NFAT5 and S100A4 is a specific event. Together, these results confirm our previous observations that ISG15 inhibits ubiquitin-mediated degradation, 20 in this case, the downregulation of cellular proteins associated with cell motility, invasion and metastasis.
To test whether the stabilization of the cellular proteins associated with invasion confers increased invasive ability to tumor cells, we examined the invasive ability of ZR/ISG15- and control-shRNA 1 cells, finding that after 24 h of incubation in a CytoSelect™ 24-well cell invasion chamber (coated with a uniform layer of dried basement membrane matrix solution (Cell Biolabs, Inc.), ZR/ISG15 cells exhibited a three-fold decrease in invasion compared with ZR/control-shRNA 1 cells (Figure 7e).
Collectively, our results demonstrate that the aberrant elevation of the ISG15 pathway confers a motile and invasive phenotype to breast cancer cells by disrupting cell architecture and stabilizing proteins involved in cell motility, invasion and metastasis.
Discussion
The ISG15 pathway is highly elevated in various malignancies but not in their normal counterparts. 4,20 However, how the elevated ISG15 pathway contributes to tumorigenic phenotypes remains unclear and, hence, is investigated in the current study. This study employs genetic knockdown of both ISG15 and ISG15-specific E2 enzyme, UbcH8, to determine the importance of elevated ISGylation in the malignant phenotype of ZR-75-1 breast cancer cells. The rationale for utilizing genetic knockdown to determine the contribution of the ISG15 pathway in the maliganant phenotype is two-fold: (1) The ISG15-specific E3 enzymes that play a critical role in malignancy are unknown; therefore, over-expression of the ISG15 pathway (E1, E2 and E3 ligases) in normal cells is not a feasible strategy; and (2) ISG15 and UbcH8 are necessary components for ISGylation; therefore, genetic knockdown of either is an attractive alternative in tumor cells with constitutive elevation of the ISG15 pathway. Utilizing several gene knockdown approaches, this study demonstrates that elevated expression of the ISG15 pathway results in disruption of the cytoskeletal architecture of breast cancer cells, a hallmark of the malignant phenotype. 39 In addition, targeted knockdown of both ISG15 and the ISG15-specific E2 enzyme, UbcH8, in breast cancer cells resulted in re-constitution of the cytoskeletal architecture, suggesting that ISGylation is critically important for conferring the maliganant phenotype to breast cancer cells. This result is in accordance with previous studies documenting the importance of ISG15 conjugation in antagonizing the ubiquitin pathway in breast cancer cells. 20
While it is not clear how ISG15 alters cell architecture, the observation that ISG15 antagonizes the ubiquitin pathway suggests a model: induction of the ISG15 pathway inhibits ubiquitin-mediated signaling required for the formation of matured focal adhesions and re-organization of actin polymers tethered to them, consequently, disrupting the cellular architecture of breast cancer cells. Disrupted cell architecture would then confer increased motility to breast cancer cells. Consistent with this model, several focal adhesion proteins (e.g. src kinase, 40 talin 41 and paxillin 42 ) are the substrates of the ubiquitin pathway. 33 ISG15, which is elevated in breast cancer cells, may modulate the fate of these proteins consequently alter cell architecture. For example, paxillin, an important adaptor protein of focal adhesions, is ubiquitylated by RNF5 E3 ligase. 42 RNF5 in conjunction with E2-Ubc13 conjugates Lys63-linked polyubiquitin chains to itself (autoubiquitylation) and paxillin. 42 RNF5-mediated polyubiquitylation alters paxillin localization and inhibits cell motility. 42 Because ISG15 inhibits E2-Ubc13 by conjugation to the E2 protein, 43,44 ISG15 may downregulate RNF5-mediated paxillin ubiquitylation, and hence enhance cell motility. Our observation that the ISG15 pathway promotes breast cancer cell motility supports this idea. Moreover, stabilization of cellular proteins involved in cell motility, invasion and metastasis (e.g. transcription factors NFAT5 and S100A4) further supports the antagonistic role of ISG15 in disrupting tumor cell architecture and migration.
ISG15 may have function(s) other than antagonizing the ubiquitin pathway, through which it may disrupt cell architecture. Previous studies have shown that ISG15 is non-covalently associated with intermediate filaments 45 and conjugated to the cortical actin-binding protein filamin B in human A549 lung cancer cells. 46 It is possible that ISG15 interacts/conjugates with the proteins associated with intermediate and cortical filaments and alters the cytoskeleton dynamics in tumor cells.
Like tumor cells, ISG15 is also elevated in ataxia telangiectasia cells. 25,47 We have recently demonstrated that like in tumor cells, elevated expression of the ISG15 pathway inhibits the ubiquitin/26S proteasome pathway in ataxia telangiectasia cells. 25 Interestingly, cytoskeletal anomalies have also been demonstrated in ataxia telangiectasia cells. 48 It is unclear whether the observed cytoskeletal anomaly is causally related to the over-expression of ISG15 in ataxia telangiectasia cells. Nevertheless, previous results in ataxia telangiectasia cells, together with our results in breast cancer cells, strongly suggest that the elevated ISG15 pathway results in the cytoskeletal anomaly.
Disruption of cellular architecture is a hallmark of cancer. 39 The ISG15 pathway is also elevated in a variety of tumors. 4 Our results therefore suggest that the ISG15 pathway, which is aberrantly elevated in tumors, could disrupt cell architecture and contribute to tumor cell motility, and consequently metastatic ability of tumor cells. Strategies to decrease ISGylation could therefore provide a therapeutic advantage for patients diagnosed with metastatic tumors over-expressing the ISG15 pathway.
Footnotes
ACKNOWLEDGEMENTS
We thank Drs Loren Runnels and Ijaz Ahmed (Department of Pharmacology, University of Medicine and Dentistry of New Jersey/Robert Wood Johnson Medical School, Piscataway, NJ, USA) for their help with the confocal analysis. This work was supported in part by funds from the LSU-Health Science Center School of Medicine and NIH/NINDS grant 1R21NS060960 to SD.