




Abstract
Anemia induced by inflammation is well known to be more serious in the elderly than in non-elderly adults; however, the reason why this is so remains unclear. Neopterin produced by monocytes during inflammation promotes myelopoiesis but suppresses B-lymphopoiesis and erythropoiesis, by activating stromal cells in mice. Here, age-related changes in the erythropoietic response to neopterin were determined using senescence accelerated mice (SAMP1) with senescence stromal-cell impairment. Intravenous injection of neopterin into young mice (8–12 weeks old) resulted in a decrease in erythroid progenitor cell number in the bone marrow (BM), concomitant with an increase in myeloid progenitor cell number over one week. Intravenous injection of neopterin into aged mice (30–36 weeks old) resulted in a prolonged decrease in erythroid progenitor cell number in the BM over three weeks and a limited increase in myeloid progenitor cell number over one day. Neopterin treatment induced a decrease in serum erythropoietin concentrations in young mice but not in aged mice. The gene expression of tumor necrosis factor α (TNF-α), a negative regulator of erythropoiesis, was up-regulated in the BM of both young and aged mice, and the degree of TNF-α up-regulation was the same in both groups. The gene expression of interleukin (IL)-11, a positive regulator of erythropoiesis, was also up-regulated over one day in both young and aged mice. However, IL-11 gene expression remained up-regulated thereafter in young mice, whereas it was rapidly down-regulated in aged mice. These data suggest that prolonged suppression of erythropoiesis in aged mice may be due to a decrease in the production of positive regulators rather than to an increase in the production of negative regulators. Our combined data suggest that age-related impairment of stromal cells induces serious anemia in the elderly during inflammation.
Introduction
Anemia is a common multifactorial condition among the elderly. Approximately one-third of elderly people with anemia have evidence of iron, folate and/or vitamin B12 deficiency, another third have renal insufficiency and/or chronic inflammation, which may underlie folate and/or vitamin B12, and the remaining third have anemia that is unexplained. 1 When inflammation occurs in the elderly with slight anemia, their anemia is exacerbated, which results in an increased risk of adverse events. However, it is unclear why the anemia induced by inflammation is more serious in the elderly than in non-elderly adults.
Neopterin is a metabolite of guanosine triphosphate that is produced in the biopterin synthetic pathway. 2 In in vitro systems, large amounts of this metabolite are generated by ‘monocytes and macrophages’ in response to interferon-γ. 3 Increased neopterin production is observed following infection by viruses, bacteria and parasites. 4 Because the neopterin concentration in body fluids reflects immune responses in vivo, neopterin is regarded as a sensitive marker of the activation of the cellular immune system in humans as well as a prognostic factor and an indicator biomarker. 4,5
We recently demonstrated that neopterin suppresses erythropoiesis by activating bone-marrow (BM) stromal-cell functions. 6 These changes are compatible with anemia during inflammation, which is commonly observed during bacterial infections and inflammatory disorders and is a well-described clinical entity. 7 Furthermore, we previously reported that senescence-accelerated mice (SAMP1) exhibit premature senescence-like stromal-cell impairments after 30 weeks of age. 8,9 It is thus of interest to use SAMP1 mice to determine whether senescence stromal-cell impairment may cause serious anemia during inflammation.
In this study, we investigated differences in neopterin-induced erythropoietic responses between young and aged mice, with respect to oscillatory changes in the number of erythroid progenitor cells and the gene expression levels of cytokines in the BM.
Materials and methods
Mice
Senescent stromal-cell-impaired mice of the SAMP1 strain (Festing MFW, 1998 10 ) (Japan SLC, Co Ltd, Hamamatsu, Japan) were used. All the mice were housed under specific pathogen-free conditions at 24 ± 1°C and 55 ± 10% relative humidity, under a 12-h light–dark cycle. Autoclaved tap water and food pellets were provided ad libitum. SAMP1 mice exhibit stromal-cell impairment after 30–36 weeks of age. In this study, male SAMP1 mice designated as young mice (8–12 weeks old) were compared with aged mice (30–36 weeks old). Mice of these ages were selected because the number of splenic cells and splenic hematopoietic progenitor cells start to decrease significantly at approximately 30 weeks of age. 11,12 All experimental protocols involving laboratory mice in this study were reviewed by a peer-review panel, the Interdisciplinary Monitoring Committee for the Right Use and Welfare of Experimental Animals, established at Nihon University School of Medicine (NUSM), and were approved by the Committee for Animal Care and Use at NUSM with the experimental code #AP09M003. All experiments were humanely performed in strict accordance with the Guidelines for the Care and Use of Laboratory Animals, NUSM, Japan.
Neopterin
Neopterin administration
Young and aged mice were injected intravenously with neopterin (0.4 and 4.0 mg/kg bw). The mice were evaluated 1, 7, 14 and 21 d after neopterin administration. A control group of mice was injected with the same volume of PBS containing the same concentration of HCl. Three mice per group were examined for each data point. The concentration of serum neopterin in pretreated and treated mice, 30 and 60 min after intravenous injection of neopterin (4 mg/kg bw), was lower than 1 nmol/L, being 7150 and 1720 nmol/L, respectively. 15
Preparation of peripheral blood and bone marrow cells
Peripheral blood was collected from the retro-orbital plexus under anesthesia using ethyl ether, and blood parameters were measured using a Sysmex K-4500 blood cell counter (Sysmex Co, Kobe, Japan). BM cell suspensions were prepared by repeatedly flushing the cells from femurs and then dispersing them by repeated passage through a 23-gauge hypodermic needle using α-minimum essential medium (α-MEM; Life Technologies, Grand Island, NY, USA) or Iscove's modified Dulbecco's medium (IMDM; Invitrogen, Carlsbad, CA, USA). BM cells from the bilateral femora of three mice per experimental group were individually removed, and blood parameters were separately determined. BM cells were pooled for colony assay and RNA extraction.
In vitro colony assays
Erythroid burst-colony-forming units (BFU-Es) and erythroid colony-forming-units (CFU-Es) were assayed by suspending BM cells in α-MEM containing 1% methylcellulose, 30% fetal bovine serum (FBS; Hyclone, Logan, UT, USA), 1% deionized bovine serum albumin, 100 μmol/L 2-ME, and erythropoietin (Kirin Brewery Co, Tokyo, Japan) with 1 ng/mL interleukin (IL)-3 for BFU-Es or without IL-3 for CFU-Es.
6
The erythropoietin concentrations used were 2 U/mL for BFU-Es and 0.4 U/mL for CFU-Es. Colony formation by colony-forming unit granulocyte–macrophage (CFU-GM) cells was assayed using a semi-solid medium containing GM-colony-stimulating factor (CSF). BM cells were assayed in 35-mm plastic Petri dishes containing 1 mL of MethoCult M 3231 medium (Stem Cell Technologies Inc, Vancouver, BC, Canada), which consisted of IMDM composed of 1% methylcellulose, supplemented with 30% FBS, 1% bovine serum albumin, 0.1 mmol/L 2-mercaptoethanol, 2 mmol/L
Total RNA extraction and quantitative realtime polymerase chain reaction analysis
Total RNA was extracted from pooled BM cells from three mice per group using the ISOGEN reagent (Nippongene Corp, Toyama, Japan) in accordance with the manufacturer's instructions. The isolated mRNA was reverse-transcribed using Superscript III (Life Technologies) and Oligo-dT (Promega Corp, Madison, WI, USA). Next, cDNA was transcribed in triplicate per sample and analyzed by quantitative realtime polymerase chain reaction (PCR) using a TaqMan™ Universal Fast PCR master mix (Applied Biosystems, Foster City, CA, USA) with specific primers and probes and the Applied Biosystems 7900 Sequence Detection System. Specific primers and probes for murine tumor necrosis factor α (TNF-α), IL-11, IL-6, GM-CSF and glyceraldehyde phosphate dehydrogenase (GAPDH) genes were: TNF-α, Mm00443281_ml; IL-11, Mm00434162_m1; IL-6, Mm00446190_ml; GM-CSF, Mm00538328_ml; and GAPDH, Mm99999915_gl. PCR conditions and data analysis were in accordance with the instructions provided with the Sequence Detection System, version 2.0. All reactions were performed in triplicate. In accordance with the manufacturer's instructions, cytokine-specific signals were normalized to GAPDH signals using the formula 2−ΔCt = 2−(Ct GAPDH−Ct Cytokine), and the relative level of cytokine gene expression was calculated using the formula 2−ΔΔCt = 2−(ΔCt, for neopterin treatment−ΔCt, for control).
Statistical analysis
All data are presented as means ± standard deviation (SD). The significance of differences among experimental groups was assessed using one-way analysis of variance. The acceptance level of statistical significance was P < 0.05.
Results
In vivo effect of increasing doses of neopterin on erythropoiesis and myelopoiesis in young and aged mice
To determine the in vivo effect of neopterin on erythropoiesis and myelopoiesis, neopterin (0.4 and 4.0 mg/kg bw) was intravenously injected into young and aged mice, and the number of BFU-Es and CFU-GMs was evaluated after one day. Figure 1 shows the effect of neopterin on the number of these cells in the BM, which is expressed as a percent of that in the non-treated control. At concentrations of 0.4 and 4.0 mg/kg bw, neopterin decreased the number of BFU-Es in young mice to 65% and 53%, and that in aged mice to 79% and 67% that of the control, respectively. In contrast, the number of CFU-GMs in young mice increased to 123% and 153%, and that in aged mice increased to 114% and 123% that of the control, respectively.
Effect of neopterin treatment on the number of BFU-Es and CFU-GMs in the bone marrow of young and aged mice. Samples of femoral bone were obtained from three mice one day after intravenous injection of 0.4 or 4.0 mg/kg bw neopterin, and the number of BFU-E (a) and CFU-GM (b) colonies was determined. Data are expressed relative to the absolute number of BFU-Es and CFU-GMs observed in the femur of control, non-treated mice, which was designated as 100%. Each bar represents the mean±SD obtained from triplicate experiments. *P < 0.05, †
P < 0.01 versus Control. BFU-E, erythroid burst-colony-forming unit; CFU-GM, colony-forming unit-granulocyte–macrophage; bw, body weight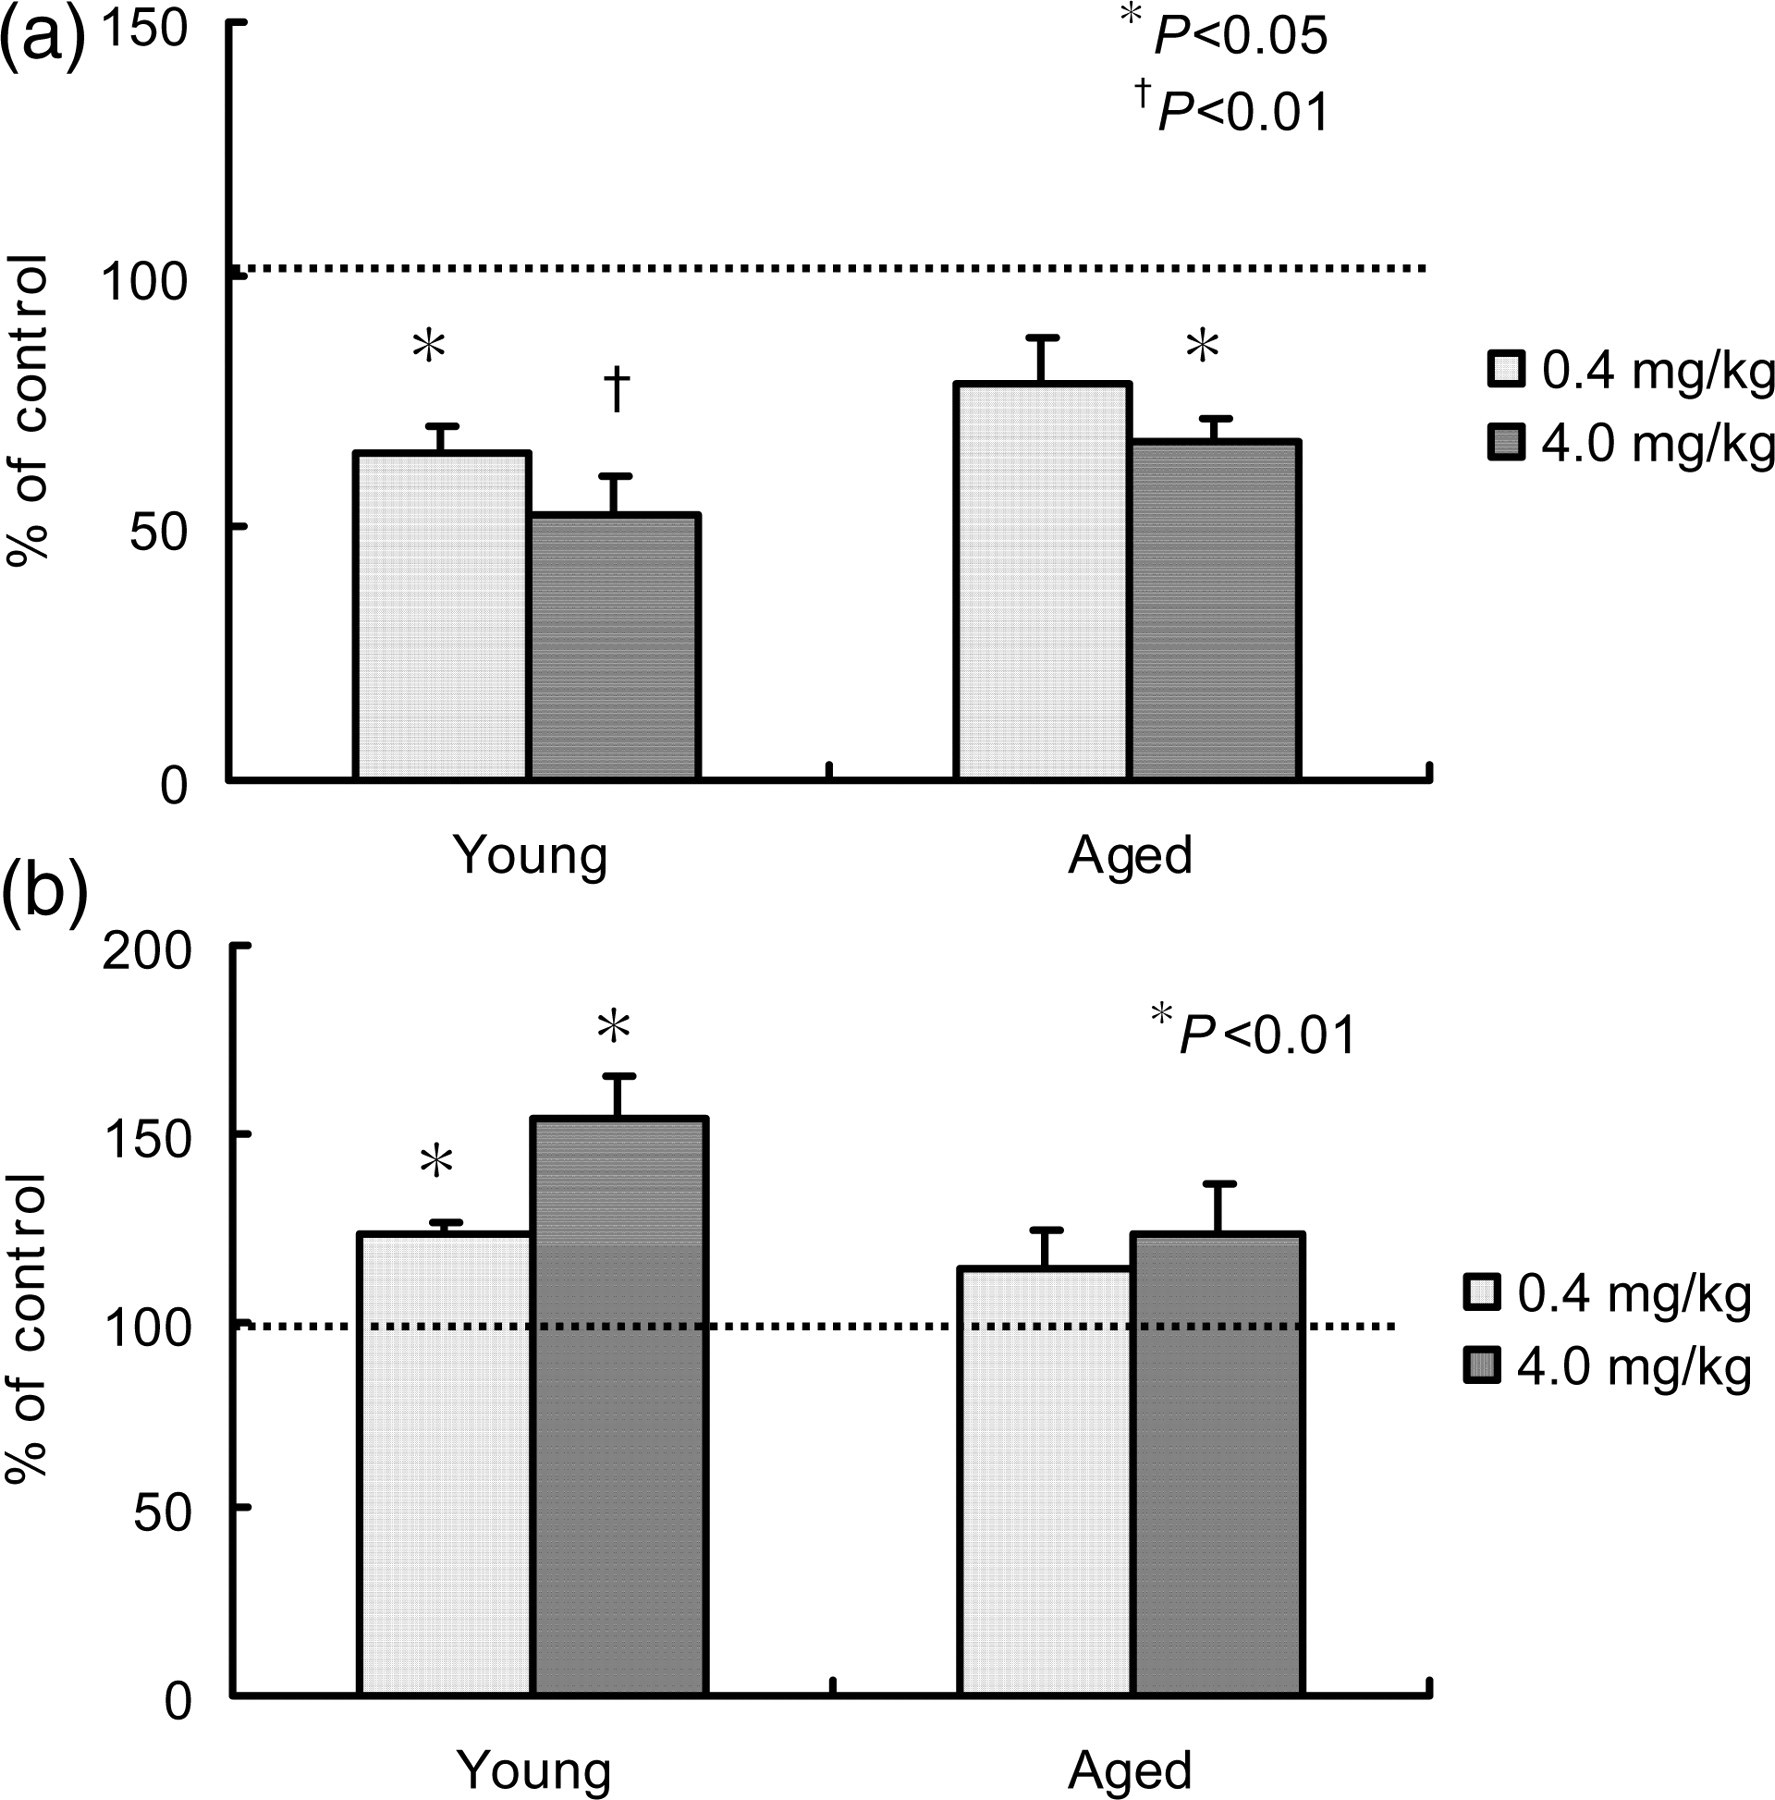
Effect of neopterin treatment on the number of peripheral white blood cells and on the hematocrit of young and aged mice over time
Next, 4.0 mg/kg bw neopterin was intravenously injected into young and aged mice, and hematological parameters such as white blood cell (WBC) number and hematocrit (Ht) were measured 1, 7, 14 and 21 d after treatment (Figures 2 and 3). The number of WBCs in non-treated young and aged mice was 8200 ± 497/L and 5798 ± 823/μL (mean ± SD), respectively. The number of WBCs in young mice after neopterin treatment was increased to 132% of the pretreatment level on day 7 (10,800 ± 1174/μL) (mean ± SD), followed by a decrease to 90% of the pretreatment level on day 14 (7397 ± 1114/μL) (mean ± SD), and remained unchanged thereafter (Figure 2a). In contrast, an increase in the number of WBCs was not observed in aged mice after neopterin treatment (Figure 2b).
Effect of neopterin treatment on the number of peripheral white blood cells (WBCs) in young and aged mice over time. Samples of peripheral blood cells were obtained from three young (a) and three aged (b) mice on days 0, 1, 7, 14 and 21 after a single intravenous injection of 4.0 mg/kg bw neopterin. Changes in the number of WBCs over time were determined. Each bar represents the mean ± SD obtained from three mice Effect of neopterin on the hematocrit (Ht) value in young and aged mice over time. Samples of peripheral blood cells were obtained from three young (a) and three aged (b) mice on days 0, 1, 7, 14 and 21 after a single intravenous injection of 4.0 mg/kg bw neopterin. Changes in Ht values over time were determined. Each bar represents the mean ± SD obtained from three mice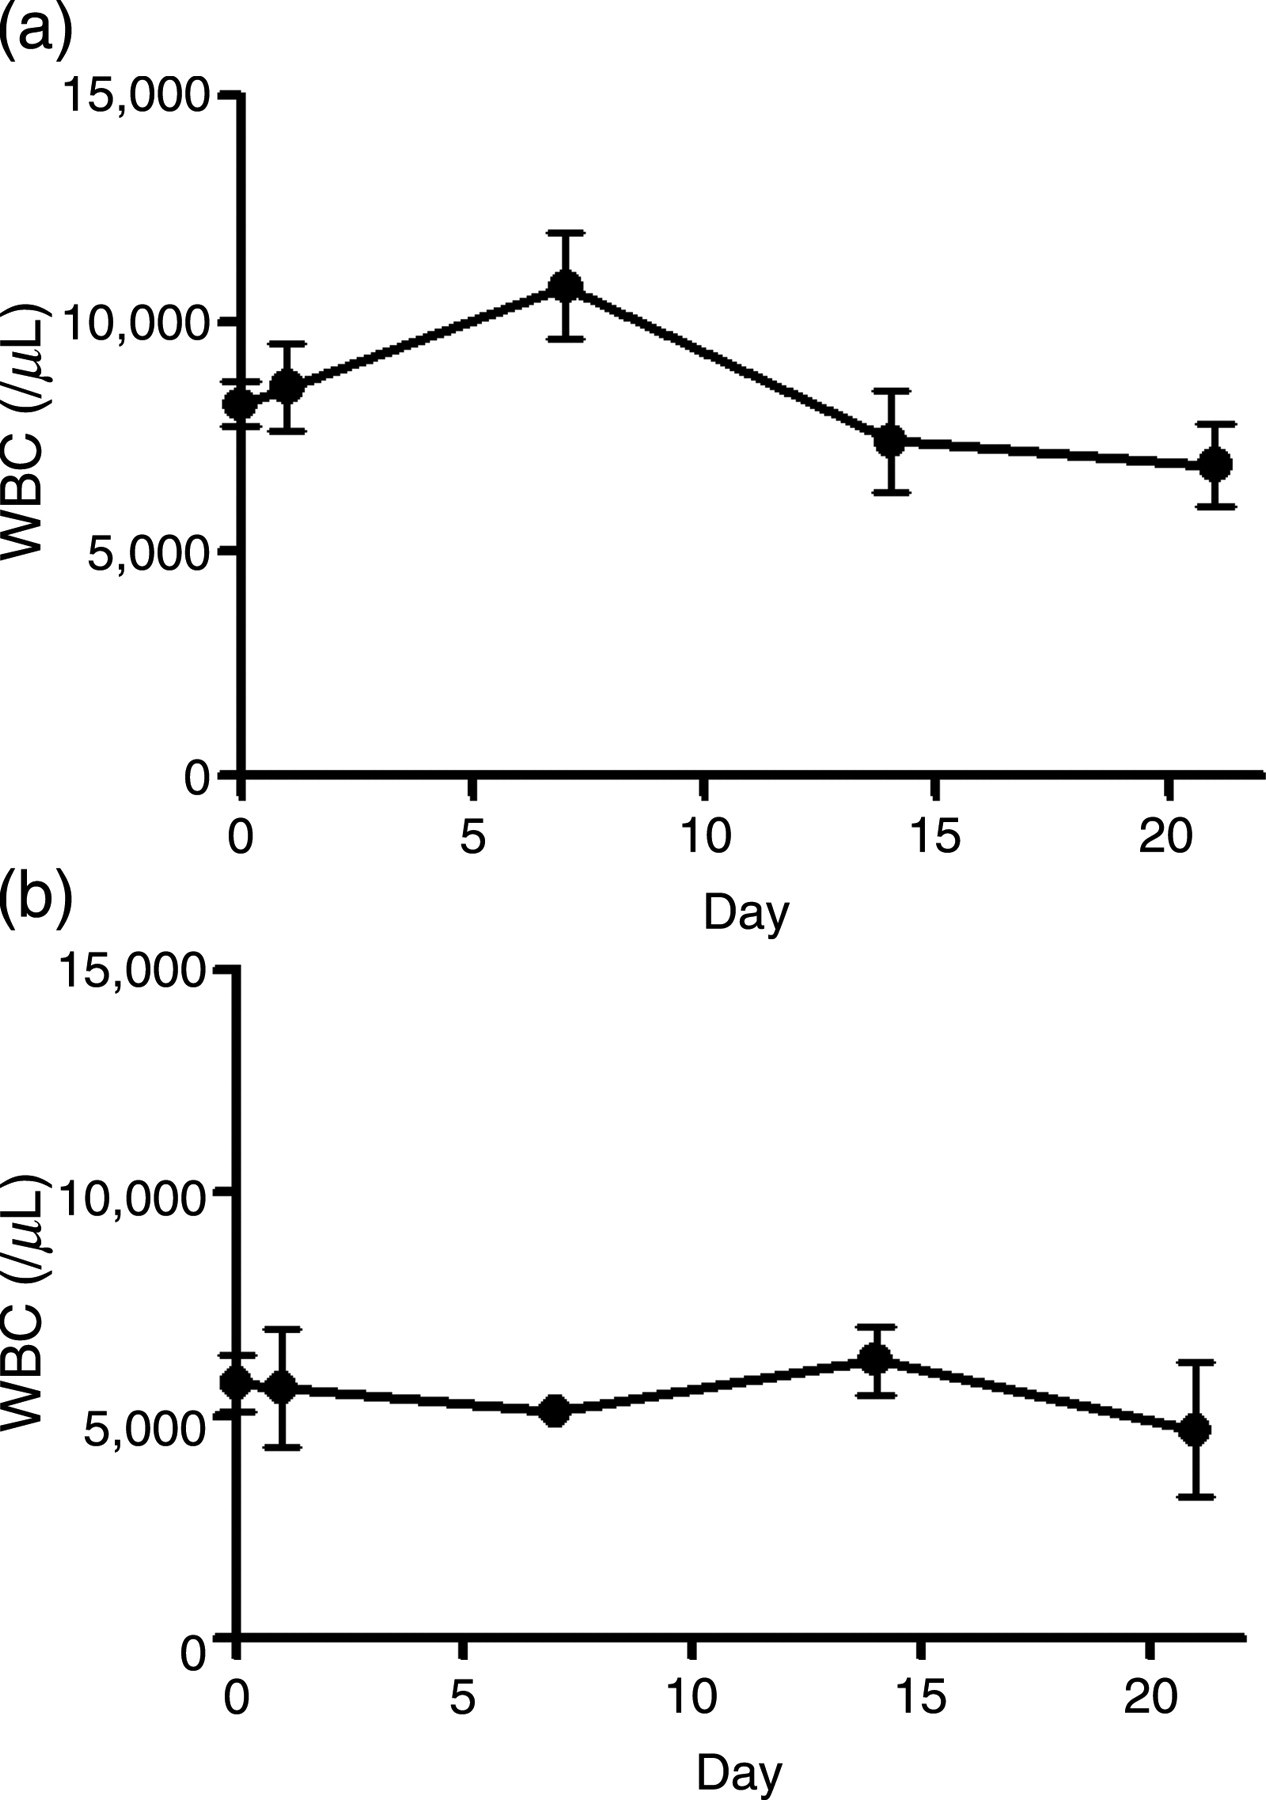

The value of Ht in non-treated young and aged mice was 45.5 ± 1.9% and 43.9 ± 0.9% (mean ± SD), respectively. There was no significant change in Ht values in young and aged mice following neopterin treatment (Figure 3).
Effect of neopterin treatment on the number of erythroid and myeloid progenitor cells in the BM of young and aged mice over time
The number of femoral BFU-E, CFU-E and CFU-GM progenitor cells was also evaluated 1, 7, 14, and 21 d after neopterin treatment (4 mg/kg bw). The absolute number of the progenitor cells BFU-E, CFU-E and CFU-GM in the femoral BM of mice before treatment was 3275 ± 528, 113,080 ± 8456 and 44,783 ± 724 (mean ± SD), respectively, for young mice and 3334 ± 307, 90,500 ± 6227 and 48,218 ± 3491 (mean ± SD), respectively, for aged mice. Figure 4 shows the changes in the numbers of erythroid progenitor cells (BFU-Es and CFU-Es) and myeloid progenitor cells (CFU-GMs) in the BM of young and aged mice over time following neopterin treatment.
Effect of neopterin on the number of BFU-Es, CFU-Es and CFU-GMs in the bone marrow of young and aged mice over time. Samples of femoral bone marrow cells were obtained from three young (a) and three aged (b) mice on days 0, 1, 7, 14 and 21 after a single intravenous injection of 4.0 mg/kg bw neopterin. Changes in the number of BFU-Es, CFU-Es and CFU-GMs over time were determined. Data are expressed relative to the absolute number of BFU-Es and CFU-GMs observed in the femur of control, non-treated mice, which was designated as 100%. Each bar represents the mean ± SD obtained from triplicate experiments. *P < 0.05 versus control. BFU-E, erythroid burst-colony-forming unit; CFU-GM, erythroid colony-forming-unit; CFU-E, erythroid colony-forming-unit; bw, body weight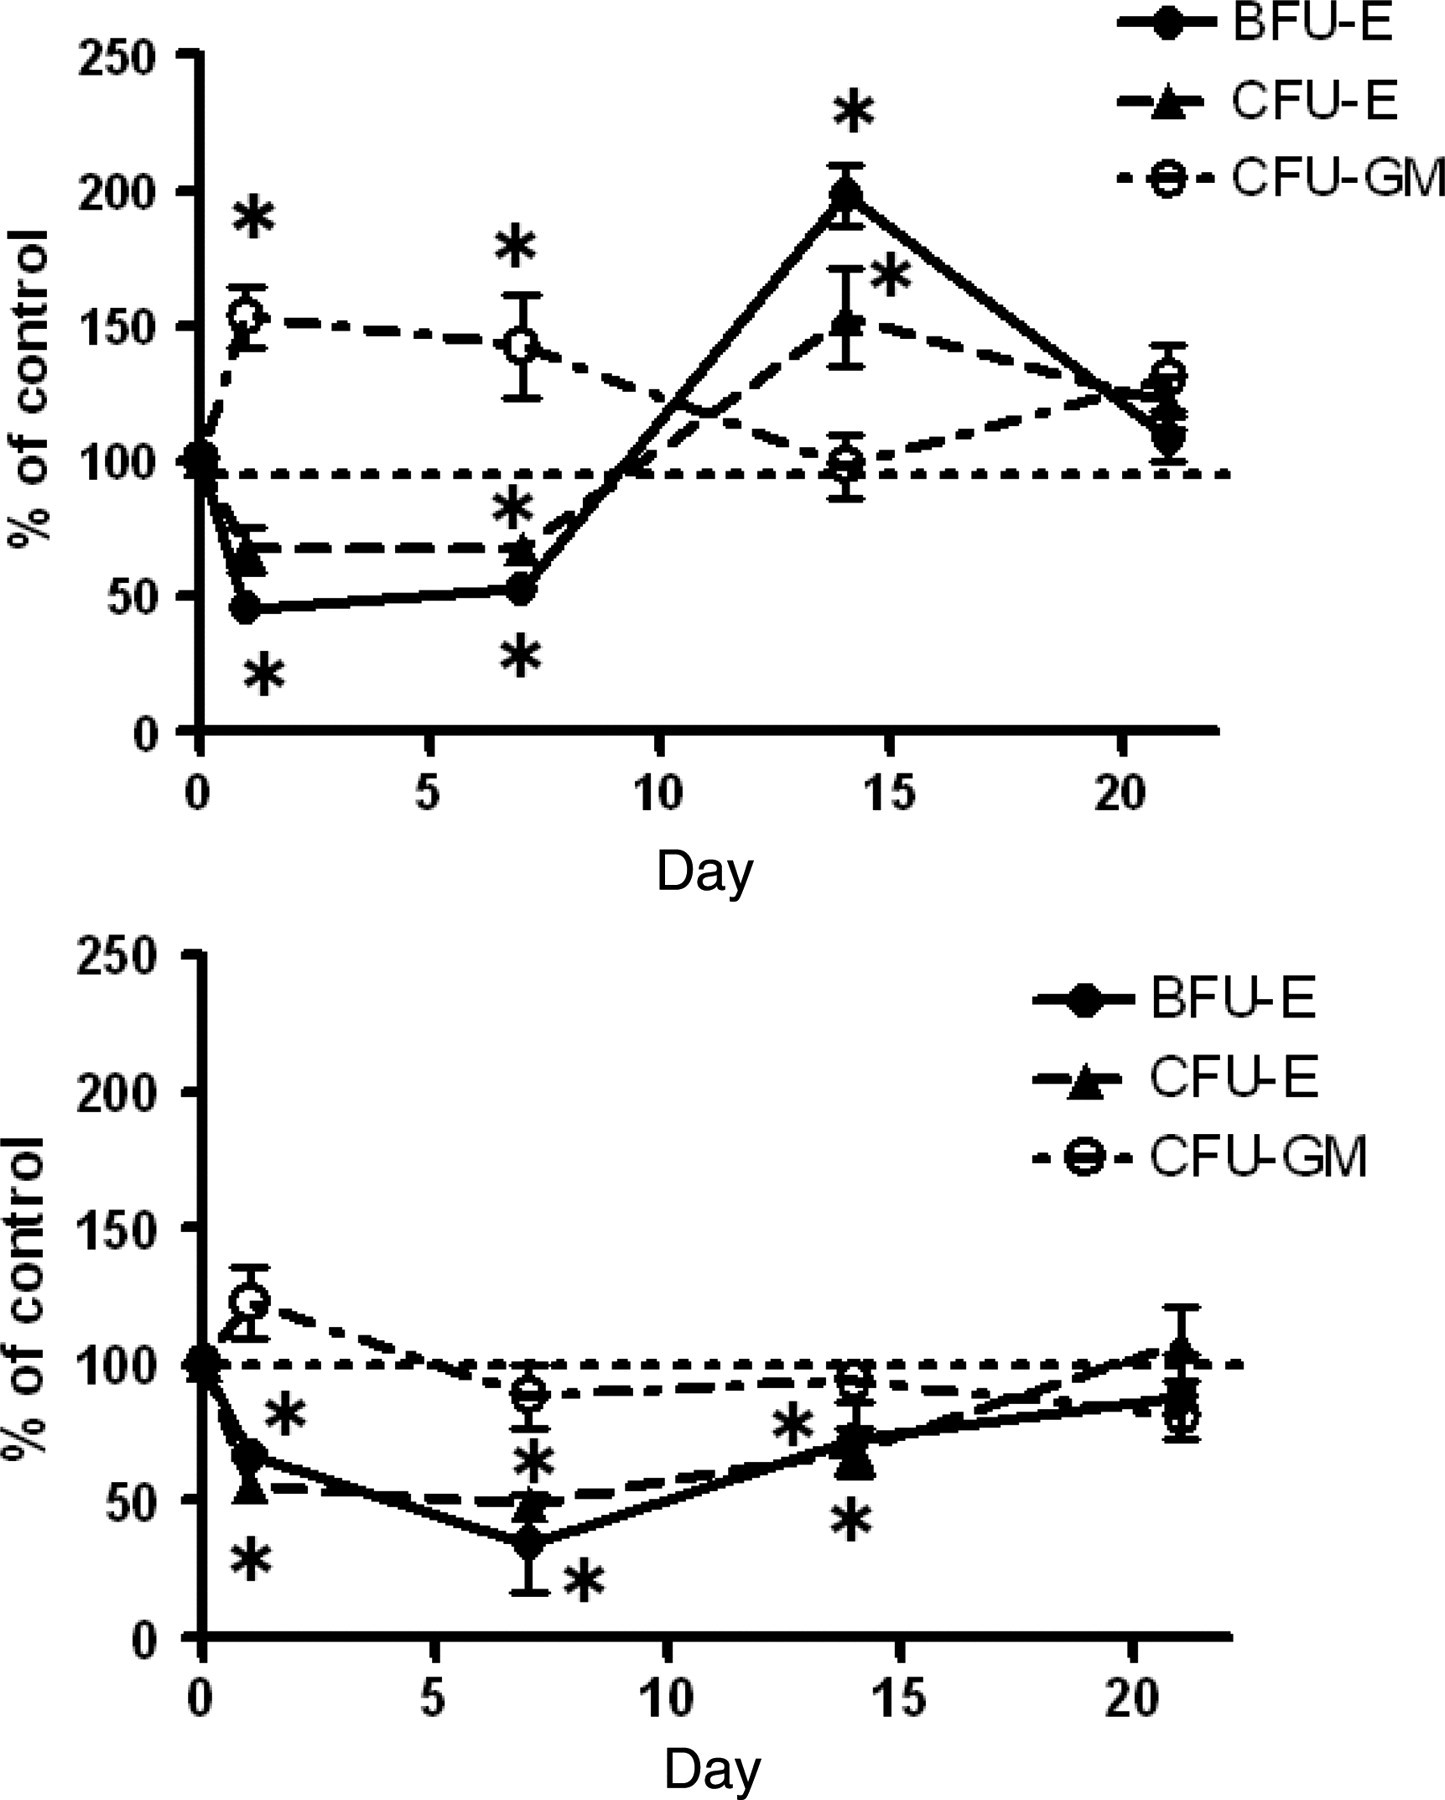
In the case of young mice (Figure 4a), the number of BFU-Es in treated mice decreased continuously during the first 24 h after treatment, to 46% of the pretreatment level. The number of BFU-Es remained lower than the pretreatment level until day 7 and then increased rapidly to reach 199% of the pretreatment level on day 14, followed by a gradual decrease to pretreatment levels on day 21. Changes in the number of CFU-Es in treated mice closely paralleled the changes in the BFU-E number. In contrast, changes in the number of CFU-GMs were the inverse of changes in the BFU-E number. Thus, the number of CFU-GMs increased rapidly to reach 154% that of the pretreatment level during the first 24 h of neopterin treatment, remained higher than the pretreatment level up to day 7, had decreased to the pretreatment level by day 14, but subsequently increased again to reach 131% of the pretreatment level on day 21.
In the case of aged mice (Figure 4b), the number of BFU-Es in treated mice decreased continuously over the first seven days to reach 35% that of the pretreatment level. The number of BFU-Es gradually recovered to reach 89% of the pretreatment level on day 21. Changes in the number of CFU-Es in treated mice closely paralleled changes in the number of BFU-Es. The number of CFU-GMs slightly increased over the first 24 h, to reach 123% of the pretreatment level, subsequently decreased, returning to the pretreatment level on day 7 and thereafter remained unchanged.
Effect of neopterin treatment on serum erythropoietin levels in young and aged mice over time
The concentration of serum erythropoietin (Epo) in young and aged mice after neopterin treatment was determined using an enzyme-linked immunosorbent assay (ELISA), Epo-specific ELISA kit (R&D Systems), according to the manufacturer's instructions. All samples were assayed in triplicate. The concentration of Epo in young and aged mice before treatment was 153±27 and 141±34 pg/mL, respectively (Figure 5). The concentration of Epo in the serum of young mice treated with neopterin continuously decreased to reach 63% of the pretreatment level by day 14, following which they gradually increased and had returned to the pretreatment level by day 21. However, no decrease in serum Epo concentrations was observed in aged mice treated with neopterin.
Effect of neopterin on the serum erythropoietin (Epo) concentration of young and aged mice over time. Samples of peripheral blood were obtained from three young and three aged mice on days 0, 1, 7, 14 and 21 after a single intravenous injection of 4.0 mg/kg bw neopterin. Changes in serum Epo concentration over time were determined. Each bar represents the mean ± SD obtained from three mice. *P < 0.05 versus control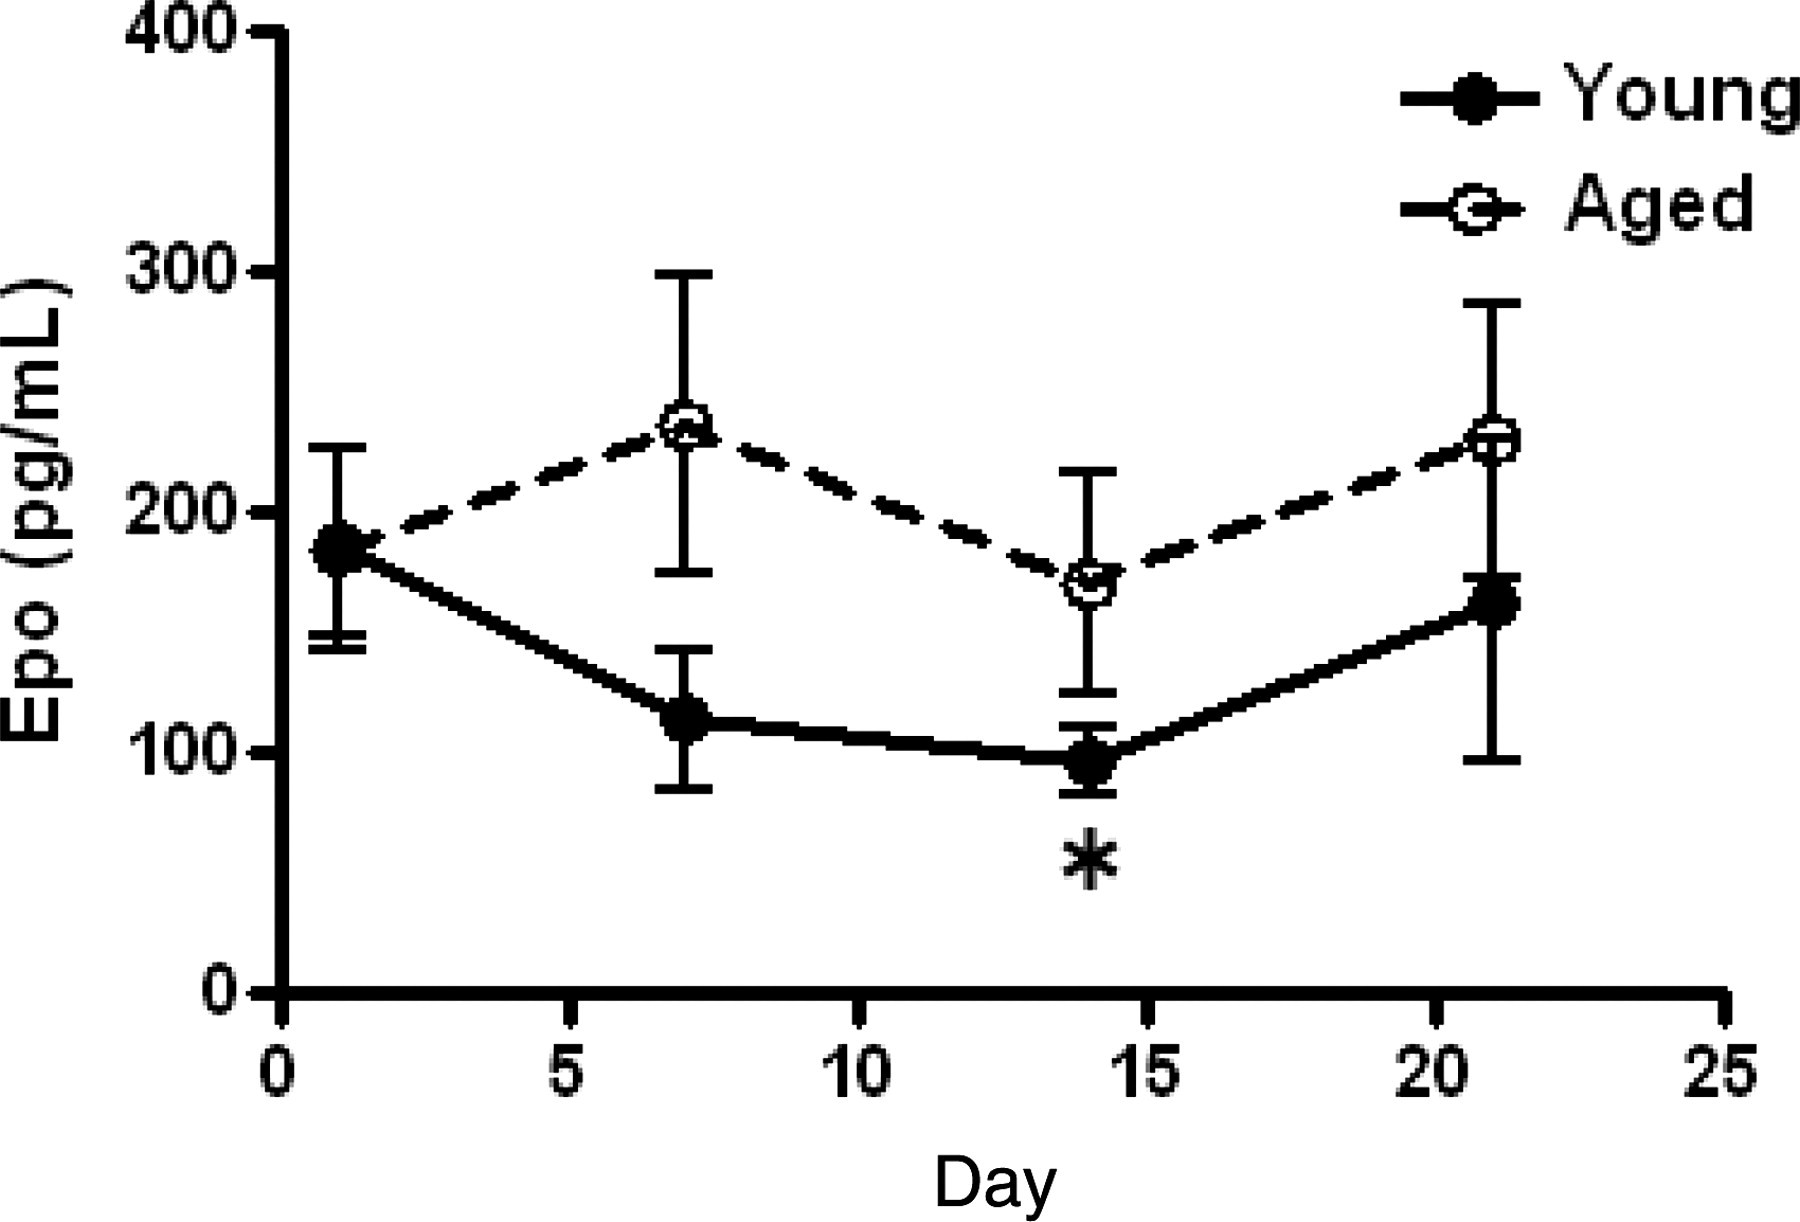
Effect of neopterin treatment on the expression level of TNF-α, IL-11, IL-6 and GM-CSF in the bone marrow of young and aged mice over time
To determine the mechanism underlying the different response of young and aged mice to neopterin, the effect of neopterin treatment on the expression of TNF-α and IL-11, which are negative and positive regulators of erythropoiesis, respectively, 16–18 was evaluated. The expression of IL-6, a positive regulator of immature hematopoietic cells, and of GM-CSF, a positive regulator of myelopoiesis, 19,20 was also evaluated. All of these cytokines are produced by stromal cells and their production is promoted during inflammation.
The expression level of TNF-α in the femoral BM cells of young mice after neopterin treatment increased to 226% that of the pretreatment level during the first 24 h of treatment and thereafter oscillated between 162% and 254% of the pretreatment level (Figure 6a). In the case of aged mice, the expression level of TNF-α remained at the pretreatment level during the first 24 h of treatment, then increased to reach 179% of the pretreatment level on day 7 and thereafter remained up-regulated at this level (Figure 6c).
Effect of neopterin on the gene expression level of TNF-α and IL-11 in the bone marrow of young and aged mice over time. The expression level of TNF-α and IL-11 in femoral bone marrow cells of young (a, b) and aged (c, d) mice was evaluated on days 0, 1, 7, 14 and 21 after a single intravenous injection of 4.0 mg/kg bw neopterin. Results are expressed as a ratio to each value of non-treated young and aged mice. Each bar represents the mean ± SD obtained from triplicate experiments. *P < 0.05, †
P < 0.01, ‡
P < 0.005 versus Control. TNF-α, tumor necrosis factor α; IL, interleukin
The expression level of IL-11 in the femoral BM cells of young mice after neopterin treatment rapidly increased to 252% of the pretreatment level during the first 24 hours after treatment, followed by a gradual but continuous increase to reach 423% of the pretreatment level on day 14. Subsequently, the level decreased, reaching 60% of the pretreatment level on day 21 (Figure 6b). Similar to the young mice, the expression level of IL-11 in aged mice also rapidly increased during the first 24 h after neopterin treatment, reaching 367% of the pretreatment level. However, this high expression of IL-11 subsequently sharply decreased, and reached the pretreatment level by day 7, followed by a continuous decrease to 39% of the pretreatment level on day 21 (Figure 6d).
The expression level of IL-6 in young mice after neopterin treatment continuously increased to reach 407% of the pretreatment level on day 14, followed by a decrease to 148% of the pretreatment level (Figure 7a). In the case of aged mice, the expression level of IL-6 after neopterin treatment continuously increased to reach 287% of the pretreatment level on day 7. However, in contrast to young mice, after seven days of treatment, the gene expression of IL-6 did not continue to increase but its level oscillated between 91% and 159% of the pretreatment level (Figure 7b).
Effect of neopterin on the gene expression level of IL-6 in the bone marrow of young and aged mice over time. The expression level of the IL-6 gene in femoral bone marrow cells of young (a) and aged (b) mice was evaluated on days 0, 1, 7, 14 and 21 after a single intravenous injection of 4.0 mg/kg bw neopterin. Results are expressed as a ratio to each value of non-treated young and aged mice. Each bar represents the mean ± SD obtained from triplicate experiments. *P < 0.05, †
P < 0.01, ‡
P < 0.005 versus Control. IL, interleukin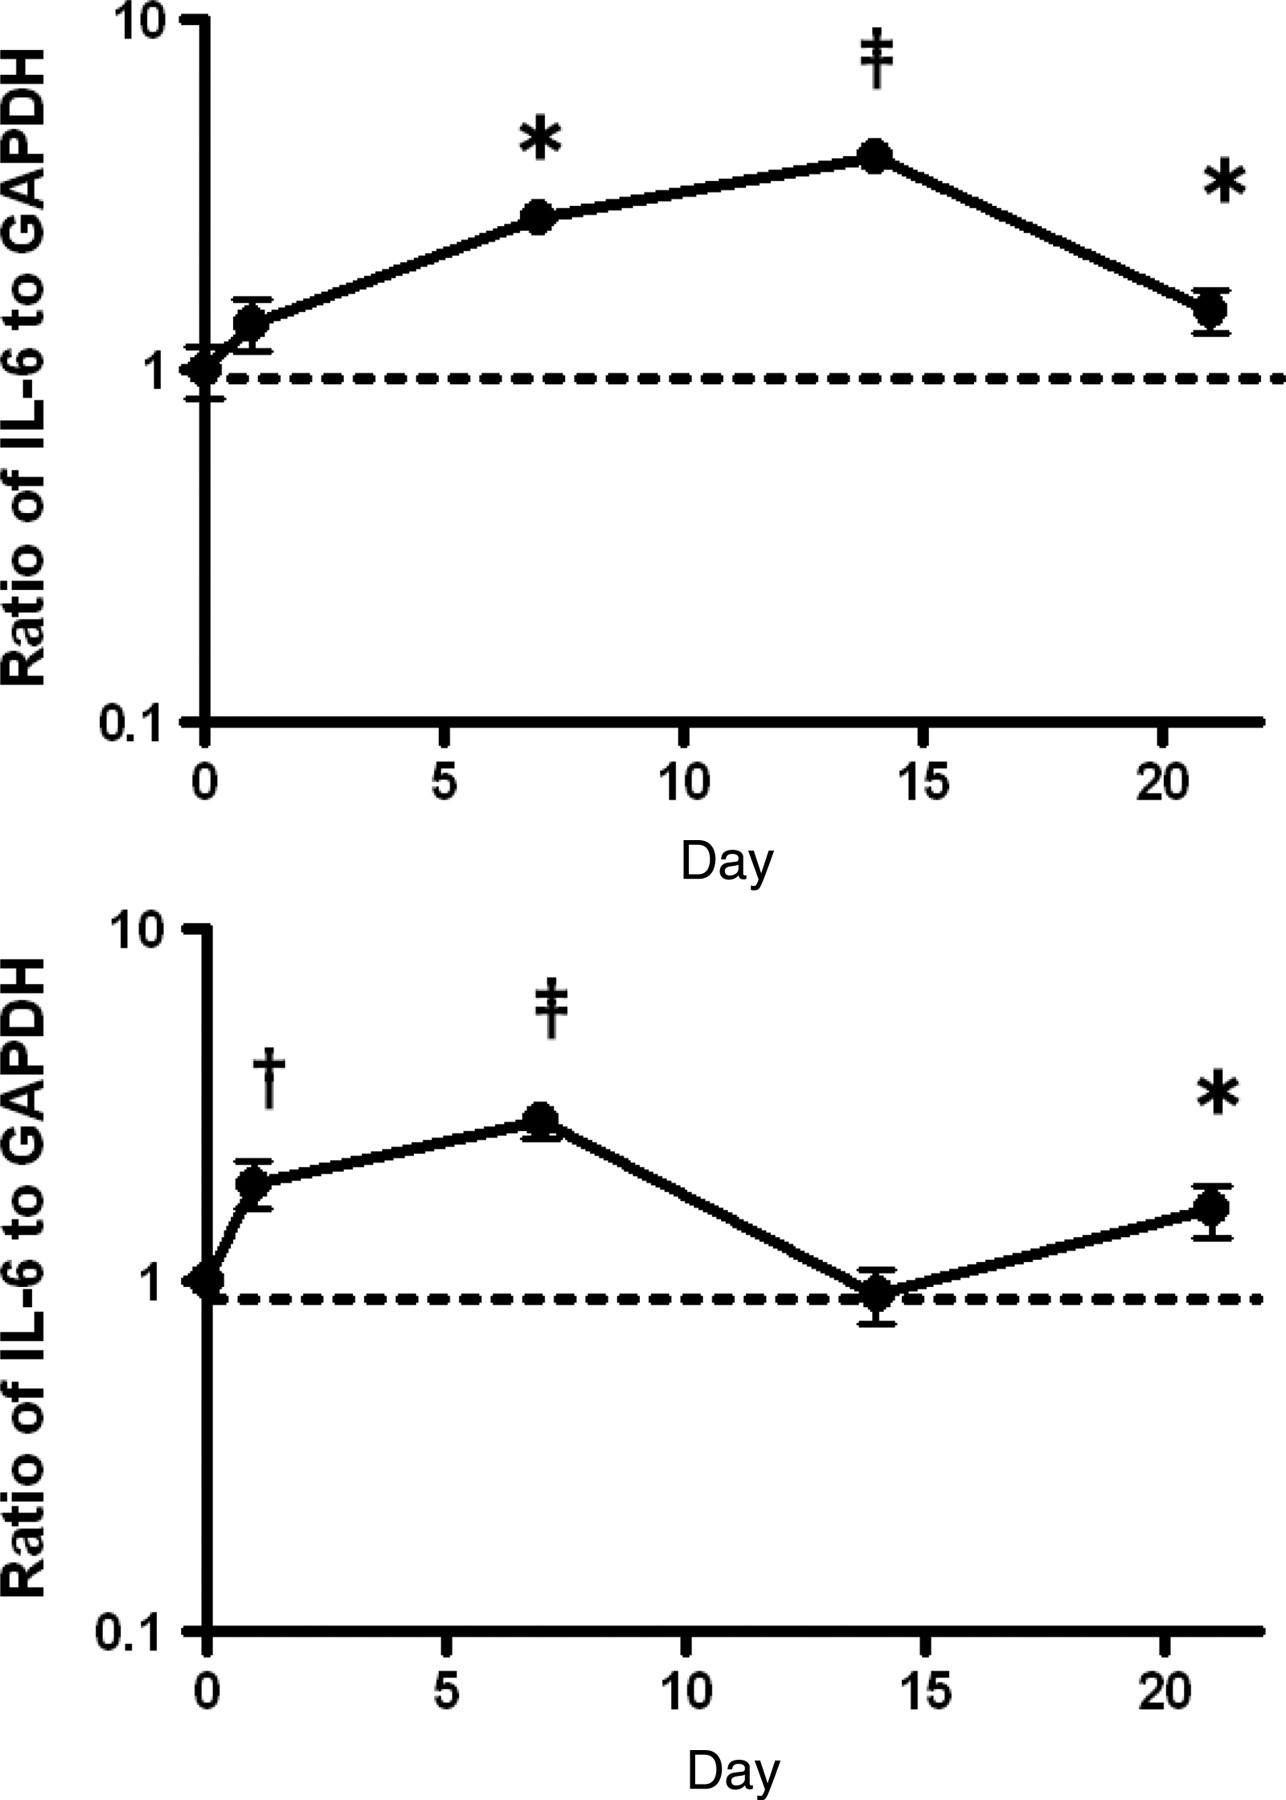
The expression level of GM-CSF in young mice after neopterin treatment continuously increased to reach 276% of the pretreatment level on day 7, and subsequently gradually decreased to 135% of the pretreatment level on day 21 (Figure 8a). In the case of aged mice, the expression level of GM-CSF in aged mice after neopterin treatment slightly increased to reach 122% of the pretreatment level during the first 24 h of treatment and then continuously decreased to reach 38% of the pretreatment level on day 14, which was followed by a further increase to 69% of the pretreatment level (Figure 8b).
Effect of neopterin on the gene expression level of GM-CSF in the bone marrow of young and aged mice over time. The expression level of GM-CSF in femoral bone marrow cells derived from young (a) and aged (b) mice was evaluated on days 0, 1, 7, 14 and 21 after a single intravenous injection of 4.0 mg/kg bw neopterin. Results are expressed as a ratio to each value of non-treated young and aged mice. Each bar represents the mean ± SD obtained from triplicate experiments. *P < 0.05, ‡
P < 0.005 versus Control. GM-CSF, granulocyte-macrophage colony-stimulating factor
Discussion
Neopterin enhances myelopoiesis, but suppresses B-lymphopoiesis as well as erythropoiesis, by activating stromal cells. 6,21–23 These phenomena are identical to those observed during an acute inflammatory process and further suggested that neopterin produced by macrophages during inflammation is biologically active against hematopoiesis in an inflammatory process. We previously demonstrated that the hematopoietic response of aged mice to neopterin was milder than that of young mice. 23,24 Thus, there was significantly lower promotion of myelopoiesis and lower suppression of B lymphopoiesis in aged mice treated with neopterin compared with young mice.
When young and aged mice in this study were treated with neopterin, augmentation of myelopoiesis was limited in the aged mice compared with that in the young mice (Figures 4a and b), which is consistent with our previous report. 24 However, in contrast, the suppression of erythropoiesis following neopterin treatment was more prolonged in aged mice than in young mice (Figures 4a and b). We reported previously that neopterin facilitated myelopoiesis in the BM of young C57BL/6J mice by suppressing erythropoiesis. 6 The responses of young SAMP1 mice to neopterin are compatible with those of young C57BL/6J mice, which suggests that the regulation mechanisms observed in young C57BL/6J mice also work in the young SAMP1 mice. However, the responses of aged SAMP1 mice are quite different from those in young SAMP1 mice, which suggests the additional regulation mechanism for myelopoiesis and erythropoiesis may also work simultaneously in SAMP1 mice.
Epo is well known to be a key factor for the regulation of erythropoiesis. The production of Epo is decreased in inflammation, which is one of the causes of anemia during inflammation. 25 It has also been reported that neopterin reduces Epo production in the kidney. 26 We therefore first investigated the effect of neopterin on Epo production in young and aged mice. Although the serum Epo concentration was decreased in young mice treated with neopterin as previously reported, 26 no decrease in the serum Epo concentration was observed in aged mice treated with neopterin (Figure 5). It therefore seems likely that the prolonged decrease in erythropoiesis in the aged mice treated with neopterin was not due to a decrease in Epo production but must be due to some other cause.
Second, we investigated the difference in the cytokine response of BM stromal cells from young and aged mice to neopterin. The gene expression level of TNF-α, which is a negative regulator of erythropoiesis, 16 was up-regulated in both young and aged mice after neopterin treatment (Figures 6a and c). Furthermore, the degree of TNF-α up-regulation did not differ between young and aged mice. The gene expression of IL-11, which is a positive regulator of erythropoiesis, 17,18 was also rapidly up-regulated in young mice during the first 24 h after neopterin treatment and remained up-regulated until day 21 after treatment (Figure 6b). However, in contrast, in aged mice, although IL-11 expression was up-regulated during the first 24 h of treatment, it was rapidly down-regulated thereafter (Figure 6d). The combined data, therefore, unexpectedly suggest that the prolonged suppression of erythropoiesis in aged mice may be due to a decrease in the production of a positive regulator rather than an increased production of a negative regulator. This change in the balance of positive- and negative-regulation of erythropoiesis resulted in dominant-negative regulation of erythropoiesis.
The gene expression level of IL-6, which is a positive regulator of immature hematopoietic cells, 19 was up-regulated in both young and aged mice after neopterin treatment (Figure 7). However, the expression level of IL-6 remained up-regulated in young mice until day 21 after neopterin treatment, whereas aged mice failed to maintain up-regulated levels of IL-6. Since both IL-11 and IL-6 stimulate more immature hematopoietic progenitor cells, the combined data suggest that the cause of prolonged erythropoiesis suppression in aged mice after neopterin treatment may be due to decreased stimulation, not only of erythroid progenitor cells but also of more immature hematopoietic progenitor cells. These effects may impair the differentiation of immature hematopoietic progenitor cells into erythroid progenitor cells, thereby resulting in a deficit of erythroid progenitor cells. The gene expression level of GM-CSF, which is a positive regulator of myelopoiesis, 20 was markedly up-regulated in young, but not in aged, mice after neopterin treatment (Figure 8). Thus, the impairment of promotion of myelopoiesis in aged mice after neopterin treatment is also due to age-related functional impairment of stromal cells.
SAMP6, a sub-strain of SAM, is an animal model of senile osteoporosis. Expression of the osteogenic cytokine, IL-11, is decreased in the stromal cells of SAMP6. IL-11 transcription largely depends on AP-1 transcription factors, whose activities are decreased in SAMP6 as well as in aged ICR mice. 27,28 Thus, a decrease in AP-1 activity in aged SAMP1 mice may have been the reason why up-regulated IL-11 gene expression was not maintained in these mice after neopterin treatment.
The reason why anemia during inflammation is more serious for the elderly than for non-elderly adults was previously proposed to be due to the fact that erythroid progenitor cells in the elderly were unresponsive to Epo. 29 However, our study suggests that age-related functional impairment in stromal cells also may induce serious anemia in the elderly during inflammation.
Neopterin treatment resulted in persistent defect of BM erythropoiesis in aged mice as compared with young mouse, but no effect of Ht was found. The reasons why the Ht in aged mice was not affected may be, first, that administration of neopterin is not by continuous intravenous infusion but by an one-shot intravenous injection, thus the effect of neopterin is short duration; second, the comparatively longer life span of erythrocytes. When young C57BL/6J mice were treated with neopterin, erythropoiesis was suppressed in the spleen as well as the BM. However, the recovery of erythropoiesis was more rapid in the spleen than in the BM. 30 Thus, it is possible that rapid recovery of erythropoiesis in the spleen of aged SAMP1 mice after neopterin treatment may also compensate the suppressed erythropoiesis in the BM.
Serum neopterin concentrations in human are increased with age, 31,32 and there is an association between higher neopterin levels and declining hemoglobin. 33 Regarding the relevance of the findings of the present study to human clinical conditions, because serum neopterin in the steady state in mice is not detected whereas that in humans is inherent, the response to neopterin in murine species might be exaggerated, which could be a limitation. However, data obtained from mice bred under conventional conditions other than data obtained under germ-free conditions were not reported previously. In contrast, the clinical conditions of an elevated neopterin concentration associated with low counts of red blood cells and a limited increase in the number of myelopoietic cells, are also possible relevant clinical conditions in the elderly due to the effect of neopterin.
Footnotes
ACKNOWLEDGEMENTS
We thank Sonoko Araki and Miyuki Yuda for technical assistance, and Minako Kenjyo and Erika Tachihara for assistance in the maintenance of SAMs at the experimental animal facilities. This work was supported in part by a Grant-in-Aid for Science Research C from the Japan Society for the Promotion of Science, 2010 Research Grant of 50th Anniversary Memorial Fund, Nihon University School of Medicine and the Strategic Research Base Development Program for Private Universities, which is subsidized by MEXT.