
Abstract
The mitochondrial phospholipid cardiolipin (CL) is required for oxidative phosphorylation. Oxidation of CL results in the disruption of CL-cytochrome c binding and the induction of apoptosis. Large variations in the acyl-chain residues of CL have been reported, but evidence as to whether these variants exert distinct biological effects has been limited. We have studied the acyl-chain composition of CL in lymphocytes, and found marked differences between highly and slowly proliferating cells. In fast growing cells, we detected a decreased number of double bonds, and a higher amount of C16 acyl-chain residues in CL, compared with slower growing cells. However, fewer C18 acyl-chain residues were found in CL from fast growing cells compared with slower proliferating cells. Our results suggest a functional link between acyl-chain composition of CL and cell proliferation.
Introduction
Cardiolipin (CL) is a mitochondrial phospholipid required for oxidative phosphorylation. This anionic phospholipid consists of two phosphatidyl residues linked by a glycerol moiety. 1 CL is almost exclusively located in the mitochondrial membrane system, where it serves an important role in membrane structure and mitochondrial function. 2 The composition of acyl-chain residues of cardiolipin has been found to be highly variable. Mouse brain mitochondria alone have been found to contain more than 100 different molecular species of CL. 3 This complexity derives from both synthesis and acyl-chain remodeling processes. Incomplete assembly of CL leading to significant deviation from physiological CL composition correlates with abnormal mitochondrial function. Upregulation of ALCAT1, a lyso-CL acyltransferase, by oxidative stress or diet-induced obesity, results in the generation of CL molecular species that are highly vulnerable against oxidative stress associated with respiratory chain complex dysfunction. 4 Likewise, a TAT1ACB1 double deletion mutant mouse strain exhibiting deficiencies in both CL acyl-chain remodeling and fatty acid elongation is associated with decreased acyl-chain length and increased monolyso-CL levels. 5 These variations in the distribution of molecular CL species and CL content are accompanied by decreased activities of the prohibitin-m-AAA protease complex, the α-ketoglutarate dehydrogenase complex and respiratory chain supercomplexes. A correlation between changes in the distribution of molecular CL species and mitochondrial function has also been reported for Barth syndrome, 6 diabetes 7,8 and several neurodegenerative diseases. 9
Furthermore, CL content and distribution of molecular CL species differ between tumor cells and non-tumor cells. Fatty acid residues of CL from tumor cells are typically short and have a high degree of saturation which is characteristic of immature CL. 10,11 It has been shown that the degree of saturation and the length of CL acyl-chain residues are relevant for mitochondrial respiration. 12,13 Rat rhabdomyosarcoma tumor cells that failed to exit the cell cycle when cultured in differentiation medium have been shown to be equipped with abnormal CL. 14 There is, however, no information available about the relationship between CL composition and cell proliferation.
To test whether proliferation is related to CL composition, we analyzed CL molecular species from lymphocytes with different proliferation rates by mass spectroscopy. To this end, we used non-stimulated versus in vitro-activated peripheral T-lymphocytes from healthy donors and lymphocytes from patients with chronic lymphocytic leukemia (CLL) in comparison to T-acute lymphocytic leukemia (T-ALL). These entities were chosen for their markedly different proliferation rates. CLL is characterized by apoptosis defects leading to slow accumulation of malignant T-cells. After diagnosis in early stages, median survival exceeds 15 years. In contrast, acute lymphoblastic leukemia blasts show a high proliferation rate. Without treatment, death occurs usually within weeks or months after diagnosis. In addition, we analyzed CL acyl-chain residue composition in the interleukin 2 (IL-2)-dependent T-cell line, SeAx. Our data reveal a strong correlation between the rate of cell proliferation and the fatty acid composition of molecular CL species, in particular the acyl-chain length and the amount of double bounds.
Materials and methods
Chemicals
Internal cardiolipin standard ((C14:0)4-CL) was from Avanti Polar Lipids, Inc (Alabaster, AL, USA), the cardiolipin standard was from bovine heart and all other reagents were from Sigma (Munich, Germany).
Cells
Four clinically well-characterized bone marrow specimens from patients exhibiting T-acute lymphoblastic leukemia (n = 4) and CLL (n = 4) were included in the study. Furthermore, peripheral blood samples from four healthy individuals were used for T-cell activation and proliferation analyses. Leukemia diagnosis was established according to standard criteria. The amount of tumor cells was above 80% in most samples and was estimated on morphology and immunophenotyping. The use of human material was performed in accordance with the Declaration of Helsinki. Cells were isolated using Ficoll-Hypaque density centrifugation, washed with buffered saline twice and stored as cell pellet at −80°C until analysis. Purified human T-cells were prepared using the Pan T-Cell Isolation Kit II (Miltenyi, Bergisch Gladbach, Germany) and stimulated by the T-cell Activation/Expansion Kit (Miltenyi) according to the manufacturer's instructions. Cells were cultured in RPMI 1640 medium supplemented with 1 mmol/L sodium pyruvate, 10% fetal calf serum (PanBiotech, Aidenbach, Germany), 20 U/mL recombinant human IL-2 (Sigma) and 1× non-essential amino acids (Invitrogen, Darmstadt, Germany).
The human cutaneous T-cell lymphoma-derived cell line established from a patient with Sézary's syndrome, SeAx, 15 was cultured in RPMI 1640 medium (Lonza, Köln, Germany) supplemented with 10% (v/v) fetal bovine serum (Invitrogen), 100 units/mL penicillin and 0.1 mg/mL streptomycin (PAA, Linz, Austria) in a humidified atmosphere at 37°C and 5% CO2. Cell proliferation rates were modified by adding different concentrations of IL-2 (1, 5, 10, 30, 100 or 150 IU/mL) to the culture medium. IL-2-dependent modulation of SeAx cell proliferation was determined by direct cell counting using Neubauer chambers. Cells from three independent samples were counted three times by two independent investigators 72 h after seeding.
For CL analyses, 3 × 10⁶ cells were seeded into 75-cm2 cell culture flaks containing 20 mL of medium with/without the addition of different concentrations of IL-2. After 72 h of culture, cells were harvested by trypsination, washed in phosphate-buffered saline and pelleted by centrifugation.
Quantification of molecular CL species by electrospray ionization tandem mass spectrometry
Extraction: CL was extracted from the samples by a modified Folch extraction procedure. 16 Briefly, 50 ng of tetra-myristoyl-CL ((C14:0)4-CL; Avanti Polar Lipids, Inc) was added as the internal standard to 10 μL incubation mixture. The extraction of CL was carried out with chloroform/methanol (2/1) containing 0.05% butyl-hydroxy-toluene as antioxidant. Aqueous and lipid phases were separated by adding 0.01 mol/L HCl followed by intensive shaking and subsequent centrifugation. The lower lipid phase was collected, dried under nitrogen atmosphere and acidified as described by Schlame et al. 16 Ice-cold methanol (2 mL), chloroform (1 mL) and 0.1 mol/L HCl (1 mL) were added to the sample. The solution was intensively mixed and incubated for five minutes on ice. Phase separation was achieved by addition of 1 mL of CHCl3 and 1 mL of 0.1 mol/L HCl. The chloroform phase was recovered as the CL-containing sample. Finally, the sample was dried under nitrogen, dissolved in 0.8 mL CHCl3/CH3OH/H2O (50/45/5, v/v/v), mixed and filtered over 0.2-μm polytetrafluoroethylene membranes. This sample was ready for immediate electrospray ionization tandem mass spectrometry (ESI-MS/MS) analysis according to Valianpour et al. 17
High-performance liquid chromatography tandem mass spectrometry (HPLC-MS/MS): A TSQ Quantum Discovery Max (Thermo Fisher Scientific GmbH, Dreieich, Germany) was used in the negative ion ESI mode. The HPLC system consisted of a Surveyor MS quaternary narrow bore pump with integrated vacuum degasser and a Surveyor autosampler. The autosampler tray temperature was maintained at 8°C. Ten microliters of the lipid extract dissolved in chloroform/methanol/water (50/45/5) was injected (in partial loop mode) and CL was separated by using a LiChroCart column (125 × 2 mm), LiChrospher Si60 (5 μm particle diameter; Merck, Darmstadt, Germany) and a linear gradient between solution A (chloroform) and solution B (methanol/water, 9:1 [v/v]). Both solutions additionally contained 0.1 mL/L of 25% aqueous ammonia. The gradient was as follows: 0–0.2 min, 92% A, 8% B, 0.2–4.5 min, 92% A to 30% A and 8% B to 70% B, 4.5–6 min, 30% A, 70% B, 6–6.5 min, 30% A to 92% A, 70% B to 8% B, 6.5–11 min, 92% A, 8% B. The flow rate was 300 μL/min.
The total time of analysis was 11 min. The eluate between 0.3 and 6 min was introduced into the mass spectrometer. Nitrogen was used as the nebulizing gas and argon was used as the collision gas at a pressure of 1.5 mTorr. The spray voltage was 3.5 kV, the ion source capillary temperature was set at 375°C and the cone-voltage was 30 V. Daughter fragments from the doubly-charged parent derived from (C18:2)4-CL with m/z (mass to charge ratio) 723.6 ((M–2H)2−/2) were obtained using a collision energy of 36 eV. This molecular CL species and the internal standard (m/z 619.6) were analyzed by mass transfer reaction monitoring their doubly charged ions and their respective fatty acids, linoleic acid m/z 279.2 and myristic acid m/z 227.2, using the selected reaction monitoring (SRM) mode. The same approach was used for parent and daughter fragments of other molecular CL species. The quantity of these molecular CL species was related to (C18:2)4-CL.
To identify CL species, we first separated CL by thin-layer chromatography. In the next step, we used the separated CL to run parent scans for C16:0, C16:1, C18:0, C18:1, C18:2, C18:3, C20:3 and C20:2 quantitatively occurring in lymphocytes. The parent peaks found were used to run product scans to find other fatty acid residues and to characterize CL composition. At the end of this procedure, we identified 17 CL species listed in the tables. The analysis was performed in triplicate for each sample.
Oxidized CL ((C18:2)3monohydroxylinoleic acid-CL) was measured in the SRM mode as a transition from m/z 731.6 to m/z 279.2 (linoleic acid).
Determination of the amount of double bounds in the CL acyl-chain residues
In the first step, the molar mass and the content (in micrograms) of each individual CL molecular species were used to calculate the amount of this CL molecule in nmol/μg total CL. Subsequently, these values were multiplied by the number of double bounds of the particular CL molecular species and summarized to get the total amount. This calculated amount of double bounds of the total CL is given in nmol/μg total CL.
Determination of the amount of CL acyl-chain residues with distinct number of carbon atoms
First, the amount of each CL molecular species was calculated as outlined above. For C-16, C-18 and C-20 acyl-chain residues, the number of these fatty acid residues in each CL molecular species was determined (between zero and four), multiplied with the amount of this CL species and summarized over all CL molecular species. The amount of acyl-chain residues is given in nmol/µg total CL.
Determination of protein
The cells were dissolved in 1% dodecyl sulfate in the presence of 0.1 mol/L NaOH. The amount of protein was determined by applying the method of Lowry et al. 18 using bovine serum albumin as the standard.
Statistics
Different conditions were compared with analysis of variance for repeated measures or for global nonparametric tests with Friedman test. The global univariate test with Greenhouse–Geisser correction was followed by post hoc pairwise comparisons (unadjusted or with Bonferroni correction). Alternatively, post-comparisons of selected pairs were performed with Wilcoxon matched-pairs signed-rank test (unadjusted).
Results
Cell proliferation
To investigate the relationship between cell proliferation and the distribution of molecular CL species, three distinct cellular systems with divergent cell proliferation rates were evaluated. In a first set of experiments, T-lymphocytes were isolated from peripheral blood of healthy donors and cell proliferation was analyzed with resting T-cells in comparison to T-cells activated by using the T-cell Activation/Expansion Kit (Miltenyi, see Materials and methods section). The respective cell count at different periods of time after activation is depicted in Figure 1a. Data from T-cells of four healthy donors have been shown. Within 96 h of stimulation, the cell number increased from 5 × 10⁶ cells to 17.9 ± 1.9 × 10⁶ cells. After six days of cultivation with and without stimulation, samples were withdrawn for CL analysis. The second set of experiments was designed to study cell proliferation and distribution of molecular CL species in the IL-2-dependent T-cell line, SeAx. SeAx cells, when subjected to different concentrations of IL-2, showed a clear dose-dependent rate of proliferation (Figure 1b). Maximum proliferation was observed with 100 IU/mL of IL-2, whereas the lowest proliferation rate was obtained with 1 IU/mL IL-2. Samples for CL analysis were withdrawn from cultures subjected to 1 and 100 U IL-2, respectively.
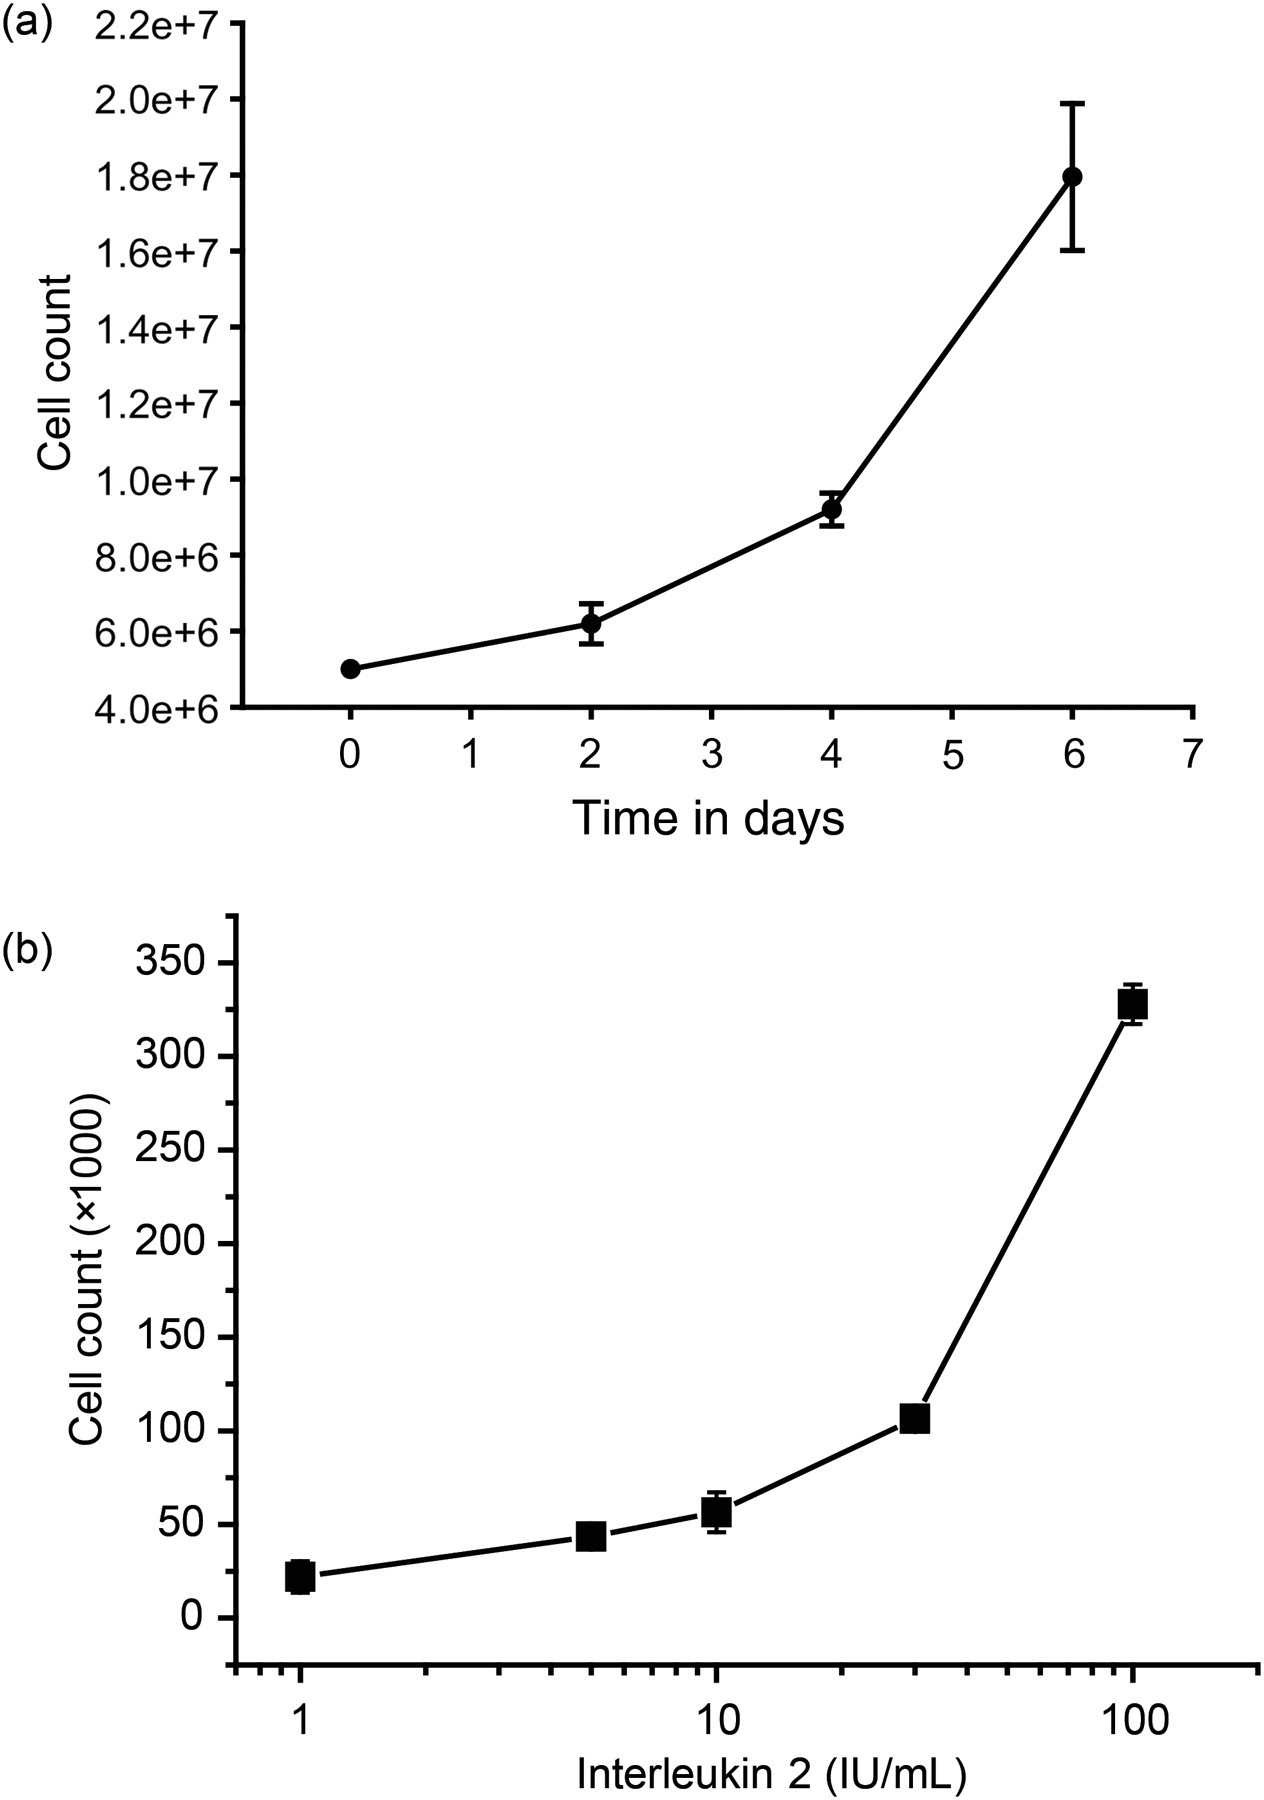
(a) Development of cell number after stimulation of lymphocytes of healthy probands (mean ± SEM); four independent experiments (six replicates each). (b) Dose-dependent increase of SeAx cell proliferation in response to increasing amounts of interleukin 2 (mean ± SEM); four independent experiments (six replicates each)
The third set of experiments was performed with malignant lymphocytes derived from bone marrow specimens of patients suffering from acute or chronic lymphatic leukemia. The cells chosen for this study reflect two poles of differentiation and proliferation. Compared with acute lymphoblastic leukemia, doubling time in CLL cells is much lower. Furthermore, the differentiation status differs between these two entities, with immature cells in T-ALL and more differentiated cells in CLL. Samples from the cell suspensions were used for CL analysis.
CL content and distribution of molecular CL species
Data on the CL content and the identity of molecular CL species from resting and ex vivo-activated peripheral T-cells as well as from cultured SeAx cells are summarized in Table 1. In the first column, the molecular CL species corresponding to selected m/z ratios are indicated. We did not distinguish between two possible molecular CL species in five cases because of identical m/z ratio. This holds true for ((C18:2)2(C18:1)(C16:1))-CL and ((C18:2)3(C16:0))-CL with m/z of 711.6, ((C18:1)2(C18:2)(C16:1))-CL and ((C18:2)2 (C18:1)(C16:0))-CL with m/z of 712.6, ((C18:2)3(C20:3))-CL and ((C18:2)2(C18:1)(C20:4))-CL with m/z of 736.6, ((C18:2)3(C20:2))-CL and ((C18:2)2(C18:1)(C20:3))-CL with m/z of 737.6 and ((C18:2)3(C20:0))-CL and ((C18:1)2(C18:2)(C20:2))-CL with m/z of 739.6, respectively. The numbers in the cells of the table represent the quantity of CL molecules with a defined m/z ratio in percent of total CL which is also given in the table for each treatment in micrograms of cardiolipin per milligram cellular protein. Although we did not separate CL species with identical m/z ratio in five cases, important information could be extracted from the data. Both the amount of double bounds and the amount of fatty acid residues of a certain acyl-chain length could be exactly determined.
Cardiolipin composition in T-cells from healthy probands and in SeAx cells
Cardiolipin (CL) was analyzed by applying LC-MS/MS as described in Materials and methods. Total cardiolipin is sum of all analyzed molecular CL species. Data are presented as mean ± SD.
*Difference to control is significant with P < 0.05; **Difference to 1 U interleukin 2 (IL-2) is significant with P < 0.05
Activation of peripheral T-cells as well as subjecting SeAx cells to different concentrations of IL-2 not only affected their proliferation rate but was paralleled by significant changes in the amount of CL per milligram cellular protein. However, the direction of changes differed between T-cells and SeAx cells. Whereas the activation of peripheral T-cells decreased their CL content from 6.97 ± 1.62 to 2.59 ± 0.80 μg/mg protein, elevated IL-2 levels resulted in increased CL contents (0.212 ± 0.008 versus 1.351 ± 0.005 μg/mg protein) in SeAx cells. Increased cell proliferation rate was paralleled by significant changes in the distribution of molecular CL species in both cell types. The content of the most abundant molecular CL species in non-tumor cells (C18:2)4-CL was dramatically reduced by stimulation of T-cells from 47.67 ± 4.83% to 18.31 ± 2.53%. In contrast, the fraction representing other molecular CL species was increased in stimulated T-cells. The same tendency was observed in stimulated SeAx cells. However, as typical for tumor cells, (C18:2)4-CL was not the most abundant molecular CL species in this cell type. Yet, the fraction of (C18:2)4-CL significantly decreased from 7.4 ± 0.15 to 4.9 ± 0.28% of total CL and the amounts of other molecular CL species were increased (Table 1). Furthermore, stimulation of proliferation was accompanied by an apparent less frequent occurrence of double bounds within the fatty acid residues. This is indicated, for example, by a significant increase in the content of C16:0 and C16:1 fatty acid residues in several molecular CL species. Likewise, the content of C18:1 fatty acid residues was increased in activated T-cells.
To analyze general tendencies in more detail, we calculated the number of double bounds and the content of acyl-chain residues with 16, 18 and 20 carbon atoms, respectively. T-cell activation was paralleled by a significant decrease in the amount of double bounds from 5.20 ± 0.02 to 4.80 ± 0.05 nmol/μg CL. Additionally, activation of T-cells caused a significant increase in the amount of C16 acyl-chain residues from 0.03 ± 0.004 to 0.19 ± 0.02 nmol/μg CL, together with a significant reduction in the amount of C18 acyl-chain residues from 2.48 ± 0.04 nmol/mg CL to 2.34 ± 0.02 nmol/μg CL. The stimulation of SeAx cells with IL-2 caused similar changes. The amount of double bounds significantly decreased from 0.745 ± 0.02 to 0.711 ± 0.02 nmol/μg CL. Concomitantly, we observed an increase in the amount of C16 acyl-chain residues from 0.072 ± 0.002 to 0.082 ± 0.002 nmol/μg CL, whereas the fraction of C20 acyl-chain residues significantly decreased from 0.017 ± 0.001 to 0.014 ± 0.001 nmol/μg CL in response to stimulation of the cells with 100 U IL-2. Amounts of C18 acyl-chain residues were not different under these conditions.
Next, we analyzed the observed relation between cell proliferation rate and the distribution of molecular CL species by comparing CLL or T-ALL lymphocytes, as these cells exhibit different proliferation activities and differentiation levels. CL content and distribution of molecular CL species observed for CLL and T-ALL are presented in Table 2. CLL cells contained CL amounts similar to resting T-cells. As observed with activated T-cells, the less differentiated and highly proliferating T-ALL cells contained less CL (6.14 ± 1.17 versus 0.36 ± 0.12 μg/mg protein). Interestingly, the differences in the molecular CL species distribution between resting and activated T-cells were similar to those observed between lymphocytes of patients with CLL and patients with T-ALL, respectively. The content of (C18:2)4-CL was much lower in lymphocytes from patients with T-ALL (23.23 ± 5.96 versus 47.41 ± 4.33% of total CL). The content of other molecular CL species was altered in the opposite direction. This phenomenon was also observed comparing resting and activated peripheral T-cells from healthy donors.
Cardiolipin composition in lymphocytes of individuals with and without leukemia
Cardiolipin (CL) was analyzed by applying LC-MS/MS as described in Materials and methods. Total cardiolipin is sum of all analyzed molecular CL species; none, T-cells from healthy donors. Data are presented as mean ± SD
*Difference to ‘none’ is significant with P < 0.05
CLL, chronic lymphocytic leukemia; T-ALL, T-acute lymphocytic leukemia
Lymphocytes with low (CLL) and high (T-ALL) proliferation activity revealed that T-ALL lymphocytes contained fewer double bounds within the molecular CL species (4.65 ± 0.14 nmol/μg CL versus CLL: 5.07 ± 0.05 nmol/μg CL). As observed with peripheral T-cells from healthy donors, cells with a higher proliferation rate contained more C16 acyl-chain residues (0.081 ± 0.021 nmol/μg CL for T-ALL versus 0.044 ± 0.011 nmol/μg CL for CLL). On the contrary, the amount of C18 acyl-chain residues was lower in T-ALL cells (2.47 ± 0.01 nmol/μg CL for T-ALL versus 2.51 ± 0.01 nmol/μg CL for CLL).
Oxidation of CL
To analyze the oxidation of CL in T-cells, we measured (C18:2)3monohydroxylinoleic acid-CL. (C18:2)4-CL is the most abundant molecular CL species in resting T-cells. Moreover, polyunsaturated acyl-chain residues with bis-allylic hydrogens such as linoleic acid can easily become oxidized, whereas monounsaturated as well as saturated acyl-chain residues are largely resistant against oxidation. 19 Therefore, (C18:2)3monohydroxylinoleic acid-CL can be considered as a relevant marker of CL oxidation. We expressed the degree of CL oxidation as (C18:2)3monohydroxylinoleic acid-CL related to the sum of (C18:2)3monohydroxylinoleic acid-CL plus (C18:2)4 in percent. Stimulation of T-cells caused an increase in the relative amount of (C18:2)3monohydroxylinoleic acid-CL from 0.29 ± 0.03% to 2.53 ± 0.42%. A similar tendency was observed when comparing CLL and ALL T-cells (0.52 ± 0.13% versus 0.95 ± 0.22%). In contrast, the stimulation of SeAx cells with IL-2 had no significant effect on the relative amount of (C18:2)3monohydroxylinoleic acid-CL (9.25 ± 0.53%, 1 U IL-2 versus 12.05 ± 1.5%, 100 U IL-2).
Discussion
The aim of this study was to verify a possible functional linkage between CL and cellular proliferation. To address this question, we modified cell proliferation and analyzed content and distribution of molecular CL species. Three different and independent cellular systems were used to evaluate any general correlation between CL amount or composition and cellular proliferation. First, the activation of resting human T-cells from peripheral blood of healthy donors by means of the T-cell Activation/Expansion Kit (Miltenyi) led to a strong induction of cell proliferation. Second, proliferation of the IL-2-dependent SeAx T-cell line was actively modified by exposing cells to different concentrations of IL-2. Finally, malignant lymphocytes from chronic and acute lymphatic leukemia patients, respectively, representing typical but different degrees of cell differentiation and cell proliferation, were analyzed with respect to composition of cellular CL. The comparison of the distribution of molecular CL species between cells with high and low proliferation rates, however, revealed characteristic differences that were common for all three cellular systems investigated. Consistently, high proliferation rates were accompanied by a decreased number of double bounds, larger amounts of C16-acyl-chain residues and a lower content of C18 acyl-chain residues when compared with slow proliferating cells. These findings are in line with data by Kiebish et al. who demonstrated that fast growing tumors contain increased amounts of C16:0 and C16:1 acyl-chain residues as is typical for immature CL. 20 In our study, the most striking changes regarded the content of (C18:2)4-CL. This regularly observed correlation between the distribution of molecular CL species and cell proliferation points towards a possible link between CL metabolism and cell proliferation.
So far, a regulatory role of CL in the process of cellular proliferation has been suggested by the pioneering work of Struchkov et al. 21 for nuclear CL. This group demonstrated profound changes in the amounts of CL fractions bound to DNA during different phases of the cell cycle, with increased DNA-bound CL in the S-phase and lower levels in G2. Interestingly, the content of loosely bound CL correlated with the amount of transcriptionally/replicatory active euchromatin DNA. The authors also observed a decrease in nuclear CL content in malignant cells.
Since CL is localized within the nucleus and the mitochondrial membrane system, it can affect nucleus-regulated proliferation as well as the executing part of apoptosis. 21–24 An important trigger of apoptosis is oxidative stress. CL is the most unsaturated phospholipid in the human body 25,26 and is therefore especially prone to (per)oxidation. 27,28 Oxidation of CL facilitates the release of cytochrome c into the cytosol, triggering the mitochondrial pathway of apoptosis. 29,30 Besides binding to cytochrome c, CL has been demonstrated to associate with further members of the apoptotic machinery including Bid and caspase-8. 31,32 On this background, it seems reasonable to assume that a relatively low content of double bonds in CL as observed in this study for fast proliferating cells contributes to an increased resistance against oxidative stress paralleled by protection from apoptosis.
Kim et al. 33 have shown that exposure of CL to reactive oxygen species generated by 2,2′-azobis (2-methylpropionamidine) dihydrochloride leads to the formation of monohydroperoxides predominantly. Furthermore, polyunsaturated acyl-chain residues of CL are preferred targets for CL oxidation. On the other hand, it has been shown that an increase in hydrogen peroxide concentration accompanies the stimulation of cell proliferation. 34 The increase in oxidation of linoleic CL residues as observed here in response to stimulation of T-cells of healthy donors and in T-ALL cells possibly reflects an increase in hydrogen peroxide concentration that is required for cell proliferation. However, the concomitant reduction of the content of (C18:2)4-CL in fast proliferating cells together with the reduction of the amount of double bounds may represent a counterbalancing mechanism aimed at limiting the apoptotic effects of reactive oxygen species.
It has been shown that stimulation of T-cell proliferation requires substantial changes in cellular metabolism including lipid metabolism. 35 During stimulated clonal expansion, T-cells meet their energy demand exclusively by gycolysis (Warburg effect). 36 Thus, lipids used for membrane synthesis are generated de novo from glucose and this is despite the cells' ongoing ability to take up lipids from the extracellular milieu. 37 In this way, switching from catabolic to anabolic metabolism is performed. Likewise, Bensinger et al. 38 have shown that tightly regulated changes in lipid metabolism are required for T-cell proliferation. Our data clearly demonstrate consistent alterations in CL composition in dependence of the proliferation rate. Since the composition of the medium has not been changed during culturing T-cells, alterations in CL metabolism should result from intrinsic regulation of CL synthesis as part of general changes in lipid metabolism. Such changes have been shown to be mediated to a significant extent via activation of the Akt signaling pathway that leads to, e.g. the activation of ATP citrate lyase (ACL), a key enzyme providing acetyl-CoA for lipid synthesis. 39 Inhibition of ACL, thus, is associated with an inhibition of cell proliferation. 40 Therefore, T-cell activation and the resulting metabolic switch could also include CL de novo synthesis and remodeling. In this context, changes in synthesis of other phospholipids including phosphatidylethanolamine and phosphatidylcholine, and phosphatidylglycerol, as well as alterations of triacylglyceride synthesis, fatty acid oxidation, sterol metabolism, elongase and desaturase activities, may all contribute to a diversification of molecular CL species. In this study, we did not address these complex changes of lipid metabolism. This limitation could be overcome by applying extensive lipidomic analyses as has been recently done by Puri et al., 41 who investigated changes in lipid metabolism in non-alcoholic fatty liver disease, and Kiebish et al. 20 who analyzed acyl-chain composition of phospholipids in the mitochondria of normal and tumor neuronal cells. Thereby, future work could provide substantial new information concerning the mechanism of the regulation of CL metabolism during proliferation of T-cells.
We have found a significant decrease in CL content in fast proliferating T-cells after stimulation and in cells from T-ALL patients. Hostetler et al. analyzed CL contents in the mitochondria from normal liver, regenerating liver and hepatoma cells without detecting dramatic changes in phospholipid content including CL. 42 On the other hand, Kiebish et al. 20 have found significant differences in the CL content between mitochondria from brain and brain tumors. The authors related those changes in CL content to changes in mitochondrial energy metabolism. From these observations, it could be conceived that mitochondrial CL contents exhibit tissue specificity to some extent. Since fast proliferating cells do not use oxidative phosphorylation, our study was not focused on mitochondrial CL content. Further work is required to address this question.
Our data are suggesting that the observed changes in the distribution of molecular CL species are required for acceleration of T-cell proliferation. In support of this hypothesis, Sun and co-workers 43 demonstrated an inhibition of prostate cancer cell growth by inhibiting Ca2+-independent phospholipase A2, an enzyme which is part of the CL remodeling pathway. Alternatively, a causal link between altered composition of molecular CL species and cellular proliferation rate could be verified by exposing cells to distinct fatty acids. Exposure of fibroblasts from patients with Barth's syndrome to exogenously administrated linoleic acid dramatically increased the content of linoleic acid containing molecular CL species. 44 Recent data indicate that administration of fatty acids could be a suitable tool to influence the proliferation (and function) of T-cells. Both dietary α-linolenic acid and direct exposure of T-cells to α-linolenic acid strongly restricted T-cell proliferation besides inhibiting cytokine expression. 45
Finding other key steps in the regulation of CL metabolism would provide an additional new target for improving immune response and cancer therapy.