
Abstract
Antioxidant-based treatments have emerged as novel and interesting approaches to counteract fat accumulation in obesity and associated metabolic disturbances. Adipocytes from rats that were fed on chow or high-fat diet (HFD) for 50 d were isolated (primary adipocytes) and incubated (72 h) on low (LG; 5.6 mmol/L) or high (HG; 25 mmol/L) glucose levels, in the presence or absence of 1.6 nmol/L insulin and 200 μmol/L vitamin C (VC). Adipocytes from HFD-fed animals presented lower insulin-induced glucose uptake, lower lactate and glycerol release, and lower insulin-induced secretion of some adipokines as compared with controls. HG treatment restored the blunted response to insulin regarding apelin secretion in adipocytes from HFD-fed rats. VC treatment inhibited the levels of nearly all variables, irrespective of the adipocytes’ dietary origin. The HG treatment reduced adipocyte viability, and VC protected from this toxic effect, although more drastically in control adipocytes. Summing up, in vivo chow or HFD intake determines a differential response to insulin and glucose treatments that appears to be dependent on the insulin-resistance status of the adipocytes, while VC modifies some responses from adipocytes independently of the previous dietary intake of the animals.
Introduction
Excessive body fat accumulation can lead to a number of associated clinical complications such as type 2 diabetes, metabolic syndrome features, cardiovascular diseases and inflammatory disturbances, among others. 1 These adverse clinical manifestations have been linked to impaired production and secretion of endogenous products by enlarged adipocytes or the accompanying macrophages from the white adipose tissue (WAT) stroma-vascular fraction. 1 Actually, several adipocytokines and inflammatory products derived from this tissue (tumor necrosis factor [TNF]-α, interleukin-6, monocyte chemoattractant protein-1, inducible nitric oxide synthase) have shown positive correlations with body adiposity. 2 Besides the pro-inflammatory secretion by WAT, this tissue also produces numerous adipokines that may have important local and systemic effects. 3 Among them, leptin, which has been associated with the control of food intake and energy expenditure, 4 and apelin, which is up-regulated in obesity and modulated by insulin and TNF-α treatments, 5,6 are considered metabolically relevant.
On the other hand, mitochondrial dysfunctions and over-production of reactive oxygen species (ROS) have been related with obesity. 7 In this sense, elevated oxidative stress in obese patients 8 and in overweight animal models 9 has been reported. Thus, induced monocyte migration to the adipose tissue and high secretion levels of some WAT-secreted adipokines could be implicated in obesity-associated ROS overproduction, 9 linking the pathogenic secretion pattern of WAT with an enhanced oxidative stress status. 10
Furthermore, it has been observed that there is a negative association between higher intake of the dietary antioxidant vitamin C (VC) and the occurrence of hypertension, gallbladder disease, stroke, cancers and atherosclerosis, 11 and also with obesity in humans and animals. 12–14 Among the possible beneficial effects of ascorbic acid on obesity-related mechanisms, it has been suggested that this vitamin may: (a) modulate adipocyte lipolysis; 15–17 (b) regulate the glucocorticoid release from adrenal glands; 18 (c) inhibit glucose metabolism and leptin secretion on isolated adipocytes; 19 (d) lead to an improvement in hyperglycemia and decrease glycosylation in obese-diabetic mice; 20 and (e) reduce the inflammatory response. 21,22
Taking all these findings into account, the present work aimed to analyze whether VC is directly implicated in the metabolic response and in the expression/secretion pattern of leptin and apelin, two important adipokines, in isolated adipocytes from lean or diet-induced obese rats, focusing on the possible differential responses of primary adipocytes that were isolated from high-fat-diet (HFD)-fed animals as compared with control lean animals.
Materials and methods
Materials
Dulbecco's modified Eagle's medium (DMEM), 100× minimal essential medium (MEM) non-essential amino acids, penicillin/streptomycin, heat-inactivated fetal bovine serum (FBS), 10× MEM, nystatin, Trizol reagent and M-MLV reverse transcriptase were obtained from Invitrogen (Paisley, UK). Bovine serum albumin (BSA), HEPES, insulin and 2′,7′-dichlorofluorescein (DCFH) were all obtained from Sigma-Aldrich Company (St Louis, MO, USA). Collagen (Purecol) was purchased from Nutacon (Leimuiden, The Netherlands). Type I collagenase was supplied by Worthington Biochemical Corporation (Lakewood, NJ, USA), and VC by Panreac Quimica (Barcelona, Spain). Glycerol-3-phosphate dehydrogenase (GPDH), glycerol kinase (GK), adenosine triphosphate (ATP) and nicotinamide adenine dinucleotide (NAD) were obtained from Roche Diagnostics (Mannheim, Germany).
Animals and dietary treatment
Composition of the experimental diets
HFD, high-fat diet; MUFA, monounsaturated fatty acids; PUFA, polyunsaturated fatty acids; SFA, saturated fatty acids
Serum measurements
Circulating glucose (HK-CP kit; ABX Diagnostic, Montpellier, France), total cholesterol (Cholesterol CP kit; ABX Diagnostic), high-density lipoprotein (HDL) cholesterol (HDL Direct CP kit; ABX Diagnostic) and triglyceride concentrations (Triglycerides CP kit; ABX Diagnostic) were measured using automated COBAS MIRA equipment (Roche, Basel, Switzerland). Serum leptin (Linco Research, St Charles, MO, USA), insulin (Mercodia AB, Uppsala, Sweden) and apelin levels (Cusabio Biotech Co, Wuhan, China) were determined by different enzyme-linked immunosorbent assay (ELISA) kits, with an automated Triturus equipment (Grifols International, Barcelona, Spain) as described by the manufacturers.
Adipocyte isolation
Primary cultures were obtained according to protocols described elsewhere.
19
Epididymal WAT (3–4 g) of each rat was minced with scissors in HEPES-phosphate buffer (pH 7.4; containing 5 mmol/L
Isolated adipocyte measurements
Before primary culture, some measures on the isolated adipocytes were performed. In the first instance, intracellular ROS concentrations were determined using DCFH according to a protocol described elsewhere. 19 Briefly, cells were incubated with 10 μmol/L DCFH for 40 min in 37°C/5% CO2, frozen for at least 1 h at −80°C and then lysed with 500 μL of lysis buffer (150 mmol/L NaCl, 0.1% v/v Triton and 10 mmol/L Tris). Finally, 200 μL of each lysate was plated on a 96-well black plate (Labsystems, Barcelona, Spain), and fluorescence intensity was measured with a POLARstar spectrofluorometer plate reader (BMG Labtechnologies, Offenburg, Germany), at an excitation of 485 nm and an emission of 530 nm. Also, the morphological characteristics of the isolated adipocytes were analyzed. Cells were placed on a Neubauer chamber and coupled on an Olympus CK30 microscope (Olympus Corporation, Barcelona, Spain). Then, pictures were taken with an Olympus C-5060WZ Digital Camera (Olympus Corporation) using a Camedia Adapter C5060-ADUS for IUS Microscope (Olympus Corporation) at ×40 magnification. Pictures in TIFF format with 400 × 300 pixels resolution were processed with the Scion Image for Windows software (Scion Corporation, Frederick, MD, USA) for cell number and diameter determinations. Finally, mRNA expressions of apelin and leptin in these isolated adipocytes were also measured according to the protocol described below (please see section on gene expression assays).
Adipocyte culture
After the final 40–50 min incubation, the adipocytes were treated with high (HG, 25 mmol/L; n = 5) and low (LG, 5.6 mmol/L; n = 5) glucose concentrations, in the presence or absence of 1.6 nmol/L insulin and 200 μmol/L VC. Cells were maintained in an incubator at 37°C in 5% CO2. Aliquots of the culture medium and culture plates were collected at 72 h and frozen at −80°C for further assays.
Cell viability assay
The lactate dehydrogenase (LDH) activity (μU/mL) in culture medium is commonly used as an indicator of cell membrane integrity, as well as a measurement of cellular necrosis/apoptosis. 24 Cell viability was measured with the LDH Cytotoxicity Assay Kit according to the supplier's instructions (Cayman Chemical Company, Ann Arbor, MI, USA), and was assessed at the end of the experimental period (72 h) in all treatments.
Culture medium determinations
Glucose utilization was assessed by measuring the concentration of glucose in the medium in each well at 72 h, and then subtracting it from the initial concentration. Lactate production was calculated as the increase of lactate in the medium at 72 h. Glucose and lactate concentrations were measured with the HK-CP kit from ABX Diagnostic and with the
Gene expression assays
Total RNA was isolated from isolated epididymal adipocytes using Trizol (Invitrogen) according to the manufacturer's protocol. Purified total RNA from adipocytes was treated with DNAse (DNAfree kit; Ambion Inc, Austin, TX, USA) and used to generate cDNA with M-MLV reverse transcriptase (Invitrogen). Relative realtime polymerase chain reaction was performed on an ABI PRISM 7000 HT Sequence Detection System (Applied Biosystems, Foster City, CA, USA). Taqman probes for rat leptin, apelin and 18S rRNA were also supplied by Applied Biosystems. Expression levels were normalized by the mRNA levels of the selected internal control, 18S. All procedures were performed according to the protocols described elsewhere. 19
Statistical analyses
Student's t-tests were used for analyzing differences among experimental groups, either for body and biochemical variables of animals, and for measurements performed in isolated adipocytes from rats that were obtained before the primary culture (n = 10), or for measurements performed directly on the primary cultures (n = 5). On primary cultures, after one-way analysis of variance (ANOVA), multiple comparisons using Student's t-tests were performed at three stages: (1) comparison against the control group (without HFD, VC, insulin or HG treatment); (2) comparison against the HFD-treated group (without VC, insulin or HG treatment); and (3) comparison against the HG-treated group (without VC or insulin treatment). For correlation analyses, Pearson correlation coefficients were calculated. All results are expressed as means ± SD. A probability of P < 0.05 was set for determining statistically significant differences. All the analyses were performed using the SPSS 15.0 for Windows software (SPSS Inc, Chicago, IL, USA).
Results
HFD-induced obesity
Body, biochemical and adipocyte-related measurement of rats from both dietary groups
FI, fluorescence intensity; ROS, reactive oxygen species; WAT, white adipose tissue; n.s., not significant; HDL, high-density lipoprotein
Results are expressed by mean ± SEM. Statistical differences were detected applying Student's t-tests
Viability assay
LDH activity in culture medium after the 72-h treatment was measured as an indicator of cell viability (Figure 1; one-way ANOVA, P < 0.001). Cell viability was drastically reduced in adipocytes by HG addition, from both control and HFD-treated animals, although more drastically in control adipocytes. This effect was completely reversed by the addition of VC into the culture media.
Viability assay of the primary culture. The effects of 200 μmol/L vitamin C, 1.6 nmol/L insulin and high (25 mmol/L) or low (5.6 mmol/L) glucose concentrations on 72 h lactate dehydrogenase activity in culture medium of isolated adipocytes from chow-(white bars) or HFD-(black bars) fed rats are shown. Data (n = 5) are expressed as mean ± SD. ***P < 0.001 indicates differences against control group; †
P < 0.05 against HFD-treated-only group; §
P < 0.05, §§
P < 0.01 and §§§
P < 0.001 against each (control and HFD) HG-treated group. HFD, high-fat diet; VC, vitamin C; INS, insulin; HG, high glucose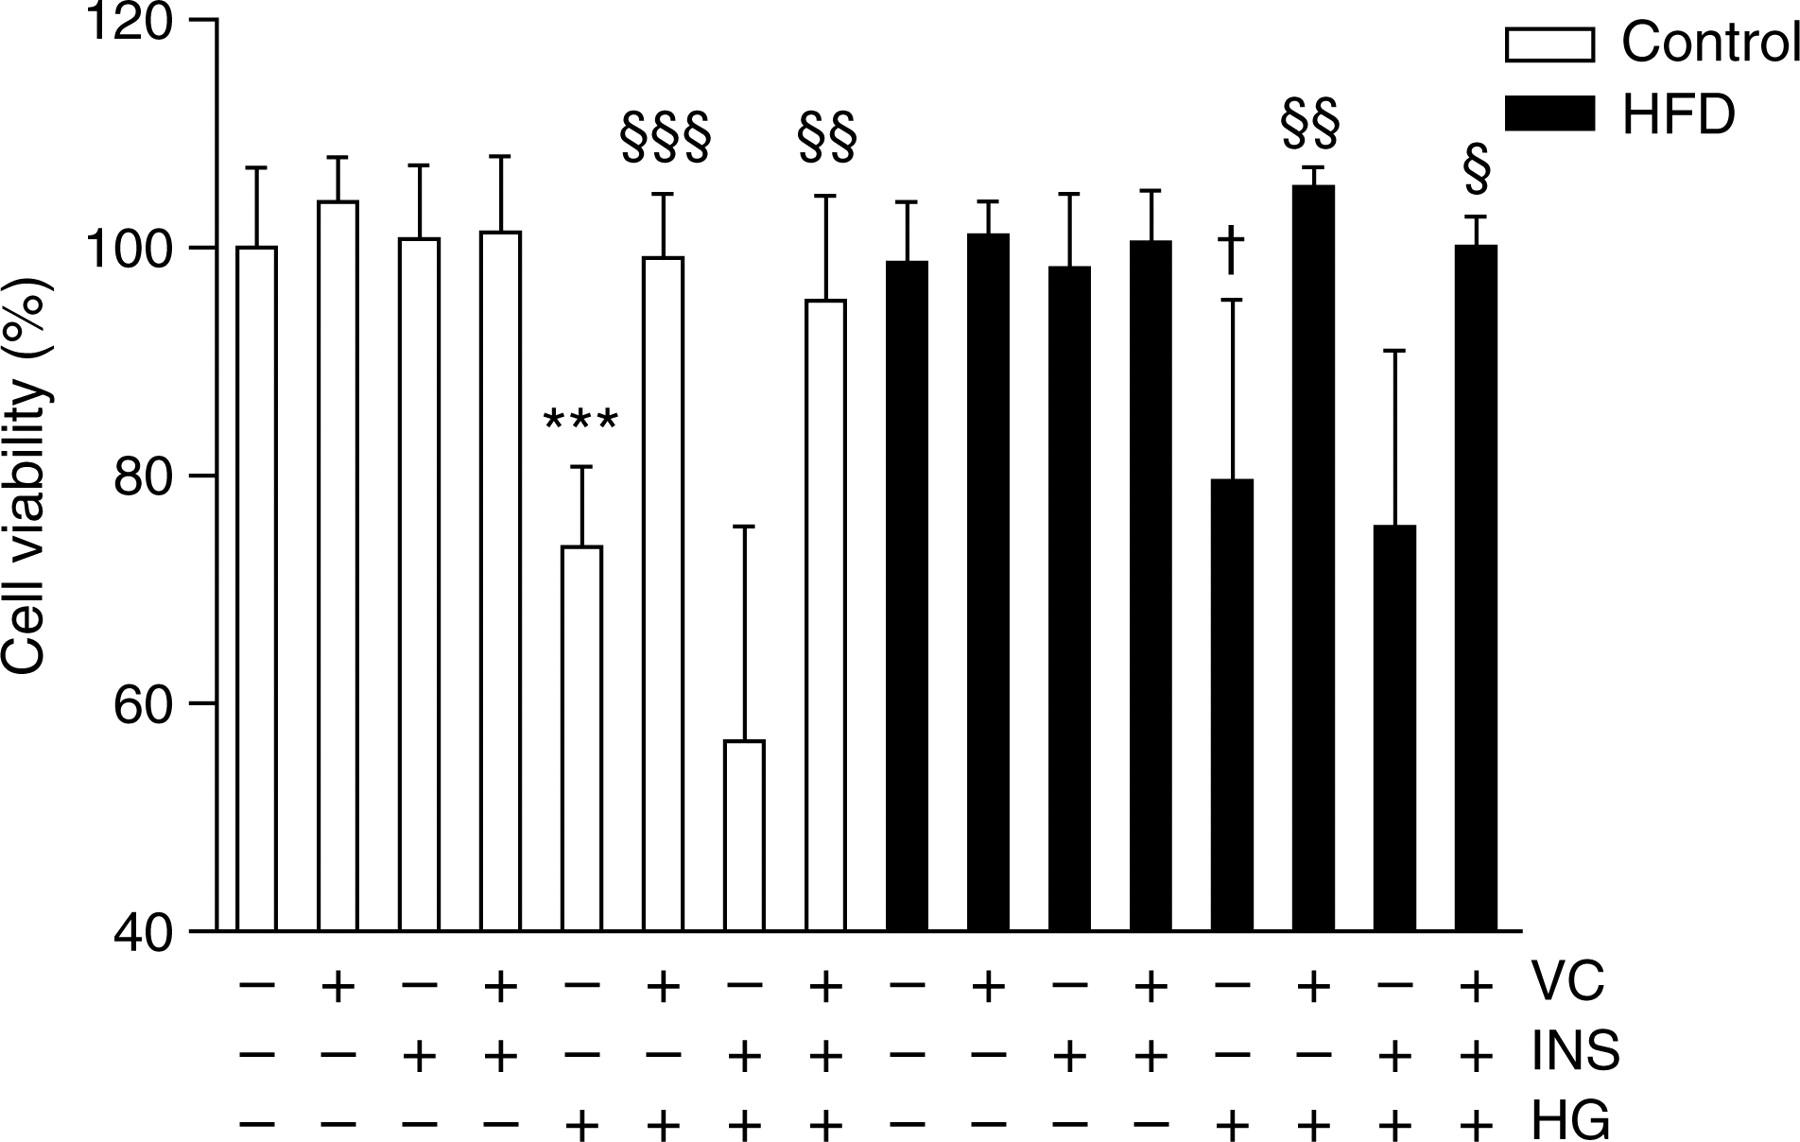
Glucose and lipid metabolism
The glucose uptake, lactate production and glycerol release of adipocytes isolated from epididymal WAT of rats after the 72-h culture were measured (Figure 2). No important effects of HFD treatment on glucose uptake were observed (Figure 2a; one-way ANOVA, P < 0.01). However, insulin treatment, as expected, induced higher glucose uptake, but only in control adipocytes without HG treatment. Although a slight effect of VC was observed, it was only statistically significant in adipocytes from HFD rats.
Glucose and lipid metabolism measurements in the primary culture. The effects of 200 μmol/L vitamin C, 1.6 nmol/L insulin and high (25 mmol/L) or low (5.6 mmol/L) glucose concentrations on 72-h (a) glucose uptake, (b) lactate production and (c) glycerol release of isolated adipocytes from chow-(white bars) or HFD-(black bars) fed rats are shown. Data (n = 5) are expressed as mean ± SD. *P < 0.05 and **P < 0.01 indicate differences against control group; †
P < 0.05 against HFD-treated-only group; §
P < 0.05 against each (control and HFD) HG-treated group. HFD, high-fat diet; VC, vitamin C; INS, insulin; HG, high glucose; t*, statistical tendency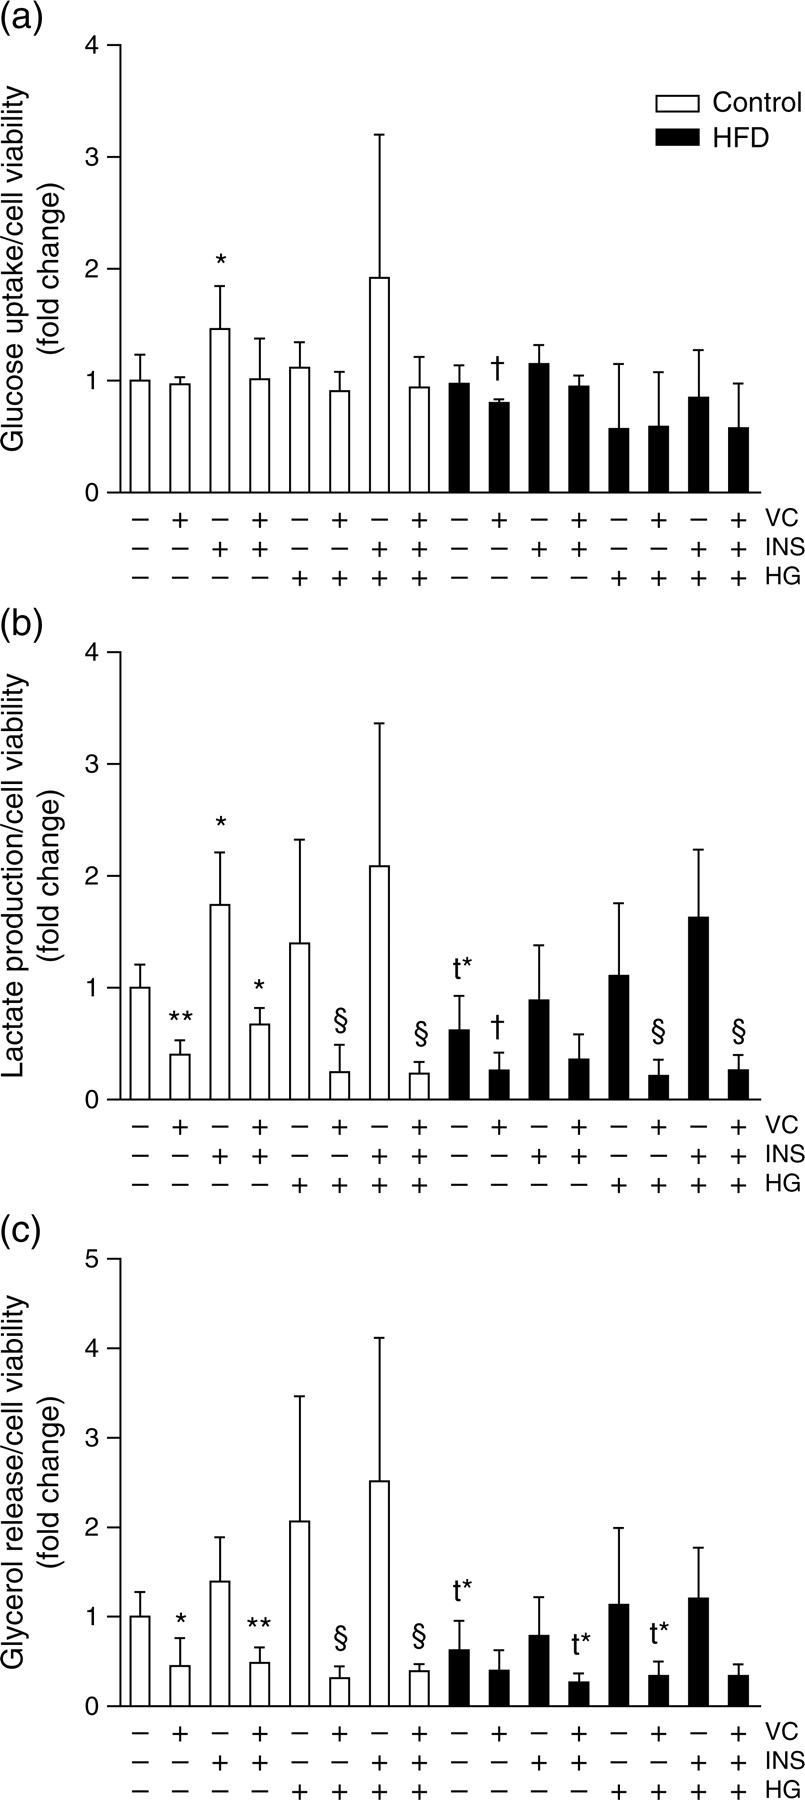
Regarding lactate production (Figure 2b; one-way ANOVA, P < 0.001), insulin induced higher release of this metabolite again only in control adipocytes. This induction was not observed under HG or HFD treatment. On the other hand, VC exerts inhibitory effects in almost all experimental conditions. A slight decrease was observed in adipocytes from HFD-fed animals as compared with controls, however, without reaching statistical significance (P = 0.052).
Finally, glycerol release was generally reduced in adipocytes from HFD-fed rats, and drastically inhibited by VC treatment, especially in primary adipocytes from control animals.
Adipokine mRNA expression
The mRNA expression of apelin and leptin was also analyzed in the primary cultures (Figure 3). Concerning apelin mRNA expression (Figure 3a; one-way ANOVA, P < 0.001), no effects of HFD and insulin treatments were observed. VC induced decreased apelin expression, especially in those that were not treated with HG. HG treatment induced a slight reducing effect only in adipocytes from HFD rats (P = 0.094).
Adipokine gene expression measurements in the primary culture. The effects of 200 μmol/L vitamin C, 1.6 nmol/L insulin and high (25 mmol/L) or low (5.6 mmol/L) glucose concentrations on 72-h (a) apelin and (b) leptin mRNA expression of isolated adipocytes from chow-(white bars) or HFD-(black bars) fed rats are shown. Data (n = 5) are expressed as mean ± SD. *P < 0.05 indicates differences against control group; ††
P < 0.01 against HFD-treated-only group; §
P < 0.05 against each (control and HFD) HG-treated group. HFD, high-fat diet; VC, vitamin C; INS, insulin; HG, high glucose; t*, statistical tendency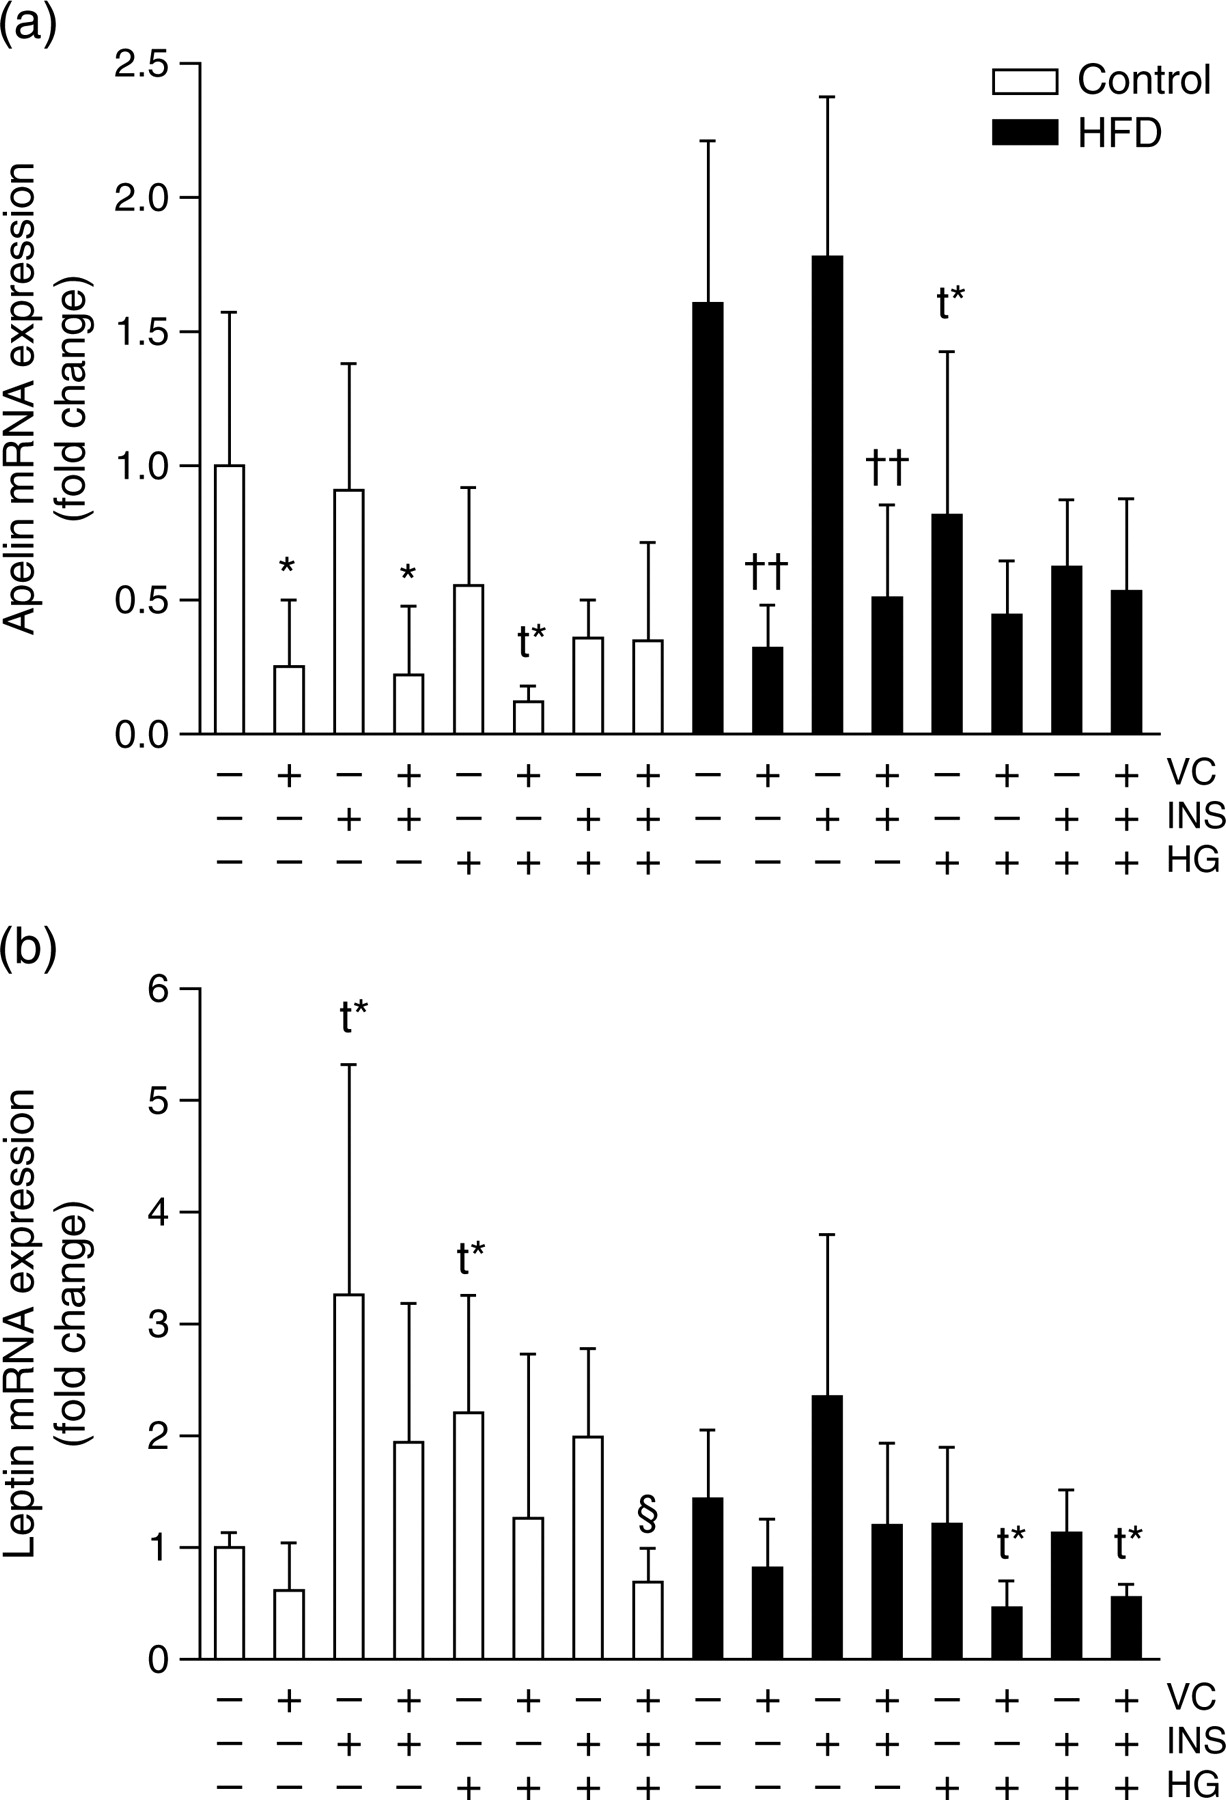
Regarding leptin mRNA expression levels (Figure 3b; one-way ANOVA, P < 0.001), statistical tendencies towards higher expression induced by insulin (P = 0.068) and HG (P = 0.059) treatments were only observed in controls. VC treatment induced slight inhibitions in leptin gene expression, only statistically significant in cells under insulin and HG treatment.
Adipokine secretion
The secretion of apelin and leptin gene products after 72 h of culture was also measured (Figure 4). Insulin treatment induced a statistically significant increase in apelin secretion only in control adipocytes (Figure 4a; one-way ANOVA, P < 0.001). On the other hand, HFD treatment induced lower apelin secretion, and HG provoked higher adipokine release, but only in adipocytes from HFD rats. VC treatment overall produced lower apelin secretion, an effect that was particularly significant in control adipocytes.
Adipokine secretion measurements in the primary culture. The effects of 200 μmol/L vitamin C, 1.6 nmol/L insulin and high (25 mmol/L) or low (5.6 mmol/L) glucose concentrations on 72-h (a) apelin and (b) leptin secretion to culture medium of isolated adipocytes from chow-(white bars) or HFD-(black bars) fed rats are shown. Data (n = 5) are expressed as mean ± SD. *P < 0.05, **P < 0.01 and ***P < 0.001 indicate differences against control group; ††
P < 0.01 against HFD-treated-only group; §
P < 0.05 and §§
P < 0.01 against each (control and HFD) HG-treated group. HFD, high-fat diet; VC, vitamin C; INS, insulin; HG, high glucose; t*, statistical tendency
Leptin secretion was significantly induced by insulin only in control adipocytes, regardless of glucose treatment (Figure 4b; one-way ANOVA, P < 0.001). HG per se induced higher leptin secretion, while VC only inhibited this adipokine in the presence of HG, an effect that was once again only seen in control adipocytes. These effects were blunted in adipocytes from HFD rats.
Association studies
Correlation analyses among some in vivo and ex vivo measurements were performed (Figure 5). Among variables measured prior to cell culture procedures, intracellular ROS content of adipocytes correlated positively with retroperitoneal WAT weight (r = 0.673, P < 0.01), mesenteric WAT weight (r = 0.561, P < 0.05), serum leptin concentration (r = 0.610, P < 0.05) and leptin gene expression in adipocytes (r = 0.692, P < 0.01). On the other hand, glucose uptake measured after 72 h of adipocyte culture correlated negatively with several variables measured before culture, such as animal body (r = −0.387, P < 0.01), epididymal (r = −0.316, P < 0.01), subcutaneous (r = −0.259, P < 0.05), retroperitoneal (r = −0.398, P < 0.001), mesenteric (r = −0.354, P < 0.01) and total fat depot (r = −0.358, P < 0.01) weights, blood glucose levels (r = −0.230, P < 0.05) and adipocyte cell diameter (r = −0.362, P < 0.01). Finally, adipocyte apelin gene expression after 72 h culture correlated positively with rat epididymal fat depot weight (r = 0.327, P < 0.01) and insulin blood levels (r = 0.336, P < 0.01).
Association analyses between intracellular ROS content prior to cell culture and (a) retroperitoneal WAT weight, (b) mesenteric WAT weight, (c) serum leptin and (d) adipocyte leptin gene expression prior to cell culture, between glucose uptake after cell culture and (e) final body weight, (f) total fat weight, (g) serum glucose and (h) adipose cell diameter prior to cell culture, and between apelin gene expression after cell culture and (i) epididymal WAT weight and (j) serum insulin. Triangles represent control-fed animals and closed circles represent HFD-fed animals. AU, arbitrary units, FI, fluorescence intensity; WAT, white adipose tissue; r, Pearson's correlation coefficient; ROS, reactive oxygen species; HFD, high-fat diet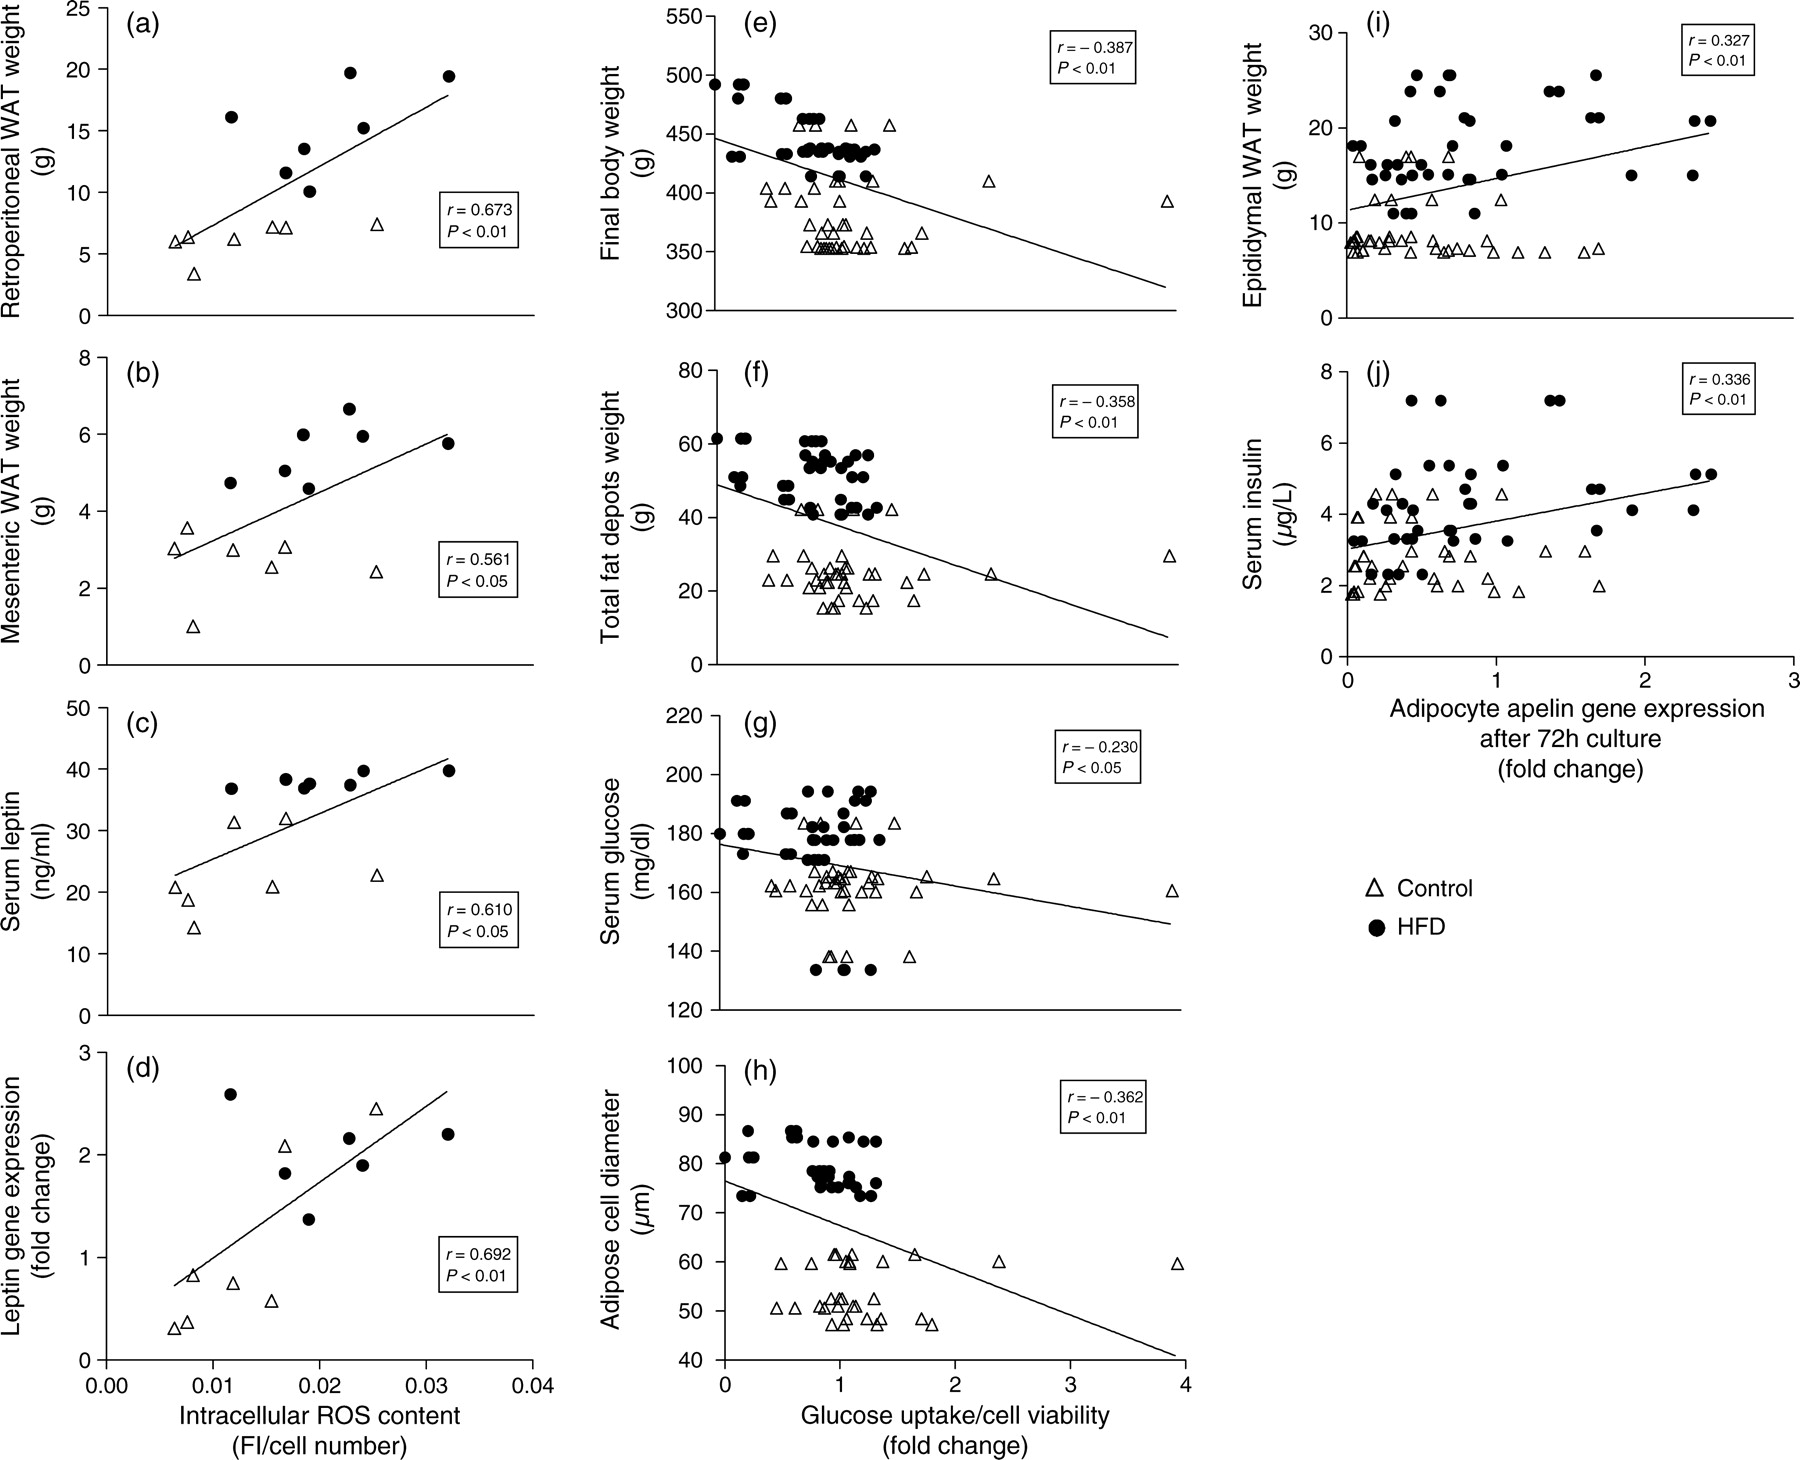
Discussion
The scientific literature describes controversial results for a potential role of antioxidants in obesity prevention or treatment. 26 Nevertheless, the health-improving effects of VC treatment on body weight and waist–hip ratio, cardiovascular disease occurrence and on glucose and lipid biomarkers in humans 14,27–29 and animals 20 have been reported. In the present work, some obesity-related variables of adipocytes isolated from obese animals were compared with control adipocytes under VC treatment and subjected to several experimental conditions.
The HFD-fed animals presented all features of an obesity-established state. Moreover, the associations observed between intracellular ROS in adipocytes and several obesity-related variables agree with the previous literature, which reported higher oxidative stress in excessively enlarged adipose tissue. This is an important trigger for the onset of obesity-related metabolic syndrome features. 9 In culture, the onset of insulin resistance is suggested by the fact that lactate release was lower, and that the insulin treatment did not induce higher glucose uptake, lactate production and adipokine release of adipocytes from HFD rats. 23,30,31 In addition, this observation is supported with the negative correlations observed between adipocyte glucose uptake and several obesity-related variables, and with the positive correlations observed between apelin mRNA expression of adipocytes after culture, with WAT weight and blood insulin. On the contrary, lower serum triglyceride levels in HFD-fed animals with respect to controls were found. Nevertheless, this result agrees with a previous report performed in the same obesity model. 32 In this study, higher liver triglyceride contents were detected in HFD-fed rats, indicating that this metabolite, at this stage, could be rapidly mobilized to the liver, possibly leading to steatosis. Concerning the higher HDL cholesterol content in HFD-fed animals, despite the fact that dietary saturated fat intake has been associated with increased plasma cholesterol (particularly low-density lipoprotein), it has also been related with elevated HDL cholesterol plasma levels. 33 In this regard, it has been reported that low saturated fat and cholesterol intake reduced apolipoprotein A1 secretion. 34
Regarding VC treatment, first of all, it is worth mentioning that the dose used had been previously utilized by our research group, and it was described that it is within physiological levels. 19 The facts that insulin-induced adipocytes presented basal glucose uptake levels and that VC treatment directly inhibits the glucose uptake in adipocytes from HFD animals agree with a previous report. 19 Indeed, it is known that the dehydroascorbic acid (the oxidized form of VC that is transported inside cells) could compete with glucose for glucose transporter 1 (GLUT-1) and GLUT-4. 35,36 The drastic inhibition in lactate production by this vitamin, which was observed in adipocytes from both types, is in accordance with a study describing a lactic acid plasma concentration reduction of dietary feeds by a vitamin C/E treatment in diabetic rats, 37 and again, with a previous report that was performed in adipocytes from lean animals. 19 The present work suggests that the effect of this vitamin is independent of the dietary origin of the cells. On the other hand, in muscle cells, a H2O2 treatment induces glucose uptake, lactate production and the gene expression of proteins involved in glucose metabolism. However, treatment with the antioxidant n-acetylcysteine reduced the ROS content, glucose uptake, lactate production, the expression of GLUT4 and the phosphofructokinase activity. 38 It was suggested that the reducing properties of n-acetylcysteine on glucose uptake are attributed to its ROS scavenger properties. In this context, VC could also induce glucose uptake inhibition by its well-known ROS scavenging properties. 35,39
With regard to lipolytic activity, the lower glycerol release of adipocytes from HFD-fed rats could be due to a fat hydrolysis resistance. 40,41 On the other hand, despite the fact that the results did not replicate the well-known antilipolytic effects of insulin, 42 these are in agreement with other reports, 19,43 indicating a lack of lipolysis modulation by insulin in this experimental model. Also, it is worth mentioning that the antilipolytic effects of insulin are blunted in visceral compared with subcutaneous adipocytes. 44 Finally, the lower glycerol release induced by VC indicates an inhibited fat utilization on both insulin-treated and non-treated adipocytes from chow- or HFD-fed rats. It has been described that rats fed on HFD with VC supplementation presented a decreased isoproterenol-induced lipolysis as compared with the rats that were fed with HFD alone, 15 and that VC inhibited glycerol release in primary cultured adipocytes from lean animals. 19 Furthermore, the lower lipolysis is in agreement with a possible insulin-sensitizing property of VC. 13,15,29
Regarding apelin and leptin expression and secretion, at first glance, no positive correlations between the expression pattern and the secretion levels of both adipokines were observed. This outcome could be explained by possible mRNA expression fluctuations during culture and by probable post-transcriptional events. 45,46 As mentioned before, the lower apelin and leptin secretion response to insulin in adipocytes from HFD-fed rats could be attributed to the insulin-resistant state of these adipocytes. 23 It is important to notice, that this effect was overcome by the HG treatment especially in the apelin secretion, which agrees with a previous report. 47 Leptin production appears to be more blunted by the HFD treatment. With respect to the effects of VC, the results are consistent with a previously described inhibition of apelin expression and leptin expression/secretion in WAT from rats that were fed on a HFD supplemented with VC. 13 The present work confirms a direct effect of VC treatment in adipocytes that were isolated from rat visceral fat. These data show that the VC treatment leads to important secretion alterations independent of the dietary origin of the adipocytes. The VC inhibitory effects on leptin secretion are in accordance with a study describing direct inhibitory effects in adipocytes isolated from lean rats. 19 Similar results were observed with other antioxidant substances, such as resveratrol and lipoic acid. 48,49 Regarding the possible mechanisms that could have led to the observed results, it has been reported that a VC treatment reduced the hypoxia-inducible factor 1α (HIF-1α) expression in rat prostate, 50 a factor which is known to induce apelin gene expression. 51 Also, it has been reported that insulin and hypoxia, through HIF-1α, act as agonists of leptin transcription in BeWo cells. 52 Moreover, both genes present insulin-response elements in their promoters, 53,54 and both transcripts could be affected by ROS content. 55
A toxic effect of HG incubation was observed in the current experiments, as was reported previously in the same experimental model. 56 Although it has been previously described that an in vivo VC treatment reduced adipocyte cell number, 17 no negative effects on ex vivo cell viability of this vitamin were detected. In fact, we observed a protective effect for this molecule against HG toxicity. This finding could be due to competition with glucose for GLUT-1 and GLUT-4, 35,36 reducing the effects of glucose on the hexosamine flux pathway. 57 Consequently, this situation could avoid cell death in control cells and possibly improve insulin sensitivity, since glucose toxicity contributes to insulin resistance. 58 In this context, it has previously been found that antioxidant treatments reduce glucose toxicity in pancreatic β-cells (HIT-T15) as well as in Zucker diabetic obese rats, 59 and that cells under HG treatment present augmented ROS intracellular content and suffer mitochondrial dysfunction. 60 Finally, this could explain the relatively lower effect of VC on adipocytes from HFD animals, since these cells presented higher ROS content prior to culture.
In summary, adipocytes isolated from the epididymal fat of rats, which were fed on either chow or HFD, presented different responses to glucose and insulin incubations. Animals in each group displayed differences in their levels of glucose and lipid metabolism markers, as well as in their expression/secretion pattern of apelin and leptin in primary culture, due to the establishment of an insulin-resistant state in animals fed on HFD. Furthermore, VC incubation in this culture leads to dramatic modifications of these variables, although these effects appear to be independent of the dietary origin of the adipocytes. Indeed, primary adipocytes from animals fed on HFD show impairment in metabolic functions concerning glucose and lipid metabolism as compared with chow-fed animals, while the response to VC appears to be inhibitory in both dietary groups.
Footnotes
ACKNOWLEDGEMENTS
This work was supported by the Ministry for Education and Science (MEC, Spain, grant AGL2006–04716/ALI), the Education Department of the Navarra Government (Spain), Carlos III Health Institute (CIBER project, Spain, grant CB06/03/1017 and RETICS project, Spain, PREDIMED2), the ‘Línea Especial’ (LE/97, University of Navarra, Spain) and the ‘Asociación de Amigos de la Universidad de Navarra’ and IBERCAJA (Spain, DFG-D doctoral grants). Also, the authors wish to thank the Department of Biochemistry of the University of Navarra for kindly lending us the POLARstar spectrofluorometer plate reader for ROS concentration measurements. Also, the authors are grateful for the expert technical assistance of Ana Lorente and Veronica Ciaurriz.