
Abstract
Cyclin D1 plays significant roles in cell cycle entry and migration. We have documented that both integrin α3β1 expressions and the number of podocytes were reduced in focal segmental glomerulosclerosis. We wondered whether integrin–extracellular matrix (ECM) interaction was involved in the regulation of cyclin D1 expression, and the possible signaling pathways in mitogen-stimulating podocytes. Cultured podocytes were divided into serum (mitogens/growth factors)-starved and serum-stimulated groups. Reverse transcription polymerase chain reaction was used to detect cyclin D1 mRNA, and Western blot analysis was used to measure protein concentrations of cyclin D1 and extracellular signal-regulated kinase (ERK) activation (p-ERK/ERK). The integrin–ECM interaction was blocked by anti-β1-integrin monoclonal antibody or RGDS (Arg-Gly-Asp-Ser). The MEK inhibitor, U0126, was used to inhibit ERK activation. The results showed that there was little cyclin D1 protein in serum-starved groups, but it was abundant in serum-stimulated groups. Both cyclin D1 mRNA and protein levels were reduced in serum-stimulated podocytes after blocking integrin–ECM interaction. ERK activation in serum-stimulated podocytes was significantly decreased after blocking integrin–ECM interaction. Cyclin D1 mRNA and protein concentrations in serum-stimulated podocytes were reduced after blocking ERK activation by U0126. We demonstrate that integrin–ECM interaction collaborates with mitogens to activate ERK/mitogen-activated protein kinase pathways which are essential for cyclin D1 expression in podocytes.
Introduction
Cyclin D1 plays an important role in cell cycle regulation. 1 Following mitogenic stimuli, cells exit quiescence (G0) and transit through G1 into S phase, where DNA synthesis occurs. Thereafter, cells pass through G2 into the final M (mitotic) phase, followed by cytokinesis. Cyclins and their catalytic subunits, cyclin-dependent kinases (CDKs), constitute the major regulatory proteins. 2 Cyclin D1 plays a key role in early-to-mild G1 phase. Cyclin D1 can regulate cell proliferation/differentiation and apoptosis/survival. In addition to the above functions, cyclin D1 has been recently found to regulate mitochondria function, metabolism and cellular migration. 1 Studies in MDA-MB-231 breast cancer cells have shown that decreased cyclin D1 and cyclin D1-CDK4/6 activity downregulates cell migration by changes in protein expression in actin-binding proteins. 3 Cyclin D1 knockout mouse embryo fibroblasts also displayed defective migration. 4
Integrins are a large family of cell-surface glycoproteins that mediate cell–cell and cell–extracellular matrix (ECM) communication. Integrins are heterodimers consisting of a α subunit and a β subunit, where the α subunit is non-covalently associated with the β subunit. Both α and β subunits are transmembrane proteins with large extracellular domains that interact with ECM proteins, together with relative small cytoplasmic domains that are associated with, or activate, a number of cytosolic kinases. It has been shown that on ligand binding, integrins regulate many signaling pathways that involve mitogen-activated protein kinases (MAPKs), intracellular Ca2+ fluctuation, inositol lipid metabolism, protein kinase C, ILK and phosphatidylinositol kinase. 5 There is a close correlation between activation of the extracellular signal-regulated kinase (ERK) subfamily of MAPKs and induction of the cyclin D1 promoter. 6,7
The mature podocyte is a terminally differentiated cell that serves specialized functions in the glomerulus. 8 During glomerulogenesis, immature or undifferentiated podocytes engage the cell cycle and proliferate. However, upon acquiring a mature and differentiated phenotype, podocytes exit the cell cycle and cease proliferating so that mature podocytes exhibit a quiescent phenotype. 9 In most glomerular diseases, podocytes may undergo DNA synthesis and mitosis, but no cytokinesis. These lead to binucleated or multinucleated podocytes. 10,11 Studies in the anti-Thy 1.1 nephritis model of mesangioproliferative nephritis have revealed that the number of cyclin D1-positive podocytes increased significantly on day 2 and reached a maximum on days 4–5 after disease induction. 12 However, there were no significant changes in cyclin D1 expression in the 5/6-nephrectomy rat model of focal segmental glomerulosclerosis (FSGS). 12 The role of cyclin D1 in glomerular disease was not determined. Studies of integrins in the kidney have found that α3β1 appears to be the major integrin expressed by podocytes. 13 Our previous studies have shown that podocyte expression of integrin α3β1 and the number of podocytes were reduced both in humans and in the animal model of FSGS. 14 The present study was to investigate whether integrin–ECM interaction was involved in the regulation of cyclin D1 expression, and the possible signaling pathways in mitogen-stimulating podocytes.
Materials and methods
Primary podocyte cell culture
The primary podocyte culture was performed as in previous studies. 15,16 In brief, isolation of glomeruli from Sprague-Dawley rats of 150–200 g body weight was first performed. Isolated glomeruli were plated in plastic culture flasks containing RPMI 1640 medium supplemented with 10% fetal calf serum (FCS), 100 U/mL penicillin and 100 μg/mL streptomycin for a period of five days. Cultures were kept at 37°C in a humidified 5% CO2 atmosphere. Outgrowing epithelial cells were trypsinized and passed through sieves of 25 μm pore size to remove remaining glomerular cores. Cells were placed on bovine type IV collagen-coated plastic dishes with RPMI 1640 containing 10% FCS. Proliferating cells in confluent cultures were subcultured after detachment with 0.15% trypsin in phosphate-buffered saline (PBS). Podocytes were then transferred and subsequently grown on type IV collagen-coated plates with RPMI 1640 containing 10% FCS. Experiments were performed with subconfluent cells of the secondary and fourth passage. Podocytes were identified by rabbit polyclonal anti-Wilms’ tumor protein WT-1 (C-19; Santa Cruz Biotechnology, Heidelberg, Germany) and synaptopodin (polyclonal rabbit antibody SE-19; Sigma, St Louis, MO, USA). 17,18
Western blot analysis
Western blot analysis was used to measure protein concentrations of cyclin D1 and ERK. The method was performed as in our previous study.
15
Cells were washed in PBS and then lyzed in 1mL of 1% Nonidet P-40, 25 mmol/L Tris-HCl, 150 mmol/L NaCl and 10 mmol/L, ethylenediaminetetraacetic acid, pH 8.0, containing a 1 in 50 dilution of a protease inhibitor cocktail for 30 min on ice. Samples were centrifuged at 14,000
The following primary antibodies were used: cyclin D1 (1:1000; Oncogene, Boston, MA, USA), ERK1/2 (1:1000; Santa Cruz Biotechnology, Santa Cruz, CA, USA) and p-ERK1/2 (1:1000; Cell Signaling Technology, Beverly, MA, USA). After washing, the membrane was incubated with peroxidase-conjugated secondary antibody for one hour at room temperature. Protein bands were made visible with an electrochemiluminescence detection kit to produce a chemiluminescence signal that was captured on X-ray film. Equality of loading was ensured by testing for β-actin, using a monoclonal antibody to β-actin (1:1000; Sigma Chemical Co, St Louis, MO, USA). Films were scanned using a Bio-Rad Model GS-700 Imaging densitometer (Bio-Rad Laboratories, Inc, Hercules, CA, USA) and densitometric analysis was performed using Molecular Analyt Version 2.1 (Bio-Rad Laboratories, Inc). Three experiments were performed.
Semiquantitative reverse transcription polymerase chain reaction
The reverse transcription polymerase chain reaction (RT-PCR) was performed as in a previous study. 15 Total RNA was extracted from podocytes by TRIzol reagent (Sigma Chemical Co). Two micrograms of total RNA were reverse-transcribed by incubation with a 20 μL RT mixture containing 20 pmol oligo (deoxythymidine)18 primer, 50 mmol/L Tris-HCl (pH 8.3), 75 mmol/L deoxy-NTPs and 50 U Moloney murine leukemia virus reverse transcriptase at 37°C for two hours. The reverse transcriptase was inactivated by heating for five minutes at 94°C. Each 50 μL of PCR reaction mixture contained 5 μL of the reaction volume, 1× PCR buffer (which contained 50 mmol/L Tris-HCl at pH 9.1, 14 mmol/L (NH4)2SO4 and 1.75 mmol/L MgCl2), 0.2 mmol/L of each deoxy-NTP, 2U Taq polymerase, and 0.1 μmol/L of specific primer pair. The primer sequences for cyclin D1 were 5′ GCGTACCCTGACACCAATCT 3′ (sense primer) and 5′ GCAGACCTCTAGCATCCAGG 3′ (antisense primer). Glyceraldehyde-3-phosphate dehydrogenase (GAPDH) was used to control for the amount of mRNA present in each sample. The primer sequences for GAPDH were 5′ GAAGGTGAAGGTCGGAGTC 3′ (sense primer) and 5′ GAAGATGGTGATGGGATTTC 3′ (antisense primer). After an initial heating step at 92°C for one minute, the amplification cycles were 30 s at 94°C, 30 s at 60°C and 60 s at 72°C for 40 cycles, ending with 72°C for seven minutes in a Thermal Cycler (Model 9600; PerkinElmer Corp, Norwalk, CT, USA). PCR products were electrophoresed on 1.5% agarose gels, visualized by ethidium bromide staining and photographed. The densitometric analysis was performed using the Gel-Pro Analyzer program (Media Cybernetics, Silver Spring, MD, USA). The relative intensity of the GAPDH bands was used to quantify the relative efficiency of the RT-PCR amplification. Three experiments were performed.
Statistical analysis
Values are presented as mean ± SEM. Differences between groups were compared using an unpaired two-tailed Student's t test. P values less than 0.05 were considered to be statistically significant.
Results
Cyclin D1 expression in serum-stimulated and serum-starved podocytes
FCS is a source of mitogens and growth factors.
19,20
To determine the difference in cyclin D1 expression between serum-stimulated and serum-starved podocytes, cells were plated in type IV collagen-coated six-well plates with RPMI 1640 medium containing 10% FCS for three days. After that point, cells were separated into serum-stimulated groups and serum-starved groups. The serum-stimulated groups were continuously cultured in type IV collagen-coated six-well plates with RPMI 1640 medium containing 10% FCS. The serum-starved groups were continuously cultured in type IV collagen-coated six-well plates with serum-free RPMI 1640 medium (Figure 1). Thereafter, the RPMI 1640 medium containing 10% FCS was changed every two days for serum-stimulated groups. The serum-free RPMI 1640 medium was also changed for serum-starved groups every two days. Cell lysates were performed at zero, two, four and six days. Cyclin D1 protein was detected by Western blotting.
Experimental design for serum-starved and serum-stimulated groups. Podocytes were cultured in plastic plates coated with type IV collagen and incubated with serum-free medium or 10% FCS medium for 24 h. After that point, cells were separated into serum-stimulated groups and serum-starved groups. The serum-stimulated groups were continuously cultured in RPMI 1640 medium containing 10% FCS. The serum-starved groups were continuously cultured in serum-free RPMI 1640 medium. The culture medium was changed every two days. Cell lysates were performed at zero, two, four and six days after the continuous culture. FCS, fetal calf serum
We found that there was very little cyclin D1 protein expression in the serum-starved groups and abundant expression in the serum-stimulated groups at culture periods of zero, two, four and six days (Figure 2a). The cyclin D1 level was significantly higher in serum-stimulated groups than serum-starved groups (Figure 2b). From this data, we found that serum (mitogens/growth factors) stimulation is needed for cyclin D1 expression.
Cyclin D1 expression in serum-stimulated and serum-starved podocytes. Cell lysates were performed in serum-stimulated and serum-starved groups at zero, two, four and six days (P0, P2, P4, P6, Q0, Q2, Q4 and Q6) to assess cyclin D1 protein expression by Western blotting. Equality of loading was ensured by β-actin. (a) Cyclin D1 expression in the serum-stimulated groups was persistent and obvious. There was little cyclin D1 expression in the serum-starved groups. (b) There was statistically significant difference of cyclin D1 expression between serum-stimulated and serum-starved groups. Graphs show densitometric analysis (data are presented with the mean ± SEM of all three independent experiments) of the ratio of cyclin D1 to β-actin. *P < 0.05, serum-stimulated groups compared with serum-starved groups. P, serum-stimulated groups; Q, serum-starved groups
Effect of blocking integrin α3β1–ECM interaction on cyclin D1 and ERK activation in serum-stimulated podocytes
Integrin–ECM interaction regulates mitogen-/growth factor-induced signal transduction pathways that are relevant to cell growth.
21
To determine the effect of cell–ECM interaction on cyclin D1 regulation of serum-stimulated groups, we used anti-integrin β1 antibody or RGDS (Arg-Gly-Asp-Ser) to disrupt cell–ECM interaction. Cells were plated onto six-well plates coated with type IV collagen at a confluence of about 10–20%. Cells were allowed to attach overnight in media containing 10% FCS. Then, cells were cultured continuously in media containing 10% FCS for 72 h. The monoclonal antibody (mAb) to β1-integrin (10 μg/mL; mouse anti-human integrin beta1 [CD29] adhesion-blocking monoclonal antibody, catalog number: MAB2253; Chemicon International Inc, Temecula, CA, USA) or normal mouse IgG1 isotype-negative control antibody (10 μg/mL; Santa Cruz Biotechology) were added in the above media to block integrin α3β1–ECM interaction for 0.5, 1, 2, 4, 6 and 12 h.
22,23
RGDS (Arg-Gly-Asp-Ser) (250 μg/mL; Sigma Chemical Co), which blocks the cell–ECM interaction mediated by the integrin-recognition sequence RGD (Arg-Gly-Asp) on ECM proteins, or negative control RGES (Arg-Gly-Gla-Ser) (250 μg/mL; Sigma Chemical Co) were also added for 0.5, 1, 2, 4, 6 and 12 h.
22,23
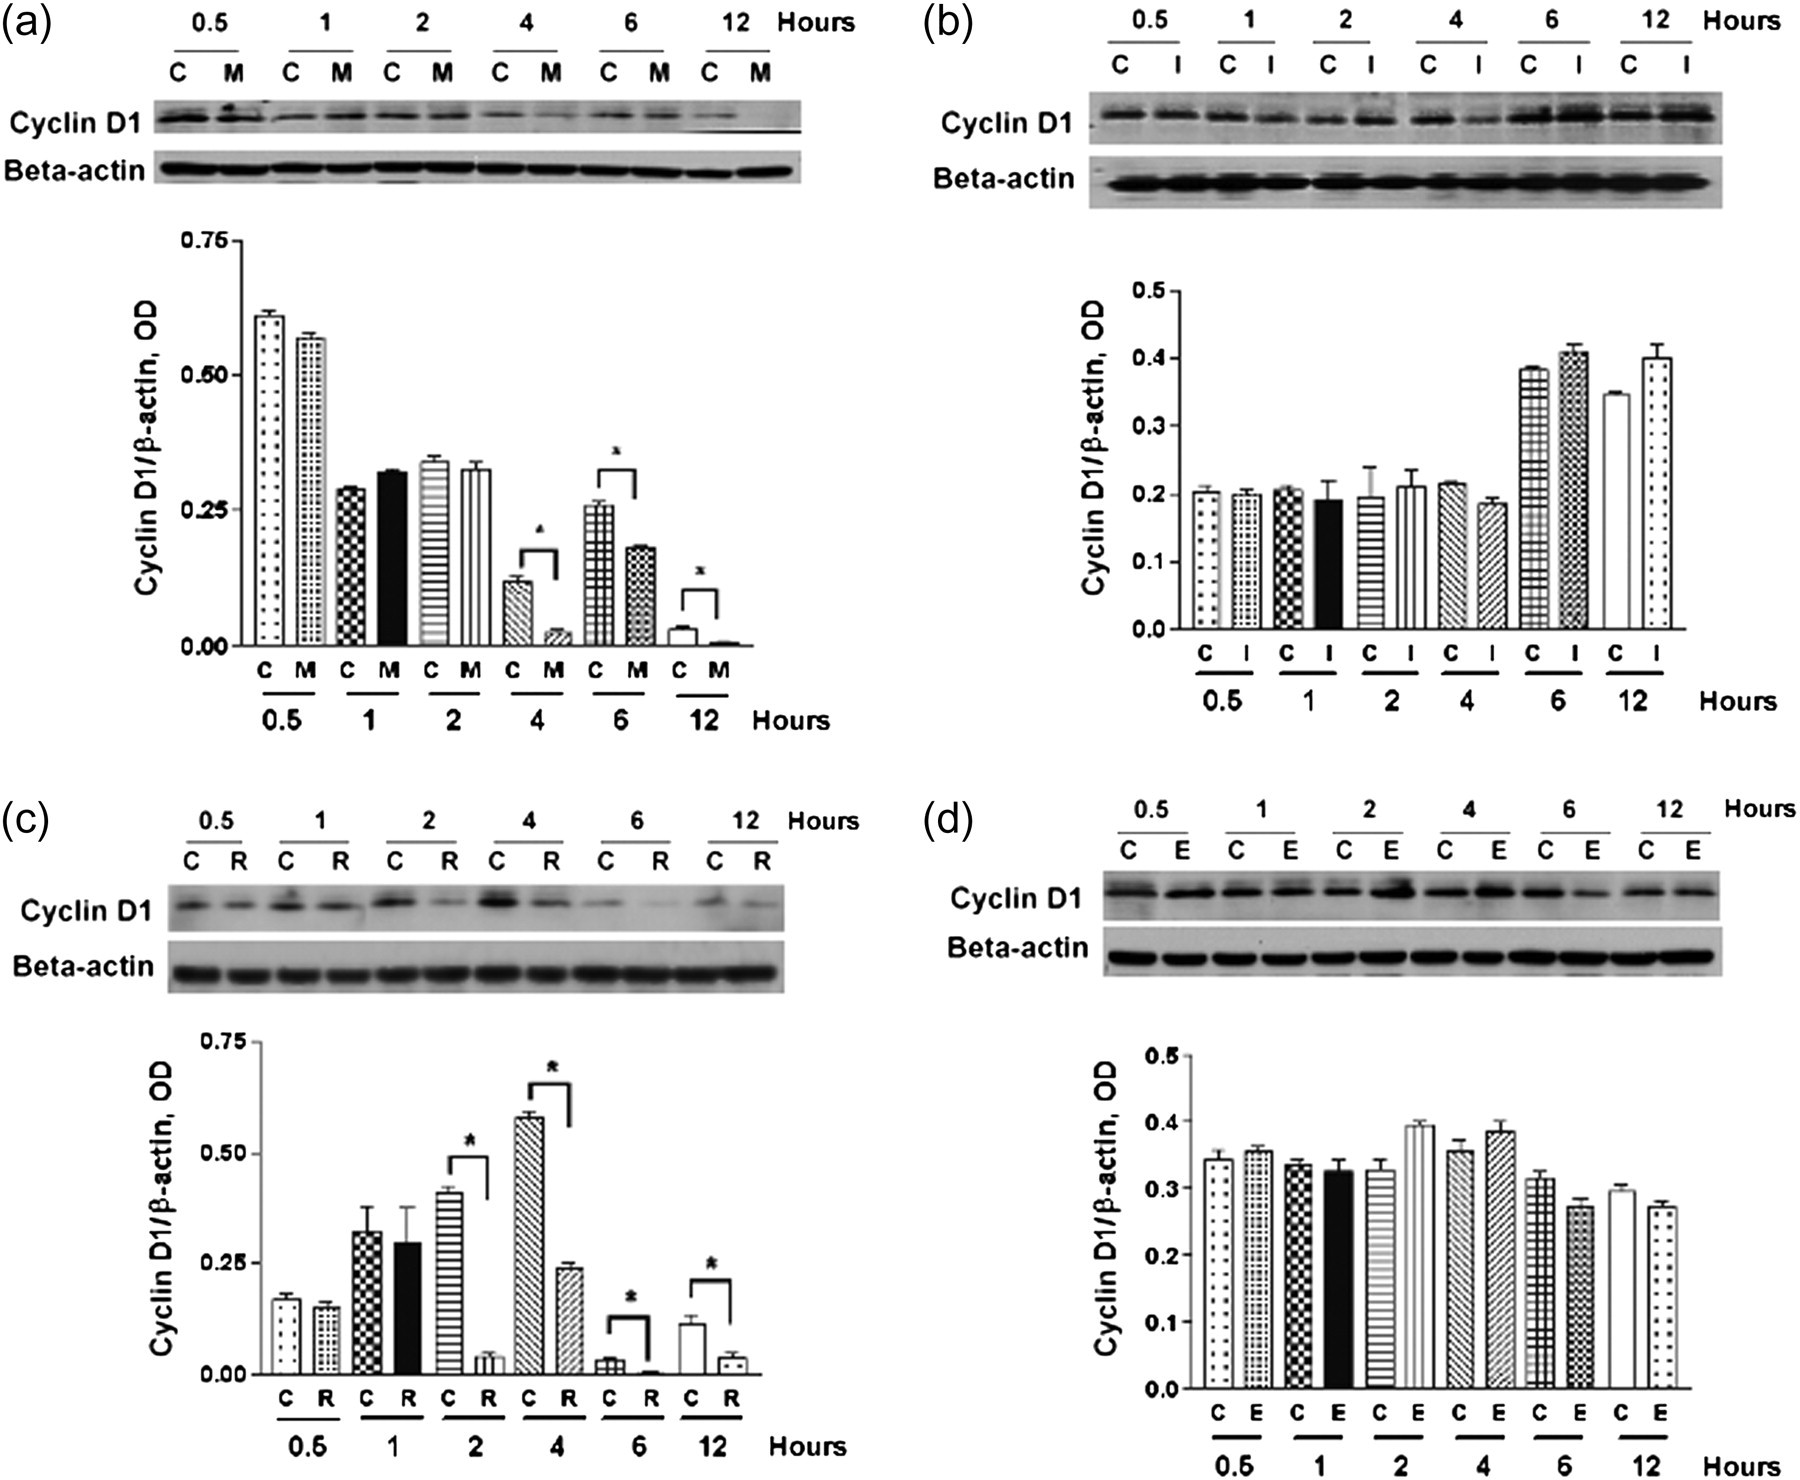
Dimethyl sulfoxide (DMSO) with an equivalent volume was used as control. Cells were rinsed with PBS to stop the reaction. Then, semiquantitative RT-PCR was performed to detect cyclin D1 mRNA. Western blotting was performed for cyclin D1 protein expression. We found that cyclin D1 mRNA expression was decreased in groups receiving anti-β1-integrin mAb or RGDS to block integrin-ECM interaction compared with the control groups at 0.5, 1, 2, 4, 6 and 12 h (Figures 3a and c). IgG1 and RGES, used as negative control treatment, did not decrease cyclin D1 mRNA expression compared with the control groups (Figures 3b and d). Compared with the control groups, there were also decreases in cyclin D1 protein levels at 4, 6 and 12 h after mAb to β1-integrin treatment, and at 2, 4, 6 and 12 h after RGDS treatment (Figures 4a and c). IgG1 and RGES, used as negative control treatment, did not decrease cyclin D1 protein expression compared with the control groups (Figures 4b and d). From the above results, we found that serum (mitogen/growth factor)-induced transcription and translation of cyclin D1 was regulated by integrin.
Cyclin D1 mRNA expression in serum-stimulated podocytes was decreased after blocking integrin α3β1–ECM interaction. Cells were planted in type IV collagen-coated six-well plates with RPMI 1640 medium containing 10% FCS for three days. Thereafter, cells were treated with anti-β1-integrin mAb (10 μg/mL) (a) or RGDS (250 μg/mL) (c) to block integrin α3β1–ECM interaction for 0.5, 1, 2, 4, 6 and 12 h. IgG1 (10 μg/mL) (b) and RGES (250 μg/mL) (d) were used as negative control treatment. Cyclin D1 mRNA was detected by RT-PCR. GAPDH mRNA was used as a loading control. (a) At 0.5, 1, 2, 4, 6 and 12 h after anti-β1-integrin mAb treatment, cyclin D1 mRNA expression was significantly less than the control group. (b) IgG1 negative control antibody did not affect the cyclin D1 mRNA expression compared with the control groups. (c) Cyclin D1 mRNA expression was significantly less than the control group at 0.5, 1, 2, 4, 6 and 12 h after RGDS treatment. (d) RGES negative control treatment did not cause a significant change in cyclin D1 mRNA expression. Graphs show densitometric analysis (data are presented with the mean ± SEM of all three independent experiments) of the ratio of cyclin D1 to GAPDH. *P < 0.05, treatment groups compared with without treatment groups. C, control; M, anti-β1-integrin mAb; I, IgG1; R, RGDS; E, RGES; ECM, extracellular matrix; FCS, fetal calf serum; RT-PCR, reverse transcription polymerase chain reaction; mAb, monoclonal antibody; GAPDH, glyceraldehyde-3-phosphate dehydrogenase Cyclin D1 protein expression in serum-stimulated podocytes was significantly decreased after blocking integrin α3β1–ECM interaction. Cells were plated in type IV collagen-coated six-well plates with RPMI 1640 medium containing 10% FCS for three days. Thereafter, cells were treated with anti-β1-integrin mAb (10 μg/mL) (a) or RGDS (250 μg/mL) (c) for 0.5, 1, 2, 4, 6 and 12 h to block integrin α3β1–ECM interaction. IgG1 (10 μg/mL) (b) and RGES (250 μg/mL) (d) were used as negative control treatment. Cyclin D1 protein expression was detected by Western blotting. β-actin was used as a loading control. (a) At 4, 6 and 12 h after mAb to β1-integrin treatment, cyclin D1 protein expression was significantly less than the control group. (b) IgG1 negative control antibody did not affect cyclin D1 protein expression compared with control groups. (c) Cyclin D1 protein expression was significantly less than the control group at 2, 4, 6 and 12 h after RGDS treatment. (d) RGES negative control treatment did not cause a significant change in cyclin D1 protein expression. Graphs show densitometric analysis (data are presented with the mean ± SEM of all three independent experiments) of the ratio of cyclin D1 to β-actin. *P < 0.05, treatment groups compared with without treatment groups. C, control; M, anti-β1-integrin mAb; I, IgG1; R, RGDS; E, RGES; ECM, extracellular matrix; FCS, fetal calf serum; mAb, monoclonal antibody; GAPDH, glyceraldehyde-3-phosphate dehydrogenase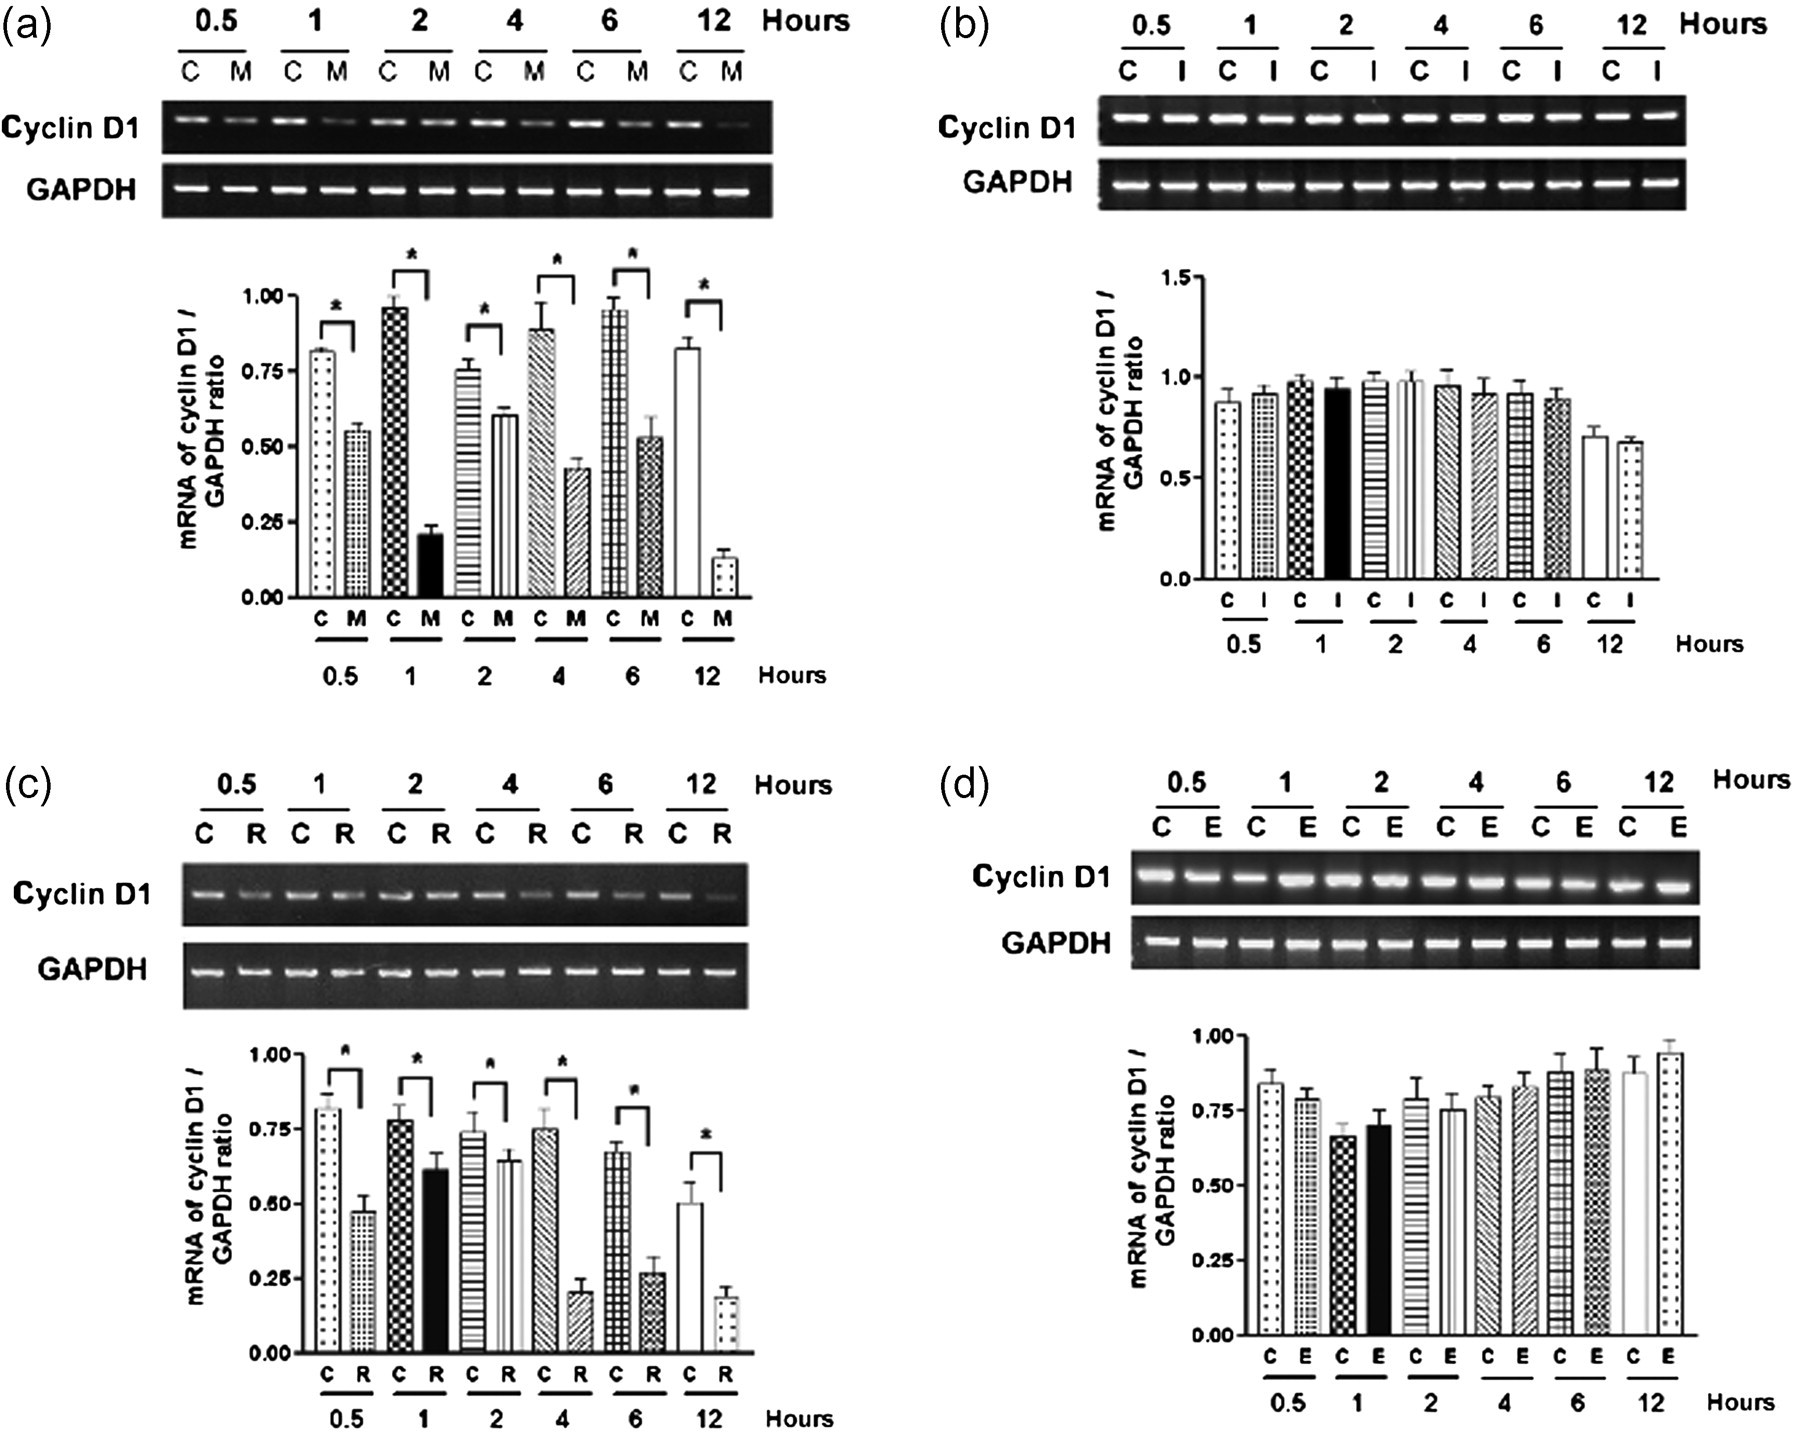
Both integrin–ECM interaction and mitogens/growth factors were found to cooperate in the activation of ERK.
24
Therefore, we wondered if blocking integrin–ECM interaction could regulate the activation of ERK by mitogens/growth factors. We used anti-β1-integrin mAb or RGDS to block integrin–ECM interaction. Cells were plated onto six-well plates coated with type IV collagen with RPMI 1640 containing 10% FCS for 72 h. Anti-β1-integrin mAb (10 μg/mL) or RGDS (250 μg/mL) was added in the above media to block integrin α3β1 function for 0, 1, 2, 4, 6 and 12 h. IgG1 (10 μg/mL) and RGES (250 μg/mL) were used as negative control. Cells were rinsed with PBS to stop the reaction. Then, Western blotting was performed for ERK activation. We found that ERK activation (p-ERK/ERK) was decreased gradually at 1, 2, 4, 6 and 12 h after anti-β1-integrin mAb and RGDS treatment in serum-stimulated podocytes (Figures 5a and c). The control treatment with IgG1 and RGES did not cause a significant change in ERK activation (Figures 5b and d). From these results, we conclude that integrin–ECM interaction is needed to sustain the activation of ERK stimulated by mitogens/growth factors.
ERK activation in serum-stimulated podocytes was significantly decreased after blocking integrin α3β1–ECM interaction. Cells were plated in type IV collagen-coated six-well plates with RPMI 1640 medium containing 10% FCS for three days. Thereafter, cells were treated with anti-β1-integrin mAb (10 μg/mL) (a), or RGDS (250 μg/mL) (c) for 1, 2, 4, 6 and 12 h to block integrin α3β1–ECM interaction. IgG1 (10 μg/mL) (b) and RGES (250 μg/mL) (d) were used as control treatment. Western blotting was performed for ERK activation (p-ERK/ERK). The β-actin was used as a loading control. (a) At 1, 2, 4, 6 and 12 h after anti-β1-integrin mAb treatment, the ERK activation (p-ERK/ERK) was decreased. (b) IgG1 control antibody did not affect the ERK activation. (c) At 1, 2, 4, 6 and 12 h after RGDS treatment, the ERK activation was significantly decreased. (d) RGES control treatment did not cause significant change of the ERK activation. Graphs show densitometric analysis (data are presented with the mean ± SEM of all three independent experiments) of the ratio of p-ERK to ERK. *P < 0.05, treatment groups compared with without treatment groups. ERK, extracellular signal-regulated kinase; ECM, extracellular matrix; FCS, fetal calf serum; mAb, monoclonal antibody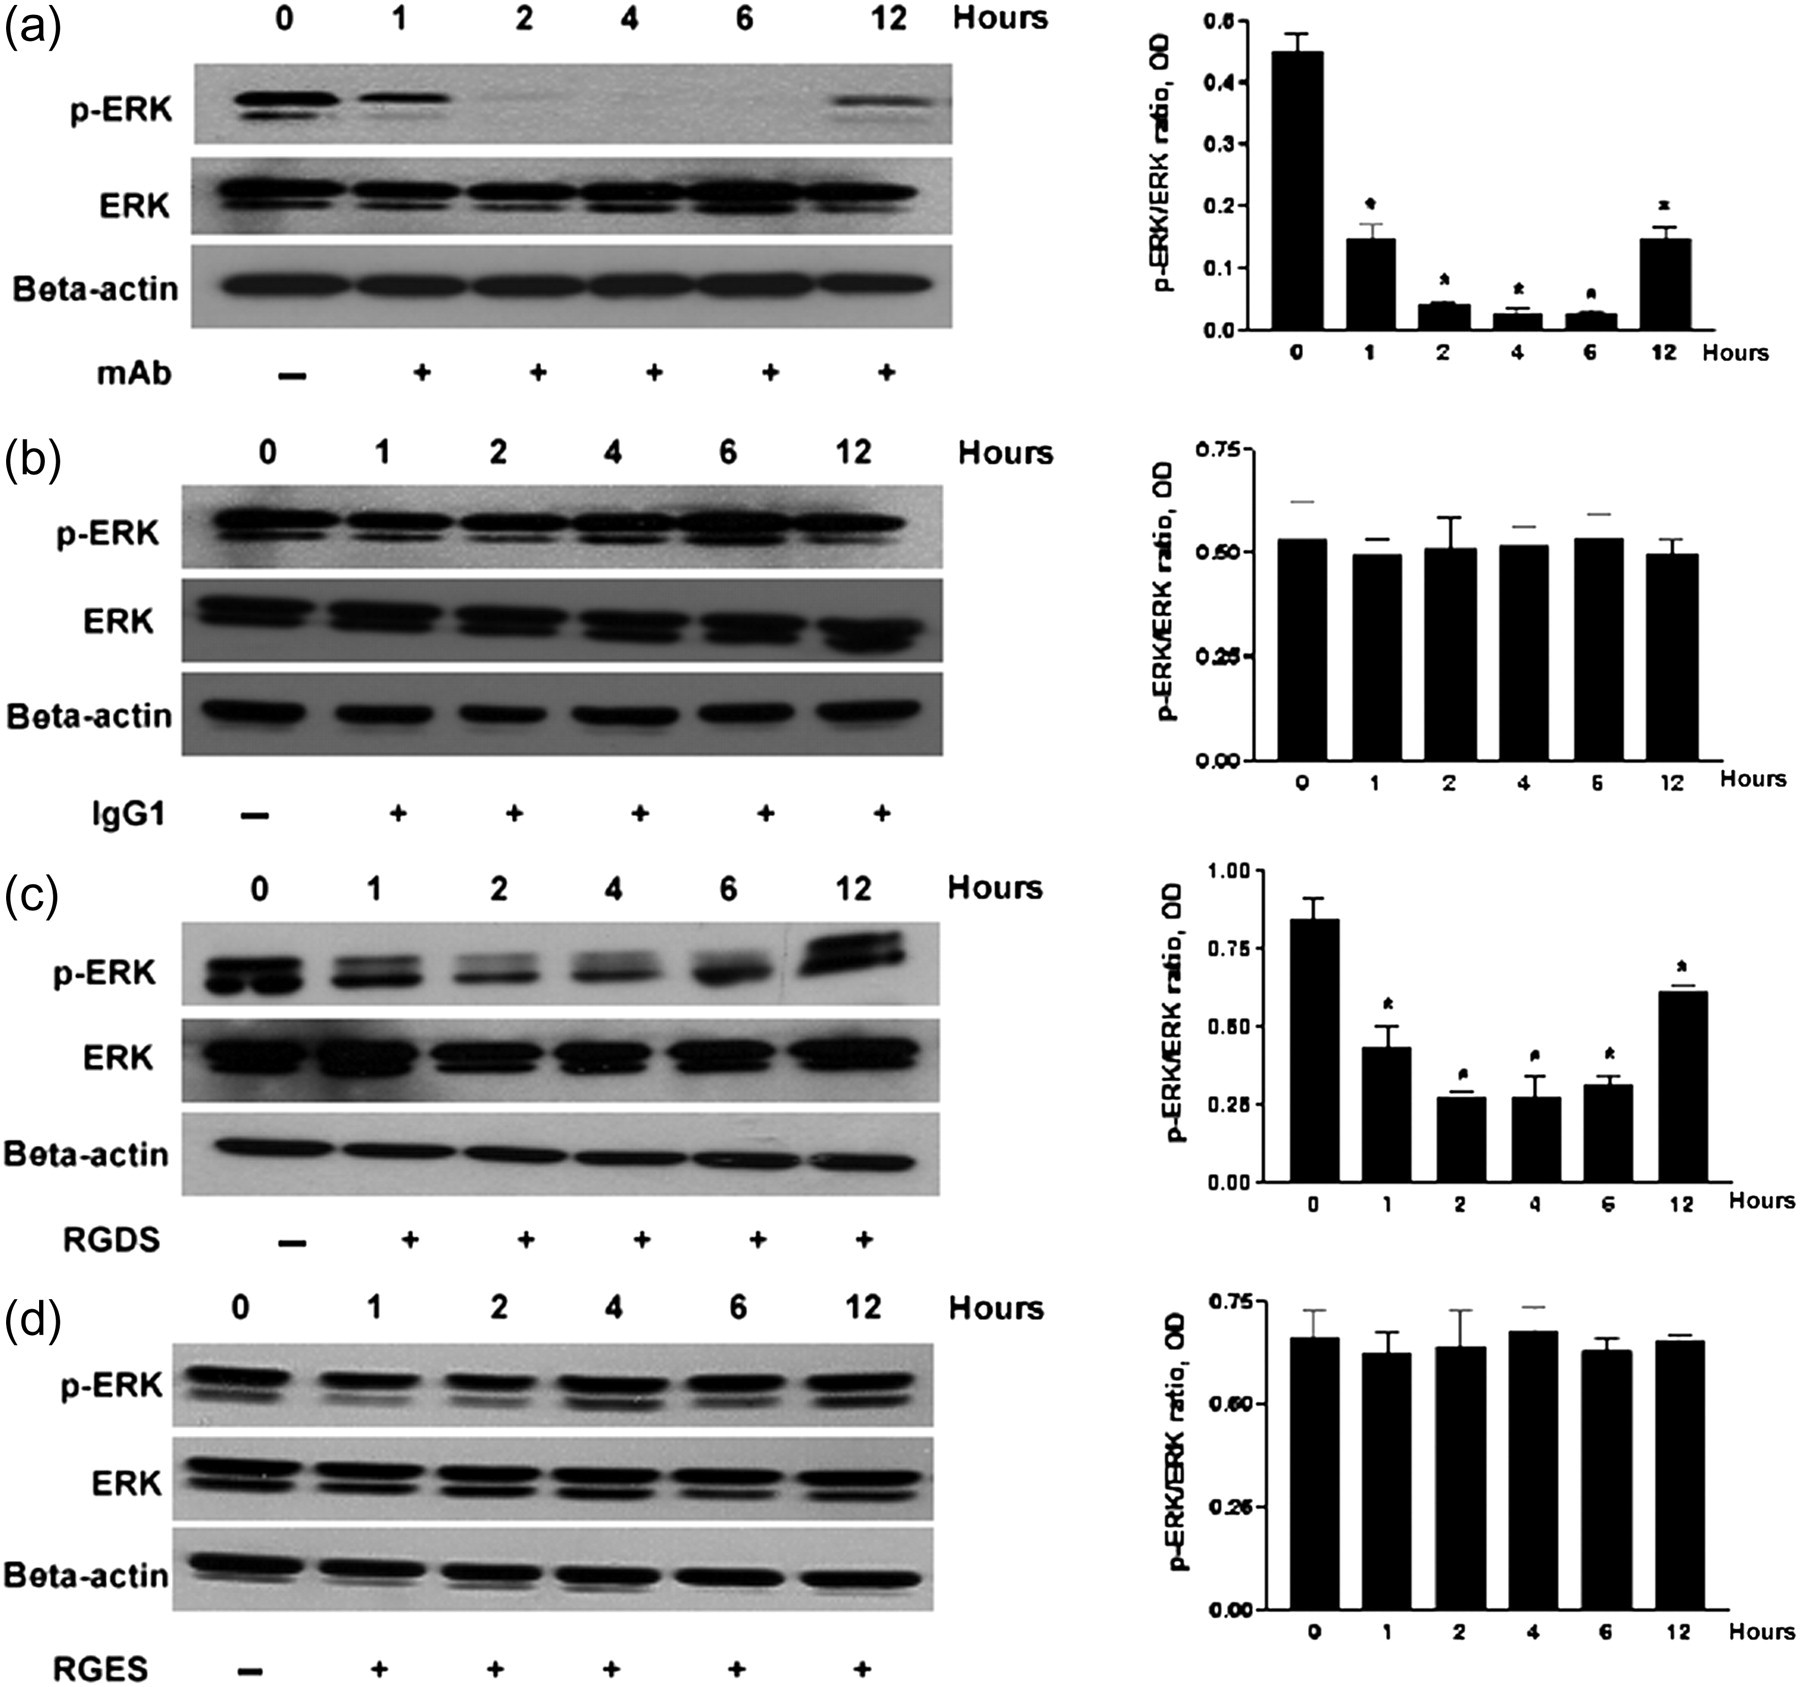
Effect of blocking activation of ERK on mRNA and protein expression of cyclin D1 in serum-stimulated podocytes
Lavoie et al.
25
reported that MAPK-dependent pathways are needed to induce cyclin D1 as one of the first steps in the progression through G1. To evaluate if the decrease of cyclin D1 expression by blocking integrin–ECM interaction was through the ERK/MAPK pathways, the MEK inhibitor, U0126, was used to suppress ERK activation. Cells were plated onto six-well plates coated with type IV collagen with RPMI 1640 containing 10% FCS for 72 h. To evaluate the effect of ERK activation on cyclin D1 mRNA expression, U0126 at a concentration of 10 μmol/L (Calbiochem, San Diego, CA, USA)
26,27
was added to the cells for 0.5, 1, 2, 4, 6 and 12 h. DMSO with an equivalent volume was used as control. Thereafter, semiquantitative RT-PCR was performed. To evaluate the effect of ERK activation on cyclin D1 protein expression, U0126 at a concentration of 10 μmol/L was added to the cells for 0, 1, 2, 4, 6 and 12 h. Cells were rinsed with PBS to stop the reaction. Then, Western blotting was performed. Compared with control groups, there were decreases in cyclin D1 mRNA levels in serum-stimulated podocytes at 0.5, 1, 2, 4, 6 and 12 h after U0126 treatment (Figure 6a). ERK activation (p-ERK/ERK) was decreased gradually at 1, 2, 4, 6 and 12 h after U0126 treatment (Figure 6b). Cyclin D1 protein level was also gradually decreased at 4, 6 and 12 h after U0126 treatment (Figure 6b). From these findings, we conclude that the activation of ERK is essential for cyclin D1 expression.
Inhibited ERK activation in serum-stimulated podocytes by U0126 decreased cyclin D1 mRNA and protein expression. Cells were plated in type IV collagen-coated six-well plates with RPMI 1640 medium containing 10% FCS for three days. Thereafter, the MEK inhibitor, U0126, was used to inhibit ERK activation. (a) Cells were treated with U0126 (10 μmol/L) for 0.5, 1, 2, 4, 6 and 12 h. Cyclin D1 mRNA was detected by RT-PCR. GAPDH mRNA was used as a loading control. Cyclin D1 mRNA was significantly decreased after ERK activation blocked by U0126. Graphs showed densitometric analysis (data are presented with the mean ± SEM of all three independent experiments) of the ratio of cyclin D1 to GAPDH. (b) Cells were treated with U0126 (10 μmol/L) for 1, 2, 4, 6 and 12 h. Western blotting was performed for ERK activation (p-ERK/ERK) and cyclin D1 expression. β-actin was used as a loading control. p-ERK/ERK concentration was decreased after U0126 treatment. Cyclin D1 protein expression was significantly decreased at 4, 6 and 12 h after inhibited ERK activation by U0126. Right upper panel, graphs show densitometric analysis (data are presented with the mean ± SEM of all three independent experiments) of the ratio of p-ERK to ERK. Right lower panel, graphs show densitometric analysis (data are presented with the mean ± SEM of all three independent experiments) of the ratio of cyclin D1 to β-actin. *P < 0.05, treatment groups compared with without treatment groups. C, control groups; U, U0126-treated groups; U0126, no additional U0126; U0126 +, U0126 added; ERK, extracellular signal-regulated kinase; GAPDH, glyceraldehyde-3-phosphate dehydrogenase; FCS, fetal calf serum; RT-PCR, reverse transcription polymerase chain reaction
Discussion
It has been found that podocytes do not proliferate in classic FSGS, minimal change disease and membranous nephropathy. 28,29 In contrast, binucleated or multinucleated podocytes are found in glomerulonephritis. 10,11 In an animal model of minimal change disease and mesangioproliferative nephritis, cyclin D1-positive podocytes were increased after disease induction. 12 We wonder what mechanisms regulate cyclin D1 expression in podocytes. In this study, we found that podocytes in serum-starved medium groups had little expression of cyclin D1 mRNA and protein, but serum-stimulated groups had abundant expression of cyclin D1 mRNA and protein. The major role of cyclin D1 is to initiate cell cycle entry in early G1 and promote G1–S phase transition. 30 Mitogenic stimulation with serum or platelet-derived growth factor (PDGF) can lead to rapid increases in cyclin D1 level and cell proliferation. 31 PDGF and lysophosphatidic acid are two of the major mitogens in serum. 32 Therefore, serum can stimulate cyclin D1 expression.
Cyclin D1 was found to be increased in podocytes in two models of experimental podocyte disease: passive Heyman nephritis (a complement-dependent rat model of human membranous nephropathy) and HIV transgenic mice. 33 In an animal model of FSGS, there were no significant changes in cyclin D1 and proliferating cell nuclear antigen in podocytes. 12 In HIV nephropathy, collapsing glomerulopathy and cellular variant of FSGS in humans, decreased cyclin D1 expression was found in podocytes. 34,35 The authors suggested that the decrease in cyclin D1 preceded the appearance of the dysregulated phenotype. Dysregulated podocytes may proceed to proliferation/de-differentiation, lack of proliferation, hypertrophy or apoptosis, which induce podocytopenia and glomerulonephropathy. 36,37 In our previous report in human and animal models of FSGS, we found that the numbers of integrin α3β1 in both foot processes and podocytes were decreased and negatively proportional to proteinuria. 14 Integrin–ECM interaction has been reported to control cell cycle. 19,38 However, the mechanisms by which integrin–ECM interaction modulate cyclin D1 expression are incompletely understood in podocytes. In the present study, we wanted to demonstrate that alteration of integrin expression or function can change cyclin D1 expression and its pathway in podocytes. In this study, cyclin D1 mRNA and protein expression were prominent in serum-stimulated podocytes. But, the disruption of integrin–ECM interaction with RGDS or anti-β1-integrin mAb led to significant downregulation of cyclin D1 mRNA and protein expression in podocytes. The decrease in cyclin D1 may downregulate early-to-mild G1 phase transition. This may lead to reduced cell cycle entrance that may cause no significant changes to cell cycle proteins in podocytes in the animal model of FSGS. It was found that cyclin D1 can regulate cell migration by changing the activity and amount of filamin A, and other cytoskeleton. 3 Cyclin D-deficient mouse embryo fibroblasts displayed decreased cell migration. 4 In our previous reports, the immunostaining score of integrin α3β1 was negatively correlated with the degree of glomerular sclerosing score and the amount of daily protein loss. 14 Thus, we consider that decreased cyclin D1 expression induced by the decrease in integrin–ECM interaction may inhibit migration of podocytes. The inhibited cell migration and cell cycle entry may lead to not having sufficient foot processes of podocytes to cover the denuded glomerular basement membrane after induction of FSGS. These may promote proteinuria. The relation between cyclin D1 and the cytoskeleton needs to be studied further in podocytes.
In this study, ERK activation in serum-stimulated podocytes was reduced after inhibition of integrin–ECM interaction with anti-β1-integrin mAb or RGDS. We also found that the inhibition of ERK activation with U0126 down-regulated cyclin D1 mRNA and protein expression. The abovementioned demonstrate that integrin–ECM interaction regulates cyclin D1 expression by ERK in serum-stimulated podocytes. From these findings, we conclude that integrin–ECM interaction collaborates with mitogens/growth factors to activate ERK/MAPK pathways which are essential for cyclin D1 expression. Some authors have found that serum (growth factors) can activate ERK1/2. 32,39 Lavoie et al. 6 reported that ERK regulates positive cyclin D1 expression in the Chinese hamster lung fibroblast cell line CCL39 under mitogen stimulation (10% FCS). Weber et al. 40 also found that sustained ERK activation plays a significant role in controlling G1 progression through positive regulation of cyclin D1 in Chinese hamster lung fibroblasts under PDGF stimulation (IIC9). From our findings, we can suggest that cyclin D1 expression in podocytes is positively controlled by sustained ERK activation. The sustained ERK activation is maintained by mitogens/growth factors collaborating with integrin–ECM interaction.
In summary, our results demonstrate that inhibition of integrin–ECM interaction leads to decreased ERK activation in mitogen-/growth factor-stimulated podocytes. The reduced ERK activation downregulates cyclin D1 mRNA and protein expression. These may lead to a decrease in cell cycle entrance and migration that may cause proteinuria.