




Abstract
Prenatal screening for Down's syndrome (DS) is in need of improvement. As a powerful platform, proteomics techniques could also be used for identification of new biomarkers for DS screening. In this case-control proteome study, pregnant women were diagnosed prenatally by karyotype analysis from amniotic fluid (AF). Maternal serum samples were collected from six pregnancies with fetuses affected by DS and six pregnancies with normal fetuses. First, we used two-dimensional electrophoresis and mass spectrometry to identify the different levels of expression of proteins in maternal serum between the DS and control groups in the second trimester. Second, we used bioinformatics to analyze the proteins by DAVID. Then, the interesting candidates were further tested by enzyme-linked immunosorbent assay (ELISA). Twenty-nine proteins were successfully identified in maternal serum obtained from pregnancies with fetuses affected by DS. The top five proteins up-regulated were serotransferrin (TF), alpha-1b-glycoprotein (A1BG), desmin (DES), alpha-1-antitrypsin (SERPINA1) and ceruloplasmin (CP), while serum amyloid P-component (APCS) was the most down-regulated protein. These 29 proteins were categorized based on binding, catalytic activity and enzyme regulator activity. The biological roles were involved in biological regulation, metabolic processes, cellular processes and response to a stimulus. Based on ELISA, the median concentrations of CP and complement factor B (CFB) were 332.3 and 412.3 ng/mL, respectively. The concentrations of CP and CFB were significantly higher in the DS group than in the control group (P < 0.05). In conclusion, proteomic approaches offer the possibility of further improving the performance of DS screening and our identification of up- and down-regulated proteins may lead to new candidates for DS screening.
Introduction
Down's syndrome (DS), also known as trisomy 21, is one of the most common types of gross chromosomal abnormalities occurring in live births, with an incidence of one in 700. 1 Down’s syndrome results from the presence of an extra chromosome 21, either ‘free’ as a part of Robertsonian fusion, or in rare instances, as a part of reciprocal translocation. 2 In the past 25 years, prenatal screening for DS has been widely used in pregnant women worldwide. The most common prenatal screening method for DS is a combination of serum levels of alphafetoprotein, unconjugated estriol and the free beta subunit of human chorionic gonadotropin (fβhCG) with maternal age in the second trimester. 3,4 The rate of detection (DR) of DS is 75%, with a 5% false-positive rate (FPR) by this screening program; 5 however, the rate is much lower in some developing countries. In China, the DR is only 50–67%, with a 5% FPR according to a multicenter study. 6–8 Therefore, the screening efficiency using these methods is unsatisfactory. Recently, a new testing method performed between 8 and 13 weeks of gestational age has largely replaced testing in the second trimester. 9 This test consists of the concentration of fβhCG and pregnancy-associated plasma protein A, ultrasound measurement of nuchal translucency and maternal age. Using this screening program, 75–85% of fetuses with DS can be detected at a FPR of 5%. 9–11 Therefore, both the DR and FPR of these methods are in need of improvement.
Recently, most medical experts have focused on the discovery of new biomarkers in maternal serum which can be added to the risk calculation algorithm. Proteomics represents a great revolution in translational medical science. Profiling of biological fluids has successfully identified relevant protein biomarkers that can potentially change the early diagnosis and treatment of several medical conditions. 12–14 Two-dimensional (2-D) gel electrophoresis (2-DE) and tandem mass spectrometry (MS–MS) are the most common techniques used in prenatal screening. Both techniques have been used to develop several potential biomarkers in amniotic fluid (AF) and maternal blood. Such processes have clearly demonstrated the potential of proteomics techniques in searching for new biomarkers. 15–18 Furthermore, proteomics techniques can also be used for identification of new biomarkers for DS screening because a specific set of proteins are found in maternal blood through placental diffusion. 19 There are several reports which have focused on diagnosing DS with proteomics. 20–26 Oh et al. 27 used 2-DE followed by matrix-assisted laser desorption/ionization (MALDI) to identify metabolic enzymes of amnion cells after cultivation. Wang et al. 28 first used the proteomics methods in diagnosing DS. Wang et al. 28 investigated an AF fingerprint in 20 samples obtained from pregnant women known to carry an aneuploid fetus, and identified candidate markers which generate a high possibility of identifying novel biomarkers for diagnosis. Nagalla et al. 29 identified potential serum biomarkers to detect DS using a comprehensive proteomic analysis. All of the reports showed the chances of developing effective non-invasive approaches for detection of DS. However, performance of candidate biomarkers obtained by such studies is not always reproducible, and the nominated pregnancy biomarkers for DS successfully confirmed in such studies were likely a function of technical sensitivity and reproducibility. Hence the newly identified single biomarkers have not significantly improved the performance of screening to date.
In the present study, using a combination of two technologies (2-DE and MALDI-time-of-flight-MS), we have identified the protein biomarkers for DS screening in maternal serum from pregnant women with normal and DS fetuses in the second trimester.
Materials and methods
Patients and design
Demographics of women with and without a Down's syndrome pregnancy at the time of screening (n = 6)
Depletion of high-abundance proteins
Before 2-DE was run, a Plasma 7 Multiple Affinity Removal System (Agilent, Santa Clara, CA, USA) was used to deplete proteins, such as albumin and IgG, following the manufacturer's instructions.
2-DE
Two-dimensional gel electrophoresis was performed as previously described. 30 Isoelectric focusing was carried out using a commercially available, dedicated apparatus (IPGphor; GE Healthcare, Piscataway, NJ, USA). Immobilized pH gradient strips (24 cm in length, non-linear and pH 4–7) were used. Protein (120 mg) for each sample (six from the DS group and six from the CG group) was mixed with rehydration solution containing 8 mol/L urea, 2% CHAPS, 20 mmol/L dithiothreitol (DTT), 0.5% (vol/vol) immobilized pH gradient (IPG) buffer (pH 4–7, non-linear) and 0.001% bromphenol blue. The linear ramping mode of the isoelectric focusing voltage was applied according to the following program: 30 V for six hours; 60 V for six hours; 500 V for one hour; and 1000 V for one hour followed by 8000 V to achieve 64 kVh at 20°C. The strips were then equilibrated at room temperature for 15 min in 8 mL of equilibration solution (6 mol/L urea, 50 mmol/L Tris-HCl, 30% glycerol, 2% sodium dodecyl sulfate (SDS) and 1% DTT), and incubated for another 15 min in an equilibration solution consisting of the same solution, with the exception that DTT was replaced by 2.5% (wt/vol) iodoacetamide.
Two-dimensional gel electrophoresis was then performed on 12.5% SDS gels in Ettan DALTsix (GE Healthcare) with a constant power at 5 W per gel for the first 30 min, followed by 12 W until the bromophenol blue line reached the bottom of the gels. The gels were visualized by silver staining without glutardialdehyde in the sensitizing solution.
Protein spot detection and in-gel tryptic digestion
Two-dimensional gel electrophoresis of each sample was performed once. The protein samples from each experimental group were not pooled because combining the samples would obscure the biological variability. The gels were then scanned (Atrix Scan 1010 Plus; Microtek, Taiwan, China), and the resulting images were analyzed by commercial software (ImageMaster 2D Platinum; GE Healthcare) for spot detection, quantification, comparison and statistical analysis.
Protein spots were excised, dehydrated in acetonitrile, and dried at room temperature. The proteins were reduced with 10 mmol/L DTT and 25 mmol/L NH4HCO3 at 56°C for one hour, and alkylated with 55 mmol/L iodoacetamide and 25 mmol/L NH4HCO3 in the dark at room temperature for 45 min in situ. The gels were then thoroughly washed with 25 mmol/L NH4HCO3, 50% acetonitrile and 100% acetonitrile in succession, and completely dried in a Speedvac (Concentrator 5301; Eppendorf, Hamburg, Germany). The dried gel pieces were re-swollen with 2–3 mL of trypsin solution (trypsin at 10 ng/mL in 25 mmol/L ammonium bicarbonate). After incubation at 4°C for 30 min, the excess liquid was discarded and the gel plugs were incubated at 37°C for 12 h. Finally, trifluoroacetic acid (TFA) was added to a final concentration of 0.1% to stop the digestive reaction.
Mass spectrometry
Protein identification and MALDI-MS analysis were performed as described by Huo et al. 30 Protein digests were immediately spotted onto a 400-mm anchorchip (Bruker Daltonics, Bremen, Germany). Spotting was completed by pipetting 1 μL of the sample onto the MALDI target plate twice, then 0.05 mL of 2 mg/mL a-HCCA in 0.1% TFA/33% acetonitrile containing 2 mmol/L ammonium phosphate was added. A Bruker Peptide Calibration Mixture was spotted down for external calibration. All samples were air-dried at room temperature, and 0.1% TFA was used for on-target washing. All samples were analyzed in a time-of-flight Biflex IV mass spectrometer (Bruker Daltonics).
Protein identification
Database queries and protein identification mass spectra were analyzed by FlexAnalysis software (version 2.4; Bruker Daltonics). The annotations of the peak masses were checked and edited manually to ensure that the correct peaks were labeled and to remove the masses that arose from the matrix, trypsin or known contaminants (e.g. keratins). The data were searched against SWISSPROT/TrEMBL protein sequence databases by the in-house MASCOT search engine (version 2.1). For peptide mass fingerprinting, the search condition settings were as follows: mass accuracy set at 100 ppm; one missed cleavage allowed; Homo sapiens taxon; alkylation of cysteine by carbamidomethylation as a fixed modification; and oxidation of methionine as a variable modification. The proteins with a confidence of >95% that matched at least five peptides were considered a significant identification.
Bioinformatics analysis
Bioinformatics analysis of these proteins was processed by DAVID (
Enzyme-linked immunosorbent assay
Enzyme-linked immunosorbent assay (ELISA) was performed to verify the results of MS. The maternal serum samples were collected from 11 pregnant women with a fetus affected by DS and 10 pregnant women with fetuses not affected by DS. The pregnant women underwent prenatal screening in our hospital. Three of 11 cases were the subjects who underwent 2-DE and MS in the present study.
The serum concentrations of the proteins were detected by ELISA. All assays were based on a non-competitive sandwich ELISA method using commercially available kits purchased from R&D (Minneapolis, MN, USA). The main protocol was performed as described previously. 33
Statistical analysis
All data were collected and statistically analyzed by SPSS 13.0 software. A P value <0.05 was considered statistically significant. The results of non-parameters were expressed as the median (M), 2.5th percentile (P2.5) and 97.5th percentile (P97.5). Non-parametric tests were used to compare differences in the median level (Mann-Whitney U test).
Results
The gels were scanned and analyzed with ImageMaster 2D Platinum software (GE Healthcare). All spots were depicted in the marked area, which is shown in Figure 1. Forty-seven spots were statistically different in maternal serum derived from the DS group than the CG. The spots were therefore considered significant for further evaluation. The spots were analyzed by MALDI-MS for identification purposes. Among the 47 spots, 29 different proteins were identified. The 29 proteins are shown by entry name, protein name, molecular weight, isoelectric point, MASCOT score, protein coverage, and expected value in Table 2. Fourteen of 29 proteins were up-regulated in patients, while the other 15 proteins were decreased. The mean of expression density and fold-change are shown in Table 3. The top five proteins which increased in the DS group were serotransferrin (TF; P02787), alpha-1b-glycoprotein (A1BG; P04217), desmin (DES; P17661), alpha-1-antitrypsin (SERPINA1; P01009) and ceruloplasmin (CP; P00450). In contrast, the serum amyloid P-component (APCS; P02743) was the most down-regulated protein.
Two-dimensional gel electrophoresis images of serum from Down’s syndrome mothers (b) and control pregnant women (b). Note: 53 different protein spots between the two groups were shown in the Figure 1. Twenty-nine highlighted protein spots were successfully identified by matrix-assisted laser desorption/ionization mass spectrometry Twenty-nine proteins differentially expressed in maternal serum with Down's syndrome MW, molecular weight; PI, isoelectric point; Expect, expected value Expression level of the 29 proteins DS, Down's syndrome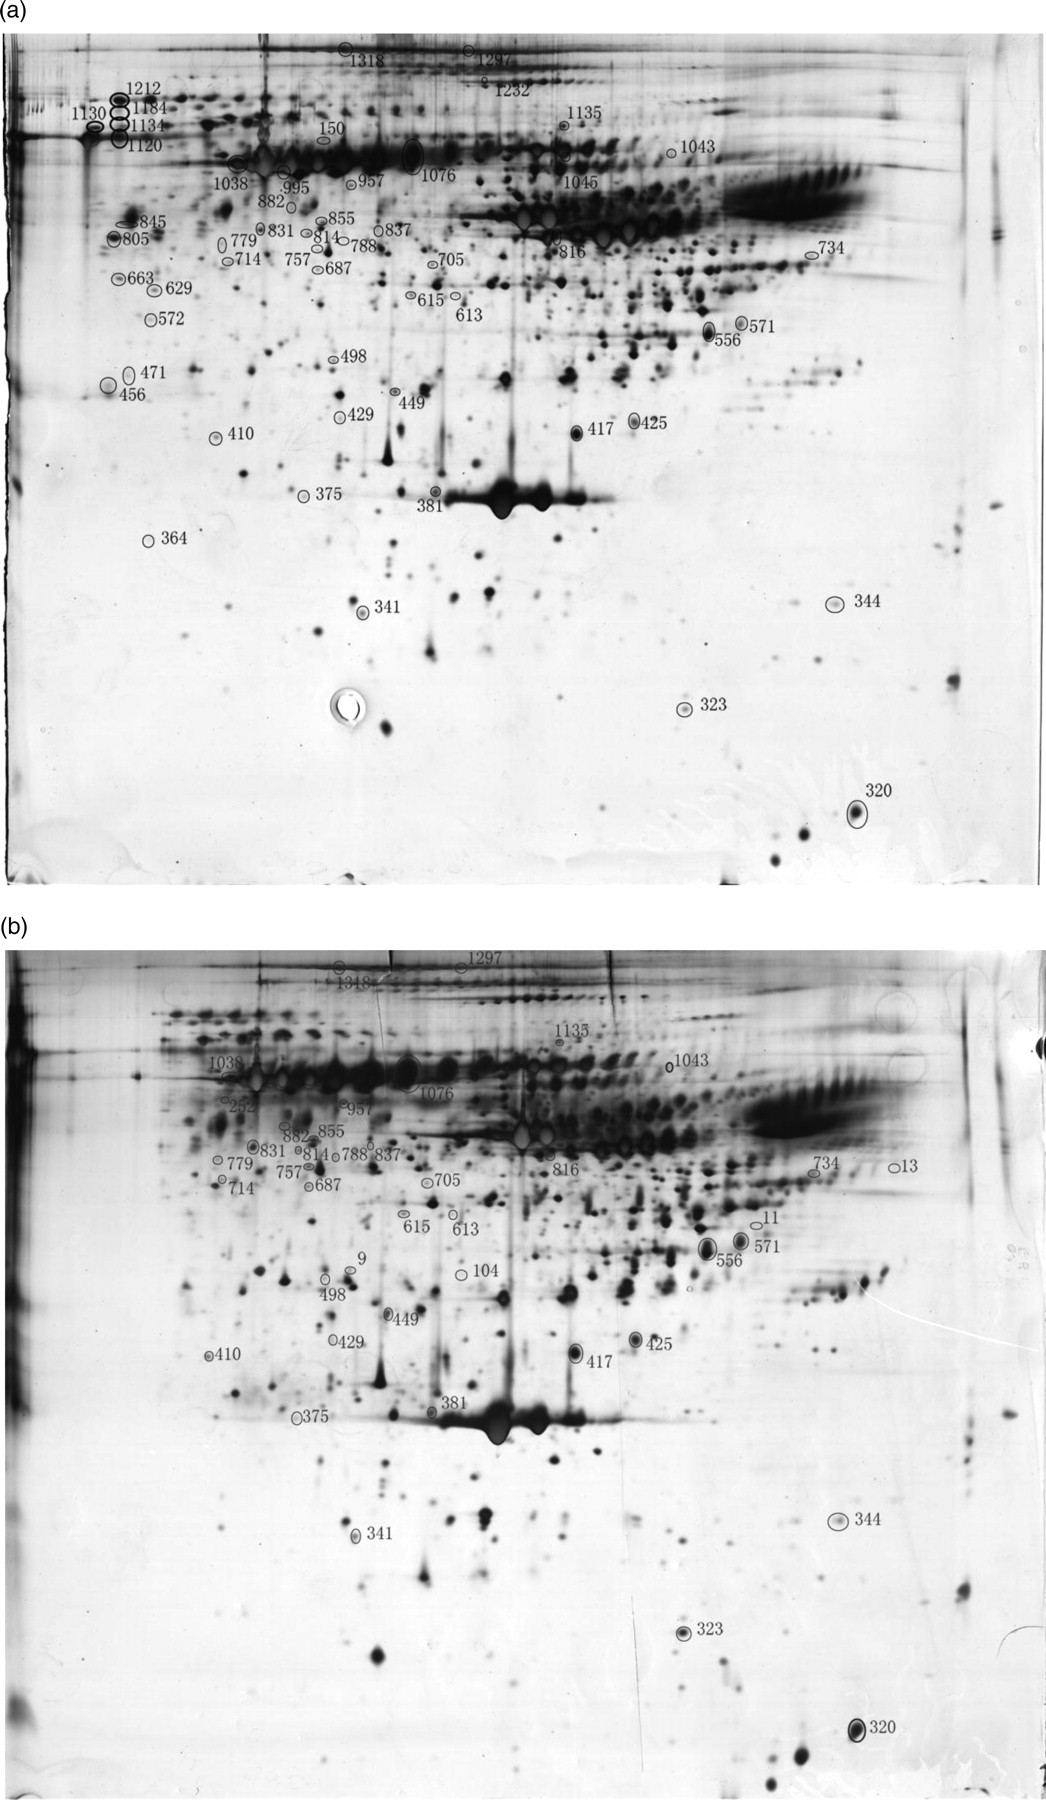
In previous studies, Nagalla et al.
29
and Lopez et al.
25
reported 25 and 12 proteins, respectively, that were differentially present in maternal serum of pregnancies with fetuses affected by DS. Taken together with our findings, a total of 66 proteins have been identified to process different expression between the DS and control groups (Table 4). Figure 2 shows a Venn diagram that compares the 29 proteins identified from our study with 37 proteins from previous publications. Ten of 66 proteins overlapped among these three individual studies, but only one protein was found in all of the studies. The number in the overlapping area was the number of proteins that overlapped between the sets located on the opposite sides.
Diagram of proteins identified between our study and previous related literature. Note: The intersections between Nagalla et al.,
22
Lopez et al.
28
and our study are shown. The numbers in parentheses are the number of proteins that overlap between the sets located at the opposite sides. (A color version of this figure is available in the online journal) The differential proteins in our study and previous reports
The SWISS-Pro accession, gene name, biological process ontology, molecular function ontology and cellular component of the 29 proteins are listed in Table 5. We annotated these proteins by the gene ontology (GO) method. Figure 3a shows the GO molecular function category of 29 proteins. The majority were binding proteins (53.3%), proteins with catalytic activity (12.9%), proteins with hydrolase activity (10.7%), proteins with enzyme regulator activity (6.7%) and proteins with transporter activity (6.7%). In contrast, the proteins were also mapped within the GO biological process category. The top five biological processes of these proteins were biological regulation (13.5%), metabolic process (13.5%), cellular process (13.5%), response to stimulus (11.3%) and establishment of localization (8.3%), as shown in Figure 3b.
Classification of identified maternal serum proteins with Down's syndrome-based on gene ontology: (a) Molecular Function Ontology; (b) Biological Process Ontology. (A color version of this figure is available in the online journal) List of the biological process and molecular function of these 29 proteins
From the 29 protein biomarkers, we preliminarily selected two proteins (CP and complement factor B [CFB, P00751]) to verify whether or not the biomarkers were new biomarkers. The reasons we selected CP were as follows: CP increased in serum samples of mother with fetuses affected by DS and exhibited a relatively high DS to CG fold-change (5.43; Table 3); according to previous studies, CP might be related to brain damage, 34,35 and one of the classic symptoms of DS is that cognitive capabilities are impaired; and the gene coding for superoxide dismutase (SOD1) is located on chromosome 21 and overproduction of SOD1 may be a cause of production of CP protein. 36
The median concentration of CP was 332.3 ng/mL in the DS group and 242.0 ng/mL in the control group (Table 6, Figure 4a). The protein was significantly higher in the DS group than the CG (P < 0.05). There was a significant difference between the two groups.
The concentrations of two proteins in maternal serum: (a) ceruloplasmin (CP); (b) complement factor B (CFB) Level of CP and CFB in maternal serum by ELISA CP, ceruloplasmin; CFB, complement factor B; DS, Down's syndrome; ELISA, enzyme-linked immunosorbent assay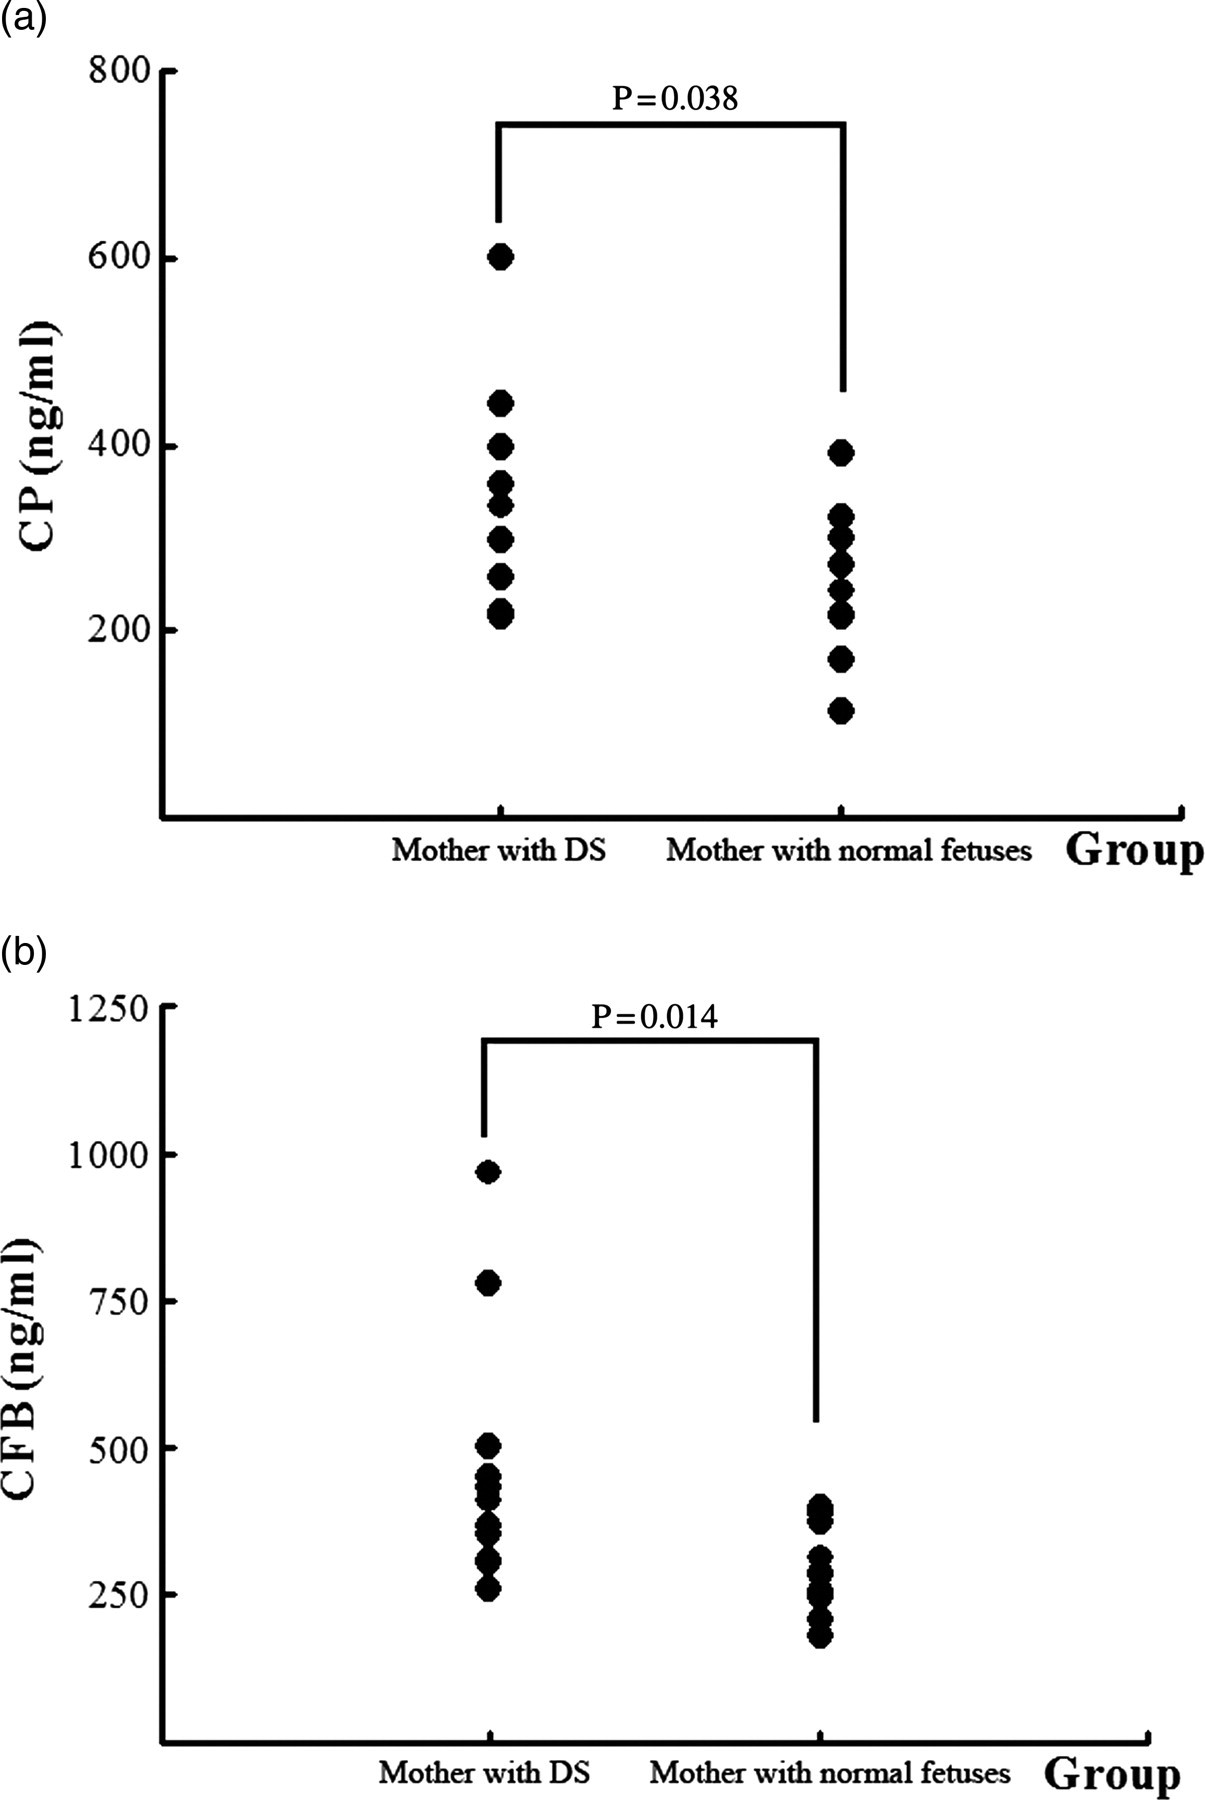
CFB was selected for three reasons, as follows: CFB is only expressed in women with fetuses affected by DS, and the fold-change was 17.5/0 (Table 3); previous studies suggest that CFB is also associated with brain diseases; 37,38 and some reports have shown that there is a relationship between DS and the complement system. 39,40
The median concentration of CFB was 412.3 and 285.6 ng/mL in the DS group and CG group, respectively. Similar to the results of MS, the maternal serum level of CFB was significantly higher in the DS group than the CG group (P < 0.05; Table 6, Figure 4b).
Discussion
In recent years, based on MS and bioinformatics technology, proteomic studies have become a powerful platform for biomarker discovery, and bring new hope for identification of novel protein biomarkers. These biomarkers will revolutionize diagnostics for many diseases. To date, a very limited number of studies have been carried out to analyze maternal blood in search for biomarkers of DS. 23–25,29 The proteins which have been identified differ significantly. Most of the findings and candidate biomarkers are, in fact, high-abundance proteins because the majority of low-abundance proteins are difficult to quantify due to ion suppression effects. 19 Therefore, in this study, we attempted to apply the proteomics method in identification of biomarkers for DS.
First, we depleted the high-abundance proteins in serum, including albumin and IgG, which account for >80% of total serum proteins. Then, 2-DE was performed to distinguish the different expression of the proteins in maternal serum between the DS group and the CG group. Using the MALDI-MS method, 29 proteins were identified successfully. Among the proteins, 14 were up-regulated and 15 were down-regulated. Compared with the studies of Nagalla et al. 29 and Lopez et al., 25 10 of 66 proteins overlapped among the three studies. We also found that these proteins were located on chromosomes other than chromosome 21, consistent with the findings of Tsangaris et al. 20 It is possible that their activation is due to the over-expression of transcription factors located on chromosome 21. 20 These 29 proteins were mainly categorized into binding, catalytic activity, and enzyme regulator activity proteins. The biological roles involved biological regulation, metabolic process, cellular process and response to stimulus. It will be necessary to conduct corollary studies to determine whether or not these proteins are associated with the DS phenotype. Moreover, we found the top five proteins which were mostly increased in fetuses affected by DS were TF, A1BG, DES, SERPINA1 and CP, while APCS was the most down-regulated protein. It is remarkable that CFB, C4A, CPN1, CFHR1 and PLG were only detected in maternal serum derived from the DS groups and the fold-change of the level of expression was >1.5.
With respect to the 29 biomarker candidates, we attempted to preliminarily verify two proteins (CP and CFB) by ELISA, and investigated whether or not the proteins could contribute to maternal serum screening for DS as new biomarkers. Ceruloplasmin (CP, P00450) was significantly increased in the DS group. Consistent with our findings, Nagalla et al. 29 and Kolialexi et al. 24 also identified CP in maternal blood (serum and plasma) derived from mothers with fetuses affected by DS.
As an iron transport protein, CP plays an important role in physiological iron homeostasis in the brain and neuronal survival. 41 Abnormal CP levels have been associated with neurodegenerative diseases 34 , such as Alzheimer's disease (AD) and Parkinson's disease. Especially for AD, a decrease in CP could reflect a decrease in cellular metabolic processes, such as the electron transport system and a decrease in the ability of the brain to protect itself from oxidative damage. CP is associated with neurological events in AD. 42 Furthermore, as a temporal model for studying the development of AD, the brains in fetuses affected by DS often have similar changes to brains in patients with AD. 43 Recently, Perluigi et al. 35 reported that oxidative damage is an early event in the pathogenesis of DS and might contribute to the development of deleterious DS phenotypes. Moreover, both CP and SOD1 are the main free radical scavengers in oxidative stress. 36 The gene coding for SOD1 is located on chromosome 21, and the over-production of SOD1 may be a cause of abnormal expression of CP protein. In the present study, the results of MS followed with 2-DE and ELISA showed a significant increase of CP in maternal serum from the DS group, suggesting that CP, as a new biomarker, could be used for prenatal screening of DS. The alternative pathway represented another important arm for complement activation. Complement factor B (CFB, P00751) plays an important role in that process. Strohmeyer et al. 37 reported that CFB was present in the frontal cortex of AD, and was significantly increased, indicating alternative pathway activation, suggesting that conditions conducive to chronic alternative pathway activation may exist in the AD brain. Some reports have also shown that there is a relationship between DS and the complement system. 39,40 For example, C1q were positive in the DS group and was associated with activated microglia. These studies provide evidence for antibody-mediated inflammatory factors contributing to the rapid accumulation of neuropathology in the brains of patients with DS. 39 It was very noteworthy that we found CFB to be associated with DS for the first time. The concentration of CFB significantly increased in the serum of mothers with fetuses affected by DS, and the serum concentration was significantly higher in the DS group than the CG group. According to our study, both proteins are likely to be associated with the brain damage which occurs in DS, but the exact mechanism needs further research.
Conclusion
In the present study, we have used 2-DE and MS to identify the different expression of proteins in maternal serum between the DS and control groups. The interesting protein candidates were further tested by ELISA. Among the 29 proteins in the present study, the top five proteins which were mostly increased in DS cases were TF, A1BG, DES, SERPINA1 and CP, while APCS was the most down-regulated protein. We will conduct corollary studies to understand how these candidate proteins are related to the etiology and function of DS. We conclude that proteomic approaches offers the possibility of further improving the performance of DS screening, but still needs clinical verification as a prenatal screen. Moreover, the functional roles of these proteins in the development of DS are worthy of further study.
Footnotes
ACKNOWLEDGEMENTS
We thank all the project participants for their contributions. At the same time, we thank professional help from the Institutes of Biomedical Sciences, Fudan University (Shanghai, China) and Biorefer Pte Ltd (Jiangsu, China). This study was supported by grants from Changzhou Health Bureau (ZD200904, QN200801) and Graduate Innovation Project of Jiangsu Province (CXLX11-0607). The study design and protocol were reviewed and approved by the ethics committee of Changzhou Woman and Children Health Hospital affiliated to Nanjing Medical University.