
Abstract
Coccid-derived natural food colorants contain active ingredients that potentiate inhibition of tissue proteolysis mediated by activation of plasma hyaluronan-binding protein (PHBP). In the present study, we examined the effect of lac color (LC) and cochineal extract (CE), representative coccid-derived colorants containing laccaic acid and carminic acid as active ingredients, in an intracapsular invasion model of experimental thyroid cancers using rats. One week after initiation with N-bis(hydroxypropyl)nitrosamine, male F344/NSIc rats were fed a powdered diet containing 5.0% LC or 3.0% CE during promotion with 0.15% sulfadimethoxine (SDM) in the drinking water for 13 weeks. Capsular invasive carcinomas (CICs) and lung metastases were decreased by LC treatment and accompanied by transcript downregulation on angiogenesis and PHBP-related tissue proteolysis in CICs. In contrast, CE upregulated angiogenesis-related genes in CICs. PHBP was expressed in capsular macrophages and thyroid proliferative lesions with increased intensity in CICs, and LC decreased PHBP-expressing CICs. The size of CICs and their proliferation activity, however, were unchanged compared with those treated with SDM alone. Suppression of cancer by invasion by LC was more evident after an eight-week treatment, exhibiting a profound decrease in tenascin-C-positive early invasive foci and marked reductions in capsular inflammation and fibrosis. These results suggest that LC and CE exerted dissimilar effects on CIC development, the former suppressing the initial step of neoplastic cell invasion into the capsule by targeting PHBP activity of macrophages and neoplastic cells on tissue proteolysis involving inflammatory responses and angiogenesis, and the latter promoting angiogenesis of developed CICs at later stages.
Introduction
Tumor microenvironments comprising cancer-associated fibroblasts (CAFs), endothelial cells and a number of immune cells (including tumor-associated macrophages) are recognized as critical components in the initiation and development of carcinogenesis. 1–4 In vivo cancer invasion models allow not only an understanding of the mechanisms of tumor development but also identification of better therapeutic and diagnostic strategies. Rat thyroid follicular cell carcinomas invading the thyroid capsule, termed as capsular invasive carcinomas (CICs), are produced at a high level by promotion with sulfadimethoxine (SDM) in the short term, in contrast to the less frequent parenchymal carcinomas (PCs) in the rat two-stage thyroid carcinogenesis model. CICs are characterized by atypical neoplastic cells having large nuclei with prominent nucleoli and mixtures of microfollicular and solid patterns without accompanying papillary growth patterns observed in human thyroid carcinomas, growing in the thyroid capsular tissues accompanied by extracellular matrix formation. 5,6 In this SDM-promotion model, development of CICs is associated with capsular thickening and preceding or concomitant inflammatory cell responses. 5,6 Our previous study suggested activation of the phosphoinositide 3-kinase signaling pathway involving phosphatase and tensin homolog (PTEN) and active Akt isoforms and their downstream molecules in association with the development of lesion stages from early focal follicular cell hyperplasias (FFCHs) to late-stage carcinomas of both CICs and PCs. 7 This model could be appropriate for evaluation of therapeutics preventing cancer invasion and metastasis in the whole process of carcinogenesis from the generation of neoplastic cells to their metastasis, including their direct invasion into surrounding tissues.
Plasma hyaluronan-binding protein (PHBP), 8 alternatively termed factor VII-activating protease, is a serine protease implicated in both coagulation and activation of blood coagulation factor VII and the proenzyme form of urokinase-type plasminogen activator. 9,10 PHBP is present in plasma in a single-chain zymogen form (pro-PHBP) and autoproteolytically converts to an active two-chain form. 11 PHBP has been suggested to participate in physiological or pathological processes in which cell proliferation and migration are pivotal, such as tissue repair, vascular remodeling, wound healing and tumor development. 12 Therefore, an inhibitor of PHBP-activation may regulate physiological or pathological processes involved in PHBP.
Lac color (LC) and cochineal extract (CE) are red dyes of natural origin. They are obtained by aqueous extraction from the crushed, air-dried bodies of Coccus laccae in Southeast Asia and Dactylopius coccus Costa in South America, respectively.
13
They are widely used for coloring food. Both dyes also contain active ingredients having an anthraquinone backbone, and the major components of LC and CE are laccaic acid, with isoforms A, B and C (laccaic acid A is most prevalent), and carminic acid, respectively (Figure 1). Laccaic acid is a potent inhibitor of the protease of both autoactivation of the PHBP proenzyme and catalytic activity of the active enzyme.
14
Carminic acid is a specific inhibitor of polyamine-induced pro-PHBP autoactivation.
15
Structural formula of laccaic acid A, B and C and carminic acid
The purpose of this study was to evaluate the potency of LC and CE on tumor invasion using a CIC-induction model of rat two-stage thyroid carcinogenesis with SDM as a promoter. To investigate the stage of tumor development that LC and CE affect, we initially examined the long-term effect and then the short-term effect of LC or CE during SDM promotion. Modifying effects of these dyes on molecules involved in the formation of CICs were analyzed by microarray analysis and subsequent realtime reverse transcriptase polymerase chain reaction (RT-PCR). The inhibitory potential for pro-PHBP activation was also analyzed.
Materials and methods
Chemicals and animals
N-bis(2-hydroxypropyl)nitrosamine (DHPN) and SDM were purchased from Nacalai Tesque (Kyoto, Japan) and Sigma (St Louis, MO, USA). LC and CE were purchased from San-Ei Gen F.F.I. Co., Ltd (Osaka, Japan) and contained 76.6% laccaic acid and 28.5% carminic acid as major ingredients, respectively (supplier's analysis). Animal studies consisted of two experiments analyzing the effect of LC and CE in the long term (Experiment 1) and short term (Experiment 2) during tumor promotion with SDM. In both experiments, five-week-old male F344/NSlc rats (Japan SLC, Inc., Hamamatsu, Japan) were used. All animals were on a basal diet (MF diet; Oriental Yeast Co., Ltd, Tokyo, Japan), allowed water ad libitum during the one-week acclimatization period, and kept in polycarbonate cages with white wood chips for bedding in an air-conditioned animal room (24 ± 1°C, 55 ± 5% relative humidity; 12-h light and dark cycle).
Experimental design
In Experiment 1, rats were divided into five groups, each consisting of either eight or 16 animals. Four animals with similar initial mean body weights in each group were housed per cage. The rats received a single subcutaneous injection of 2800 mg/kg DHPN, and starting one week thereafter, they were given 0.15% SDM alone (16 animals), 0.15% SDM + 5.0% LC (16 animals), 0.15% SDM + 3.0% CE (16 animals), 5.0% LC alone (8 animals) or 3.0% CE alone (8 animals) for 13 weeks. LC and CE were administered in their diets. The treatment regimen with doses chosen here has been shown to exert no obvious toxicity in F344 rats. 16–18 SDM was administered in their drinking water. Body weight, food intake and water consumption were measured once a week. At week 13, all rats were killed after being anesthetized with ether. At autopsy, organs including the thyroids, lungs and mesenteric lymph nodes were collected for fixation with tissue fixatives. Before fixation, thyroids were macroscopically examined for the incidence of CICs. After weighing, thyroids were cut in half coronally. The rostral half of each thyroid lobe was fixed in 4% paraformaldehyde (PFA) and embedded in paraffin. The caudal half of each thyroid lobe was cut in half laterally, and the right half was fixed in methacarn solution and embedded in paraffin. If CICs (white nodules) existed in the caudal left half, they were excised, and the remaining thyroid tissues were individually snap-frozen with liquid nitrogen and preserved at −80°C until use. The lungs and mesenteric lymph nodes were fixed in 10% phosphate-buffered formalin (pH 7.4), and sections were stained with hematoxylin and eosin (HE).
In Experiment 2, rats were divided into three groups, each consisting of 15 animals with similar initial mean body weights in each group. One week after initiation with DHPN, animals were given 5.0% LC or 3.0% CE in the basal diet, co-administered with 0.15% SDM in their drinking water, for eight weeks. A group of animals that underwent SDM treatment alone was also created. At week 8, all rats were killed after being anesthetized with ether, and blood was collected from the aorta. At autopsy, organs including the thyroids were collected and weighed. Thyroids were cut in half coronally. The rostral half of each thyroid lobe was fixed in methacarn and embedded in paraffin. The caudal half of each thyroid lobe was cut in half laterally. The right half was fixed in 4% PFA and embedded in paraffin, and the caudal left half was snap-frozen with liquid nitrogen and preserved at −80°C until use. For hormone analysis, serum thyroid-stimulating hormone (TSH), triiodothyronine (T3) and thyroxine (T4) concentrations were measured by the chemiluminescent enzyme immunoassay method with the use of DPC Immulyze (Siemens Healthcare Diagnostics Inc., Deerfield, IL, USA).
All procedures of this study were conducted in compliance with the ‘Guidelines for Proper Conduct of Animal Experiments’ (Science Council of Japan, 1 June 2006) and according to the protocol approved by the Animal Care and Use Committee of the Tokyo University of Agriculture and Technology.
Histopathology
Histopathological assessment was performed on thyroid tissues obtained in Experiments 1 and 2. One coronal slice each from the left and right thyroid lobes embedded in paraffin were sectioned at 3 μm and stained with HE for microscopic examination. The numbers and areas of CICs in thyroid sections of both lobes from each animal in Experiment 1 were measured using WinROOF image analysis and measurement software (version 6.4.2; Mitani Corp., Fukui, Japan). The number of invasive foci into blood and lymphatic vessels in the thyroid capsule and adjacent thyroid parenchyma, termed as vessel invasive foci (VIFs), was also counted similarly in each animal in Experiment 1. To count lung metastases, HE-stained sections of two slices each from bilateral lobes were assessed in each animal in Experiment 1. Histological assessment was performed on the mesenteric lymph nodes.
Immunohistochemistry
Paraffin-embedded thyroid tissues were subjected to immunohistochemistry using the horseradish peroxidase avidin-biotin complex method utilizing a Vectastain® Elite ABC Kit for rabbit or mouse IgG (Vector Laboratories Inc., Burlingame, CA, USA) with 3,3′-diaminobenzidine/H2O2 as the chromogen. Antibodies for Ki-67 antigen (mouse monoclonal antibody; IgG1, clone MIB-5, 1:50; Dako Japan Inc., Kyoto, Japan) and PHBP (rabbit polyclonal antibody; 1:200) 15 were used for all cases in Experiment 1 using 4% PFA-fixed thyroid samples. Antibody for tenascin-C (TN-C; mouse monoclonal antibody; IgG1, clone 4C8MS, 1:100; Novus Biologicals, LLC, Littleton, CO, USA) was used for all cases in Experiments 1 and 2 using methacarn-fixed tissues. Antigen retrieval was carried out in an autoclave for 10 min at 120°C in 10 mmol/L citrate buffer (pH 6.0) for Ki-67.
RNA preparation, amplification and microarray analysis
From a 10-μg aliquot of total RNA extracted from CIC samples (N = 4/group) in Experiment 1 with an RNeasy Mini Kit (Qiagen, Hilden, Germany), double-stranded cDNA was synthesized using the Superscript™ Double-Stranded cDNA Synthesis Kit (Invitrogen Corp., Carlsbad, CA, USA). After labeling with Cy3, 6 μg of labeled cDNA samples were hybridized with the Rattus norvegicus Roche NimbleGen microarray for Gene Expression (Roche NimbleGen, Inc., Madison, WI, USA; Euk Expr 385K Catalog Arr, 26,739 targets/microarray). Using a robust multiarray average normalization method,
19
differentially expressed genes between the SDM-alone and each of the LC- or CE-treated groups were analyzed. The genes that were up- or downregulated in expression with a ≥2-fold difference compared with those in the SDM-alone group were statistically analyzed. Gene information was retrieved from the National Center for Biotechnology Information (
Realtime RT-PCR analysis
Expression analysis of mRNA for genes related to PTEN/Akt signaling and those showing significant up- or downregulation by microarray analysis was performed with realtime RT-PCR in tissue samples of CICs and parenchymal tissues obtained from Experiment 1 (n = 8 of each tissue type/group). First-strand cDNA was synthesized from 2 μg of total RNA in the presence of dithiothreitol, dNTPs, random primers, RNaseOUT and SuperScript™ III Reverse Transcriptase (Invitrogen Corp.) in a 20-μL total reaction mixture. Realtime PCR was performed using the SYBR® Green PCR Master Mix (Applied Biosystems Inc., Foster City, CA, USA) and the ABI Prism 7000 Sequence Detection System (Applied Biosystems Inc.) according to the manufacturer's protocol. The PCR primers shown in Supplementary Table 1 were designed using Primer Express software (Version 3.0; Applied Biosystems Inc.). For all supplementary tables, please see
Statistical analysis
Numerical data were compared between the SDM-alone group and the SDM + LC or SDM + CE groups using Student's t-test when the variance was proven to be homogeneous among the groups by the equal variance test. When a significant difference in variance was observed, Aspin–Welch's t-test was performed.
Incidence data were compared between the SDM-alone group and the SDM + LC or SDM + CE groups using Fisher's exact probability test.
Scored data of histopathological lesions were compared between the SDM-alone group and the SDM + LC or SDM + CE groups using Mann-Whitney's U-test. Mean intensity scores of PHBP immunoreactivity of the thyroid proliferative lesions in the SDM-alone group were compared between the FFCHs and adenomas, PCs or CICs in Experiment 1, similarly.
Results
Water and food consumptions and final body and thyroid weights in Experiments 1 and 2
In both Experiments 1 and 2, weekly water and food consumptions were not statistically different between the SDM-alone group and the SDM + LC or SDM + CE-groups (data not shown). Although statistical analysis could not be applied, overall mean values of water and food consumptions were not different between the SDM-alone group and the SDM + LC or SDM + CE groups in both Experiments 1 and 2 (Supplementary Tables 2 and 3). In Experiment 1, the overall mean values of water and food consumptions were slightly higher in the LC- and CE-alone groups compared with those in the SDM-exposed groups.
In both Experiments 1 and 2, the final body weight was not statistically different between the SDM-alone group and the SDM + LC or SDM + CE-groups (Supplementary Table 4).
In Experiment 1, both absolute and relative thyroid weights were significantly lower in the SDM + LC group compared with the SDM-alone group (Supplementary Table 4). Relative thyroid weight was also significantly lower in the SDM + CE group compared with the SDM-alone group. Both absolute and relative thyroid weights were not statistically different between the LC-alone and CE-alone group (data not shown). In Experiment 2, both absolute and relative thyroid weights significantly decreased in the SDM + LC group compared with the SDM-alone group, while those of the SDM + CE group did not differ from those of the SDM-alone group.
Serum concentrations of thyroid-related hormones in Experiment 2
Serum concentrations of thyroid-related hormones were examined in Experiment 2. T3 levels were unaltered between the SDM-alone group and the SDM + LC or SDM + CE groups (Supplementary Table 5). T4 levels were under the detection limit in all SDM-promoted animals. The TSH concentration of the SDM + LC group was significantly lower than that in the SDM-alone group, while that in the SDM + CE group was unchanged compared with that of the SDM-alone group.
Mesenteric lymph nodal changes in Experiment 1
Increased infiltration of macrophages and mast cells was observed in the sinusoids of the mesenteric lymph nodes in the SDM + LC and SDM + CE groups, with statistically significant differences in the grade of scores compared with the SDM-alone group (Supplementary Figure 1; please see
CICs, parenchymal proliferative lesions and lung metastases in Experiment 1
CICs in the thyroid were grossly counted, and the multiplicity per animal was estimated from each dorsal and ventral view (Figure 2a). The multiplicities of CICs were not different between the dorsal and ventral views in each group; therefore, the total numbers of CICs per animal counted from both views were compared among the groups. The SDM + LC group had a significantly decreased total number of CICs compared with the SDM-alone group. On the other hand, the SDM + CE group had a significantly increased total number of CICs compared with the SDM-alone group.
Capsular invasive carcinomas (CICs) in the thyroid and lung metastases in Experiment 1. (a) Left panel shows gross appearance of the thyroid after 13-week promotion with sulfadimethoxine (SDM), producing multiple white nodules of CICs as indicated by arrowheads within the fibrously thickened thyroid capsule. The graph shows the grossly counted CICs/rat from the dorsal (open column) and ventral (black column) views in the SDM-alone, SDM + lac color (LC) and SDM + cochineal extract (CE) groups. Numbers of animals examined were 12 for SDM-alone, 14 for SDM + LC and 13 for SDM + CE. **P < 0.01 versus SDM-alone (Student's or Aspin–Welch's t-test). (b) Left upper panel shows a high-power view of a CIC. Hematoxylin and eosin (HE) stain. Magnification: ×200. Left lower panel shows tenascin-C (TN-C)-positive CICs. Magnification: ×200. Graphs show the number of CICs/section/rat, number of TN-C-positive or -negative CICs, total area of CICs/section/rat, and mean area of CIC in the SDM-alone, SDM + LC, and SDM + CE groups. In all analyses, numbers of animals examined were 12 for SDM-alone, 14 for SDM + LC and 13 for SDM + CE, except for analysis of TN-C-immunoreactive CICs using 8 animals/group. *,**P < 0.05, 0.01 versus SDM-alone (Student's or Aspin–Welch's t-test). (c) Left upper panel shows a high-power view of vascular invasion in the thyroid capsule. HE stain. Magnification: ×200. Left lower panel shows a low-power view of a metastatic focus of thyroid follicular cell carcinoma to the lung. HE stain. Magnification: ×200. Graphs show the number of vessel invasive foci (VIFs) in the thyroid capsule and adjacent parenchyma and the incidence of lung metastases in the SDM-alone, SDM + LC, and SDM + CE groups. In both measurements, numbers of animals examined were 12 for SDM-alone, 14 for SDM + LC and 13 for SDM + CE. *P < 0.05 versus SDM-alone (Student's or Aspin–Welch's t-test), #
P < 0.05 versus SDM-alone (Fisher's exact probability test). (A color version of this figure is available in the online journal)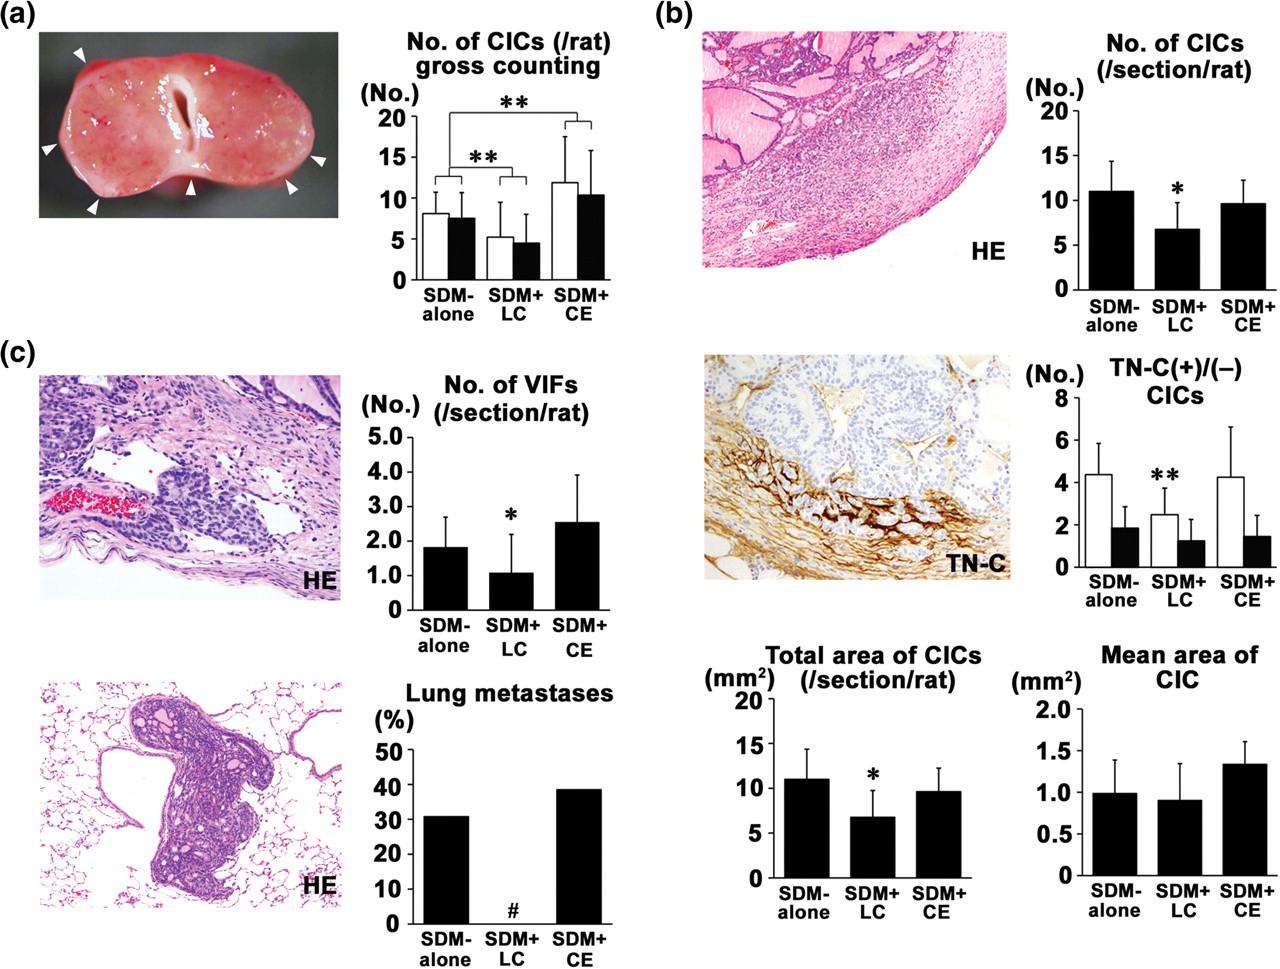
The numbers of histologically detected CICs and TN-C-positive CICs per section per animal in the SDM + LC group were significantly lower than those of the SDM-alone group, while the number of TN-C-negative CICs was unchanged between the two groups (Figure 2b). The total area of CICs per section per animal in the SDM + LC group was significantly lower than that of the SDM-alone group, while the mean area of CICs did not differ between the two groups. The mean number of CICs and that of TN-C-positive or -negative CICs and total and mean areas of CICs were not different between the SDM-alone and SDM + CE groups, while an increasing tendency in the mean CIC area was observed in the latter.
With regard to the parenchymal proliferative lesions (PPLs), the SDM + LC-group had significantly decreased multiplicity of adenomas compared with the SDM-alone group (Supplementary Table 6). On the other hand, the SDM + CE group had significantly increased multiplicity of adenomas compared with the SDM-alone group. Formation of PCs was much less than that of CICs, but the SDM + LC-group had significantly decreased multiplicity of PCs similarly to CICs compared with the SDM-alone group, while the SDM + CE group had an unchanged multiplicity compared with the SDM-alone group.
With regard to vessel invasion within the thyroid capsule and parenchyma as well as lung metastases, the SDM + LC group had significantly decreased multiplicity of VIFs and incidence of lung metastases compared with the SDM-alone group, while the SDM + CE group did not alter these parameters (Figure 2c).
The LC-alone and CE-alone groups developed neither proliferative lesions in the thyroid nor lung metastases (data not shown).
Ki-67-positive cell indices in thyroid proliferative lesions in Experiment 1
Strong immunoexpression of Ki-67 nuclear antigen was observed in CICs, although the ratio of positive cells varied among CIC lesions. The ratio of Ki-67-positive cells in CICs was not significantly different between the SDM-alone group and the SDM + LC or SDM + CE groups (Supplementary Table 7). With respect to PPLs, the SDM + LC group had a reduced ratio of Ki-67-positive cells in adenomas compared with the SDM-alone group, while the ratios in FFCHs and PCs were not significantly different from those of the SDM-alone group. The SDM + CE group did not have an altered ratio of Ki-67-positive cells in FFCHs, adenomas or PCs compared with the values in the SDM-alone group.
Gene expression changes by microarray analysis in Experiment 1
Realtime reverse transcription polymerase chain reaction analysis in the CICs and thyroid parenchymal tissues in Experiment 1
Akt1, v-akt murine thymoma viral oncogene homolog 1; Akt1s1, AKT1 substrate 1; Cdk2, cyclin-dependent kinase 2; Cdkn1a, cyclin-dependent kinase inhibitor 1A; CE, cochineal extract; CICs, capsular invasive carcinomas; Hif1a, hypoxia-inducible factor 1, alpha subunit; Kdr, kinase insert domain receptor; LC, lac color; Mmp2, matrix metallopeptidase 2; Mmp9, matrix metallopeptidase 9; Mtor, mechanistic target of rapamycin (serine/threonine kinase); Nfkb1, nuclear factor of kappa light polypeptide gene enhancer in B cells 1; PTEN, phosphatase and tensin homolog; Ptgs2, prostaglandin-endoperoxide synthase 2; Rps6kb1, ribosomal protein S6 kinase; SDM, sulfadimethoxine; Tp53, tumor protein p53; Vegfa, vascular endothelial growth factor A; Vegfb, vascular endothelial growth factor B; Vegfc, vascular endothelial growth factor C
*,**P< 0.05, 0.01 versus SDM-alone (Student's or Aspin–Welch's t-test)
Expression of PHBP and downstream molecules in Experiment 1
The transcript level of Phbp and its downstream molecules, such as Plau and Plat,
11,21
were examined by realtime RT-PCR in both PPLs and CICs in Experiment 1 (Figure 3a). In PPLs, transcript levels of Phbp, Plau and Plat were not statistically different between the SDM-alone group and the SDM + LC or SDM + CE-group. In CICs, while the difference was not statistically non-significant in Phbp, the SDM + LC-group showed decreased transcript levels of Phbp, Plau and Plat compared with the SDM-alone group. The SDM + CE-group did not show altered transcript levels of these genes.
Expression changes of plasma hyaluronan-binding protein (PHBP) and downstream molecules in Experiment 1. (a) Transcript expression changes of Phbp and its downstream molecules, Plau and Plat, in the area of parenchymal proliferative lesions (PPLs; open column) and capsular invasive carcinomas (CICs; black column) induced by promotion with sulfadimethoxine (SDM) in the SDM-alone, SDM + lac color (LC) and SDM + cochineal extract (CE) groups. Numbers of animals examined were 8/group. **P < 0.01 versus SDM-alone (Student's or Aspin–Welch's t-test). (b) Photomicrographs show representative PHBP immunoreactivity in the thyroid proliferative lesions induced by promotion with SDM. Left upper panel: focal follicular cell hyperplasia (FFCH) showing slight immunoreactivity; right upper panel: adenoma (Ad) showing strong immunoreactivity; left lower panel: CIC showing strong immunoreactivity; right lower panel: capsular inflammatory cell infiltration adjacent to a CIC showing PHBP immunoreactivity in macrophages. Margin of FFCH is marked with arrowheads, and the asterisk indicates PHBP-positive neoplastic cells consisting of a CIC. Magnification: ×100 (FFCH, Ad, CIC) and ×400 (capsular inflammatory cell infiltration). Graphs show mean intensity scores of PHBP in FFCHs, Ads, parenchymal carcinomas (PCs), and CICs in the SDM-alone group and the number of PHBP-positive CICs in the SDM-alone, SDM + LC and SDM + CE groups. Grades of PHBP-immunoreactivity scores: 3, strong; 2, moderate; 1, slight; 0, none. Numbers of proliferative lesions examined were 10/animal for both FFCH and Ad and all carcinomas (56 PCs and 94 CICs) in a total of 12 animals in the SDM-alone group. Numbers of animals for examination of PHBP-positive CICs were 15 for SDM-alone, 15 for SDM + LC and 14 for SDM + CE. **P < 0.01 versus SDM-alone or FFCHs (Mann–Whitney's U-test or Student's or Aspin–Welch's t-test). (A color version of this figure is available in the online journal)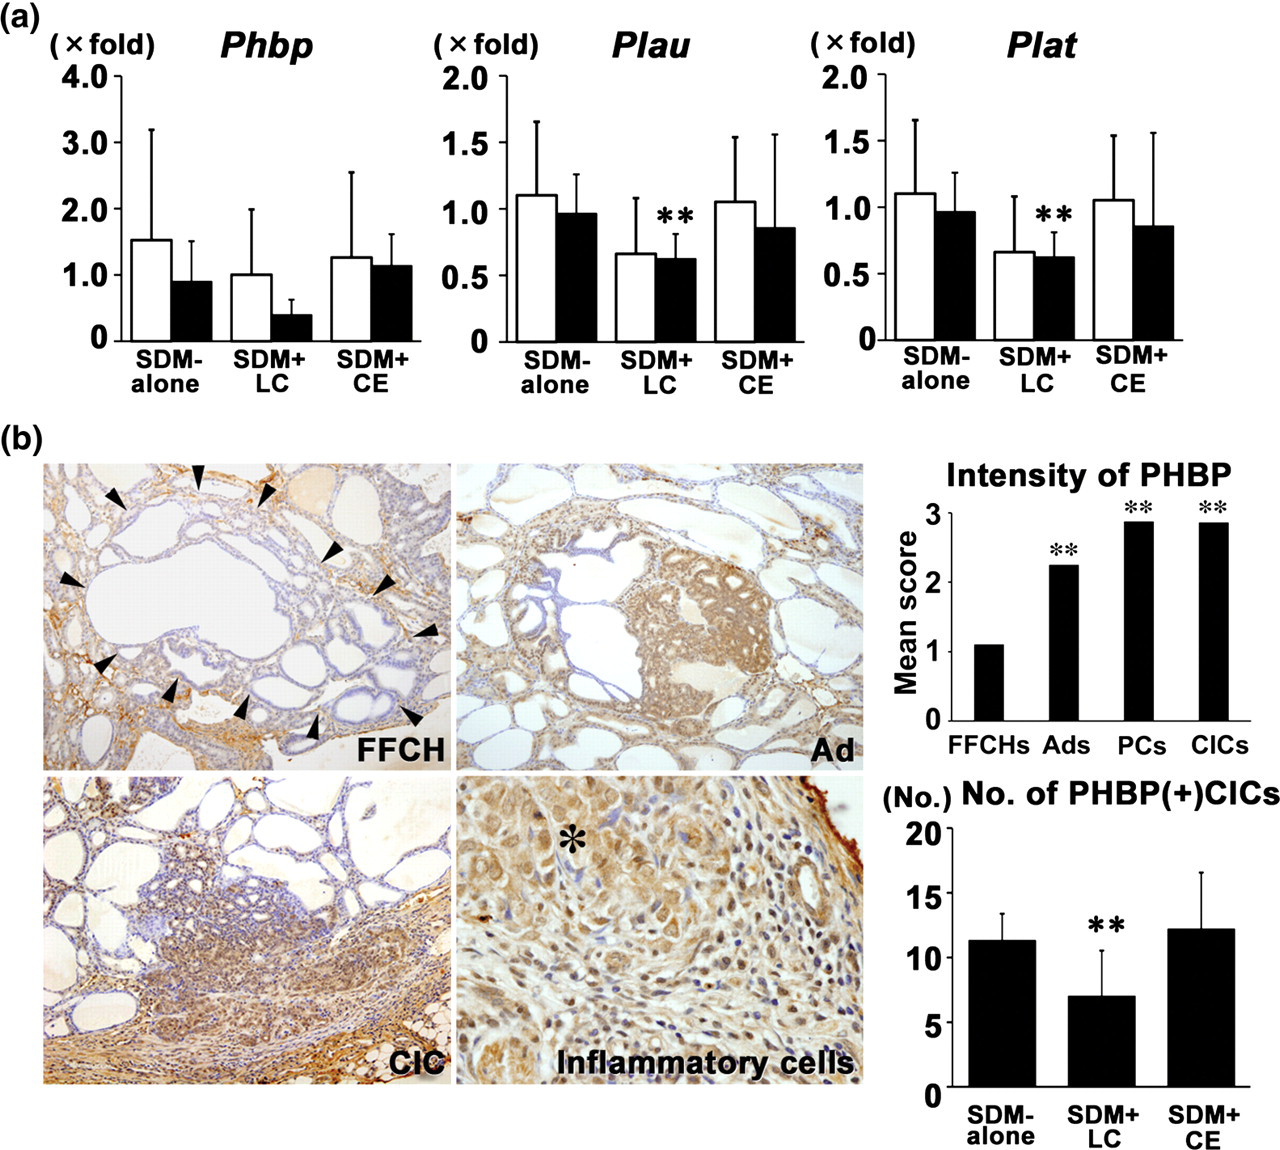
Immunohistochemically, PHBP was exclusively expressed in carcinomas (CICs and PCs) with strong staining intensity, while parenchymal FFCHs showed weaker staining intensity (Figure 3b). Adenomas attained intermediate scores between the FFCHs and carcinomas. The number of PHBP-positive CICs in the SDM + LC group was significantly lower than that of the SDM-alone group, while the SDM + CE group showed an unchanged number of PHBP-positive CICs. Macrophages infiltrating within the capsule also showed PHBP-positive immunoreactivity.
Changes in capsular thickness and TN-C-positive foci in Experiment 2
In Experiment 2, the SDM + LC group had significantly reduced capsular thickness compared with the SDM-alone group (Figure 4a). In addition, inflammatory cell infiltration consisting of lymphocytes and macrophages into the capsule was suppressed in the SDM + LC group compared with the SDM-alone group. By CE treatment, both capsular thickness and inflammatory cell infiltration were unchanged compared with the SDM-alone group.
Capsular fibrosis, inflammatory cell responses, and formation of early capsular invasive foci in Experiment 2. (a) Low-power view of the thyroid after 8-week promotion with sulfadimethoxine (SDM). Note that thyroid in the SDM + lac color (LC) group shows lack of a fibrously thickened capsule in contrast to the apparent capsule formation in the SDM-alone or SDM + cochineal extract (CE) groups. Hematoxylin and eosin (HE) stain. Magnification: ×12.5. Graphs show mean capsular thickness and severity scores of inflammatory cell response in the thyroid capsule induced after eight-week SDM promotion. Both parameters were bilaterally measured. Grade of inflammatory cell response scores: 3, severe; 2, moderate; 1, slight; 0, none. Numbers of animals examined were 15 for SDM-alone, 15 for SDM + LC and 14 for SDM + CE. **P < 0.01 versus SDM-alone (Student's or Aspin–Welch's t-test or Mann–Whitney's U-test). (b) Early capsular invasive focus of proliferative follicular cells as revealed by tenasicin-C (TN-C)-immunoreactivity. Left panel: HE stain. Right panel: TN-C-immunohistochemistry. Magnification: ×400. Graph shows the number of TN-C-positive foci in the thyroid capsule in the SDM-alone, SDM + LC and SDM + CE groups. Numbers of animals examined were 15 for SDM-alone, 15 for SDM + LC and 14 for SDM + CE. **P < 0.01 versus SDM-alone (Student's or Aspin–Welch's t-test). (A color version of this figure is available in the online journal)
The number of TN-C-positive foci that formed within the capsule to represent the early stage of CICs significantly decreased in the SDM + LC group compared with the SDM-alone group (Figure 4b). The SDM + CE group showed an unchanged number of TN-C-positive foci compared with the SDM-alone group.
Transcript levels of PTEN/Akt signaling and downstream genes in Experiment 2
In Experiment 2, whole thyroid tissue was subjected to realtime RT-PCR analysis. The SDM + LC group showed significantly decreased mRNA expression levels of inflammation and angiogenesis-related molecules downstream of PTEN/Akt signaling, such as Mmp9, Hif1a, Vegfa, Nfkb1 and Nos2, compared with the SDM-alone group (Supplementary Table 10). On the other hand, CE did not alter the expression levels of these genes except for a slight reduction in the Vegfa transcript level compared with the SDM-alone group.
Discussion
Until now, there have been no studies showing any effect of LC or CE on cytotoxicity, angiogenic activity or oncogenic activity. In the present study, we observed development of thyroid capsular inflammation and signature of nascent capsular invasion of neoplastic cells to form CICs as judged by immunolocalization of TN-C, an extracellular matrix glycoprotein secreted from CAFs at the invasion front, 22 at week 8 of SDM promotion. At week 13, we observed rapid progression to form CICs, VIFs and lung metastases. LC inhibited the multiplicity of CICs or TN-C-positive foci at weeks 8 and 13. Because the size of the resultant CICs at week 13 was unchanged with SDM alone, LC treatment was judged to exert an inhibitory effect on the initial step of neoplastic cell invasion into the capsule. Considering the profound inhibition of the capsular inflammatory cell infiltration and fibrosis at week 8, the anticarcinogenic effect of LC may involve inhibition of capsular inflammation. Decreased transcript levels of angiogenesis-related molecules in the CICs, as detected at week 13, suggest an inhibitory action of LC on angiogenesis. On the other hand, CE did not modify the development of TN-C-positive foci at week 8. However, at week 13, CE increased grossly detected CICs, while this increase was not reflected in the multiplicity data assessed histologically. Considering a slight but non-significant increase in the mean CIC area at week 13, CE may exert subtle tumor-promoting activity on the developed CICs. Because the resultant CICs increased the transcript levels of angiogenesis-related genes, CE may facilitate angiogenesis.
Irrespective of the similar purpurin-based chemical structure of the active ingredients in LC and CE, LC exerted an inhibitory action on tumor development; in contrast, CE exerted no activity or even facilitative activity. The reason for the dissimilar responses between LC and CE may be due to the difference in the route for the inhibition of autoactivation of the PHBP proenzyme as a target of the active ingredients of LC and CE, i.e., laccaic acid and carminic acid, respectively. 14,15 The difference in the dose of LC and CE in terms of the concentration of the active ingredient may also have affected the outcome. In Experiment 1 of the present study, laccaic acid in LC and carminic acid in CE were approximately 1.8 and 0.4 g/kg/d, respectively. We also found significant decreases in transcript levels of molecules downstream of PHBP that act in tissue fibrinolysis, Plau and Plat, 11,21 in the CICs at week 13 by LC treatment, while CE treatment did not show an effect. These results suggest that LC exerts the pharmacological action of laccaic acids in the CIC areas, while an effect of CE on PHBP-inhibition was not detected.
Although PHBP is a circulating serine protease produced predominantly in the liver and is considered to play a role in the regulation of coagulation and fibrinolysis, 23 this enzyme also expresses locally in endothelial cells and macrophages to play a role locally in inflammation and vascular remodeling processes. 24 In the present study, we also found PHBP expression in macrophages infiltrating into the fibrously-thickened thyroid capsule. Moreover, we, for the first time, found PHBP immunoreactivity in the thyroid proliferative lesions that showed increased intensity in accordance with lesion development from focal hyperplasias to carcinomas, suggesting PHBP activation for acquisition of the malignant phenotype. In humans, mRNA upregulation of PHBP has primarily been reported in lung adenocarcinomas. 25 A correlation of this upregulation with pathological stages was subsequently reported in non-small-cell lung cancers. 26 While some other tumors, such as squamous cell carcinomas of the head and neck, typically downregulated PHBP transcript levels, 27 these results imply that PHBP secreted from neoplastic cells also acts on tumor progression in some tumor types. Neoplastic follicular cells may also be the target of LC for inhibition of PHBP activation in addition to the surrounding macrophages.
The rat two-stage thyroid carcinogenesis model utilizes hypothyroidism as a tumor-promoting mechanism, in which decreases in the serum levels of T3 and T4 cause suppression of negative feedback through the pituitary and increases in circulating TSH. TSH then stimulates thyroid functions, including growth and proliferation of follicular cells. 28,29 In the present study, we found an approximately 30% reduction in the serum TSH level by LC treatment compared with SDM-alone at week 8 of SDM promotion. However, this level was still rather high and at least 13-fold than that in adult F344 rats without promoter treatment, ranging from 5 to 7 ng/mL. 30–32 Moreover, the TSH reduction was in contrast to the strong suppression of the formation of TN-C-positive foci as well as of capsular inflammation and fibrosis by LC treatment at this time point. Considering apparent induction of tumor-promoting activity even with a serum TSH concentration twice that of unpromoted animals, 31 the serum TSH concentration was rather high even after LC treatment to be sufficient for inducing strong tumor-promoting activity in the present study. Because serum T3 and T4 levels were unchanged in the SDM-alone group, LC may act on the pituitary directly or indirectly through an effect on the hypothalamus to suppress the serum TSH level.
Acquisition of resistance to the angiogenesis inhibitors targeting the signaling pathways of vascular endothelial growth factor is the typical outcome after long-term therapy in both preclinical and clinical settings. 33 In the present study, cell proliferation activity of CICs induced with 13-week SDM promotion estimated by the Ki-67-positive cell index was not altered by LC treatment. Compared with the profound suppressive effects of LC on capsular invasion of neoplastic cells at week 8, those observed at week 13 were weak, suggestive of resistance to LC by administration for longer periods. The magnitude of changes in gene expression of angiogenesis-related genes, such as Kdr and Vegfb, in CICs by LC treatment at 13 weeks was also mild. By SDM promotion, capsular inflammation, as with fibrogenic reaction, occurs during weeks 4–6, and then formation of CICs occurs from weeks 6–10. 34 Therefore, our study results indicate that LC effectively prevents the initial step in the formation of CICs. Effective suppression of VIFs in the thyroid capsule and adjacent parenchyma and lung metastasis by LC suggests concurrent occurrence of vascular invasion and subsequent lung metastasis with capsular invasion of neoplastic cells.
It is reported that approximately 80% of LC orally administered to F344 rats was directly excreted into feces without changing the ratio of laccaic acid isoforms, suggesting a low rate of LC absorption through oral administration. 35 However, information is lacking regarding the absorption and organ distribution of LC after oral administration. On the other hand, a subacute toxicity study of LC by dietary administration to rats for 13 or 78 weeks revealed dose-dependent induction of parotid gland hypertrophy and renal tubular mineralization in both sexes, 16,17 suggestive of the effects of LC after absorption. In the present study, apparent infiltration of macrophages and mast cells was observed in the medullary sinuses of the mesenteric lymph nodes in the LC-treated animals as well as in the CE-treated animals. This finding was similar to that of the 13-week toxicity study of water pepper extract by dietary administration to F344 rats, in which such lymph nodal changes was judged to be related to the biological potency of the active ingredient, polygodial, on the gastrointestinal environment involving immune functions. 36 In the present study, we observed efficient suppression of capsular inflammation as with transcript downregulation of inflammatory response-related Nfkb1 and Nos2 in the thyroid by LC for eight weeks, suggesting that LC administration may exert locally immunomodulatory functions, despite a low level of absorption being suggested with LC. 35 In the same CIC induction model, NOS2 immunoreactivity was reportedly detected in macrophages infiltrated into the capsule as well as in a subpopulation of CICs, and concurrent administration of an NOS2 inhibitor, aminoguanidine, with SDM reduced the number of CICs. 37 CE has been shown to act through both inhalation and digestion, giving rise to an allergological syndrome that can show itself clinically with expressions of both respiratory allergy and alimentary allergy in humans. 38
In conclusion, dietary administration of LC and CE exerted dissimilar responses against CIC-development. LC suppressed the initial step of capsular invasion of neoplastic follicular cells, while CE promoted angiogenesis of developed CICs at later stages. The effect of LC on CIC development may be through suppression of tissue proteolysis involving inflammatory responses and angiogenesis provoked by PHBP activation secreted from macrophages and neoplastic cells as an effect of laccaic acid(s). Laccaic acid may be effective for prevention of tumor groups expressing PHBP rather than for therapeutic use on such tumors. We recently examined the effect of intravenous injections of laccaic acid A or B (3 mg/g/kg body weight, 3 times a week) for eight weeks in the same rat two-stage thyroid carcinogenesis model as used here. As a result, we found a decrease or deceasing tendency in the multiplicity and total area of TN-C-positive early foci with both compounds, with laccaic acid B showing a statistically significant decrease in the total area of TN-C-positive foci (Sayaka Kemmochi and Makoto Shibutani, unpublished data). We also confirmed the tumor-promoting activity of CE by intraperitoneal injections of carminic acid-enriched CE (52% carminic acid in CE; 10 mg/kg body weight, every other day) for eight weeks in the same rat two-stage thyroid carcinogenesis model used here (Sayaka Kemmochi and Makoto Shibutani, unpublished data). We also found no fluctuations in serum concentrations of thyroid-related hormones in animals of these studies as compared with SDM-alone.
Footnotes
ACKNOWLEDGEMENTS
The authors thank Shigeko Suzuki for her technical assistance in preparing the histological specimens. MS, as the corresponding author, verifies that all individuals who have made contributions to this study are included either as authors or are acknowledged.