
Abstract
Chymase is an alternative pathway for angiotensin-converting enzyme in angiotensin II (Ang II) formation, and its expression is increased in human diabetic kidneys and in human mesangial cells (MCs) stimulated with high glucose. In addition, chymase activates transforming growth factor (TGF-β1) via an Ang II-independent pathway. The aim of this study was to evaluate the role of chymase on TGF-β1 activation in diabetic rats and in rat MCs (RMCs) stimulated with high glucose (HG). Diabetes was induced in male Wistar rats by streptozotocin (60 mg/kg, intravenous). After 30 (D30) or 60 (D60) days, chymase activity and the expression of profibrotic markers were evaluated. RMCs were stimulated with HG in the presence or absence of 50 μmol/L chymostatin, a chymase inhibitor, or 100 nmol/L of losartan, an Ang II antagonist. Chymase activity and expression increased in D60 kidneys, with increased expression of fibronectin, type I and III collagen, TGF-β1 and Smad 3 and with no change in Smad 7 expression. RMCs exposed to HG presented increases in chymase activity and expression, together with upregulation in fibrosis markers and in the TGF-β1 signaling pathway. All these effects were reversed by chymostatin and by losartan, but type 1 angiotensin II receptor blockade did not interfere with the Smad 3 and 7 pathway. Similar to HG-stimulated RMCs, control RMCs treated with chymase responded with increased expression of TGF-β1, Smad 3 and fibrosis markers. These effects were reversed by chymostatin but not by losartan. The results indicate an important role for chymase in inducing fibrosis through TGF-β1 activation, parallel with Ang II effects.
Introduction
Angiotensin I (Ang I) is converted to angiotensin II (Ang II) by the angiotensin-converting enzyme (ACE); however, in some tissues, including heart muscle and blood vessels, this conversion can also be mediated by chymase, a chymotrypsin-like serine protease. 1,2 Ang II formation in the kidneys is mainly ACE-dependent; however, chymase is also expressed in normal human kidneys. Huang et al. 3 found that chymase expression was faintly labeled in the glomeruli and vascular smooth muscle cells of normal human kidneys, whereas it was markedly upregulated in kidneys from diabetic patients. Indeed, Cristovam et al. 4 recently showed that mesangial cells (MCs) in culture expressed chymase mRNA, and that its expression was increased by high glucose (HG) stimulus.
In addition to Ang II formation, chymase undertakes additional actions independent of Ang II, including extracellular matrix degradation, 5–7 promoting the breaking of ‘big’ endothelin to the active form of endothelin 1–31 8 and activation of transforming growth factor-β1 (TGF-β1). 9 These chymase effects have raised many questions about the involvement of this enzyme in pathophysiological mechanisms involving inflammation and fibrosis, with particular attention given to TGF-β1, which is an important mediator of tissue fibrosis, characteristic of chronic renal diseases, including diabetic nephropathy (DN). 10
The relationship between chymase and TGF-β1 activation was initially suggested by Zhao et al. 11 in 2008. These authors demonstrated that chymase promotes cell proliferation and collagen synthesis and increases cardiac fibroblasts by mechanisms dependent on TGF-β1 and independent of Ang II. 11
In contrast with humans and hamster, in rats, chymase is not a relevant enzyme in Ang II synthesis because these animals express the β-chymase isoform that inactivates Ang II, 12 counterbalancing the α-chymase effect. Therefore, the present study used rats to investigate the direct effects of chymase, independent of Ang II, on TGF-β1 activation and fibrosis induction, in a model of DN induced by streptozotocin (STZ).
Methods
Male Wistar rats weighing 200–250 g were made diabetic by a tail injection of 60 mg/kg of STZ (Sigma-Aldrich Co., St Louis, MO, USA), dissolved in sodium citrate buffer, pH 4.5. Control rats (CT, n = 5) received citrate buffer alone. Two days later, plasma glucose concentrations were determined in tail blood samples (Accu-chek; Boehringer Mannheim, Indianapolis, IN, USA), and only those STZ-treated animals with blood glucose levels >200 mg/dL were included in the experimental protocol. The animals were allowed free access to standard rat chow and tap water. The experimental protocol was approved by the Ethical Committee of the Federal University of São Paulo under number 0004/08.
The animals were sacrificed at 30 d (D30, n = 5) or 60 d (D60, n = 7) after diabetes induction. Tail arterial pressure was evaluated by a cuff (Manual tail electro-sphygmomanometer, PE-300; Narco Biosystems, Inc., Houston, TX, USA) at day 0 and day 30 or 60, when the animals were placed in metabolic cages for 24-h urine collection. At the end of the protocol, the animals were anesthetized with ketamine and xylazine, and aorta blood samples were collected. Biochemical parameters were determined in plasma and urine. Both the right and left kidneys were excised for mRNA and protein quantification, enzymatic activity and histology analysis.
Toluidine-blue staining for mast cells
Carnoy-fixed, paraffin-embedded kidney tissue sections were stained with 0.2% toluidine-blue solution (T3260; Sigma-Aldrich) in 0.5 mol/L HCl and afterwards washed and dehydrated with ethanol and xylol. The presence of mast cells in renal tissue was evident due to the heparin in the cytoplasmic granules of the mast cells blushing blue. 13
Rat mesangial cell culture and experimental conditions
Immortalized rat mesangial cells (RMCs) obtained from American Type Culture Collection (Chicago, IL, USA) were cultured in Dulbecco's modified Eagle's medium (DMEM) containing 10% fetal bovine serum, 25 mmol/L glucose and antibiotics (50 U/mL penicillin and 50 mg/L streptomycin). Culture flasks were stored in a humidified environment at 37°C in an atmosphere of 95% O2 and 5% CO2. The medium was replaced every 36 h. At semiconfluence, the cells were rinsed twice with phosphate-buffered saline, tripsinized and divided in two groups, which were cultured in DMEM containing a normal glucose (NG) concentration of 25 mmol/L or a HG concentration of 55 mmol/L for 48 h. To evaluate the role of chymase in TGF-β1 activation, RMCs cultured under NG or HG conditions were studied under the pharmacological inhibition of chymase by a chymase inhibitor (Ci), chymostatin.
14
The following groups of cells were studied: NG (DMEM containing 25 mmol/L
mRNA expression levels
The mRNA expression levels of TGF-β1, chymase, fibronectin, collagen I and III, and Smad 3 and 7 were estimated in renal tissue and RMCs by quantitative realtime polymerase chain reaction (PCR). Total RNA was purified using the phenol and guanidine isothiocyanate cesium chloride method (TRIzol kit; Life Technologies, Carlsbad, CA, USA). RNA pellets were re-suspended in RNase-free water. Two micrograms of total RNA were pretreated with DNase and then reverse-transcribed into cDNA by the addition of a mix containing 0.5 mg/mL oligo-dT, 10 mmol/L dithiothreitol, 0.5 mmol/L dNTPs (Pharmacia Biotech, Pittsburgh, PA, USA) and 200 U of reverse transcriptase (Superscript RT; Life Technologies). The mixture was incubated at 37°C for one hour and then at 95°C for five minutes. Primer sequences for the amplification of the molecules were based on cDNA sequences obtained from Gen Bank and were designed using the Designer PCR program (Research Genetics, Huntsville, AL, USA). Primer sequences (from 3′ to 5′ end) were the following: chymase (cgg tct ata acg gtc ctc cta gg and aca tct gct gga agg tgg ac); fibronectin (tcc cca ttt ttg aag att ttg tg and aat gag agt gat aac gct gat gtc a); collagen I (tgg cca aga aga cat ccc tga agt and aca tca ggt ttc cac gtc tca cca); collagen III (atc caa tgg att tca aga tca aca and atc caa tgg att tca aga tca aca); Smad 3 (agg aat ttg ctg ccc tcc tag and gcc ttt gac gaa gct cat gc); Smad 7 (cac gaa gct aat ctg cac ggt and cct ggt ttc tcc atc aag gc); and TGF-β1 (tca gtc cca aac gtc gag gt and gct gtg cag gtg ttg agc c). For each PCR set, negative controls (for contamination from exogenous sources) were performed by replacing cDNA with water. Realtime reverse transcriptase-PCR (RT-PCR) was performed using the Gene Amp 5700 and ABI Prism 7700 Sequence Detection Systems (Applied Biosystems, Foster City, CA, USA). Realtime PCR product accumulation was monitored using intercalating dye SYBR Green I (Molecular Probes, Carlsbad, CA, USA). Fluorescence for each cycle was quantitatively analyzed using the ABI Prism 7700 Sequence Detection System (Applied Biosystems). At the end of PCR amplification, the temperature was increased from 60 to 95°C at a rate of 2°C/min. Fluorescence was measured every 15 s to construct the melting curve used to verify the absence of non-specific amplification products. The results were normalized to β-actin amplification (cctctatgccaacacagtgc and acatctgctggaaggtggac), and the relative gene expression of each molecule was calculated by considering the control group as the standard and was expressed in arbitrary units.
Chymase enzymatic activity assay
Chymase activity was determined in kidney tissue and in RMCs. Kidney tissue was macerated and homogenized in Tris-HCl 0.1 mol/L, pH 7.0, and kept on ice. The cells in culture were collected in the same buffer and subsequently sonicated for five minutes. Tissue homogenate and cell lysate were centrifuged at 12,000 rpm for five minutes; then, the precipitate was discarded and the supernatant frozen for analysis. The proteolytic activity of chymase was monitored continuously in a spectrofluorimeter Hitachi F-2000 (Tokyo, Japan) using 10 μmol/L of the fluorogenic substrate Abz-Ala-Ile-Lys-Phe-Phe-Ser-Ala-Gln-EDDnp (Abz = ortho-amino benzoic acid; EDDnp = 2,4-dinitrophenyl ethylenediamine). 15,16 The assays were performed in 0.1 mol/L Tris-HCl buffer, pH 7.0. The cuvette containing the samples, buffer and the substrate was placed in a thermostatically controlled cell compartment maintained at 37°C. The amount of Abz released after the hydrolysis of the substrate was measuared at λ ex = 320 nm and λ em = 420 nm. The same procedure was performed in the presence of 100 μmol/L of the Ci chymostatin. The fluorescence values were converted to μmol/L/min using a calibration curve determined by total hydrolysis of the peptide. The errors were less than 5% for any obtained value. The enzyme activity was defined as the amount of substrate cleaved by chymostatin and corrected by protein concentration of each sample. The protein concentration was measured by the Lowry method, 17 using an appropriate kit (Bio-Rad DC Protein Assay, Hercules, CA, USA). The fluorogenic substrate was kindly provided by Dr Luiz Juliano and Dr Maria A Juliano from the Department of Biophysics, Federal University of São Paulo.
Western blot analysis for chymase and TGF-β1
Kidney fragments were homogenized (homogenizer, Polytron; Kinematica AG, Lucerne, Switzerland), and RMCs were lysed in ice-cold purification buffer (50 mmol/L Tris, pH 8.0; 150 mmol/L NaCl; 1% Nonidet P-40; 0.5% sodium deoxycholate; 0.1% sodium dodecyl sulfate; 2.5 mmol/L ethylenediaminetetraacetic acid; 1 mmol/L phenylmethylsulfonyl fluoride; 44 mmol/L o-phenanthroline). The samples were centrifuged, and the protein concentration was determined by the Folin method with reagents from Bio-Rad (Bio-Rad DC Protein Assay). Fifty micrograms of protein were separated on a 10% sodium dodecyl sulfate polyacrylamide gel and transferred to a nitrocellulose membrane (Amersham Pharmacia Biotech, Piscataway, NJ, USA) at 4°C using a transfer buffer containing 25 mmol/L Tris-HCl, 192 mmol/L glycine and 20% methanol. Non-specific binding was blocked with 5% non-fat dry milk in Tris-buffered saline buffer containing 10 mmol/L Tris-HCl (pH 7.5) and 200 mmol/L NaCl. Immunoblots were then incubated overnight at 4°C with monoclonal antibodies against chymase (Abcam, Cambridge, UK), TGF-β1 and β-actin (Sigma-Aldrich). Membranes were incubated for 1 h at 4°C with anti-mouse peroxidase-conjugated secondary antibody (Sigma Aldrich). Detection of specific protein bands was accomplished with a Luminol detection system (Immobilon Western, Chemiluminescence HRP substrate; Millipore Corporation, Billerica, MA, USA). Then, each membrane was transferred to a photodocumentation system, the Luminescent Image Analyser (LAS 4000; Fuji, Tokyo, Japan). Densitometric analysis of the bands was performed using Image Gauge software, version 3.1 (Fuji), based on the optical density of the bands. The results were normalized by β-actin expression, which was used as a positive endogenous control and expressed as a percentage of the control groups.
Statistical analysis
Results are expressed as the means ± SEs. Data were analyzed by one-way analysis of variance and subsequently by the Tukey's test. An unpaired Student's t-test was used when appropriate. P < 0.05 was considered statistically significant.
Results
In vivo studies
Physiological parameters
Blood glucose, tail arterial pressure (TAP), body weight, diuresis, urine pH, proteinuria, plasma creatinine and creatinine clearance in the control (n = 5), D30 (n = 4) and D60 (n = 7) groups. Mean ± SE; P < 0.05: *versus day 0; #versus Control
Chymase activity measured in the whole kidney was significantly increased in both diabetic groups, compared with the control group (Table 2). The chymase mRNA expression level was significantly increased in the D60 group (Figure 1a), and chymase protein was significantly increased in both diabetic groups but mainly in the D60 group (Figure 1b). Despite this upregulation in chymase expression and activity, there was no significant infiltration of mast cells in the renal tissue in any group evaluated (data not shown).
Chymase mRNA and protein expression levels. (a) The mRNA levels were measured by semiquantitative realtime reverse transcriptase-polymerase chain reaction. (b) Immunoblot of tissue homogenates probed with anti-chymase or anti-β-actin antibodies. Bands were quantified by densitometry, and chymase expression was normalized by β-actin expression. P < 0.05: *versus control group (CT); #versus D30 group Chymase catalytic activity in kidney CT, control group; Ci, chymase inhibitor Chymase activity was determined in kidney tissue homogenates of the three groups (CT, D30 and D60). Chymase activity was measured by a fluorimetric method, using Abz-Ala-Ile-Lys-Phe-Phe-Ser-Ala-Gln-EDDnp as a substrate. Results represent the mean of five samples from each group. Mean ± SE; P < 0.05: *versus CT
There was a significant increase in TGF-β1 expression in both diabetic groups when compared with the control group (Figure 2a). As a result of TGF-β1 activation, we observed an increase in Smad 3 expression; however, no change was observed in Smad 7 expression (Figure 2b).
Immunoblotting for transforming growth factor (TGF-β1) in kidney tissue. (a) Bands were quantified by densitometry, and TGF-β1 expression was normalized by β-actin expression. (b) Smad 3 and 7 mRNA expression levels in kidney. The mRNA levels were measured by semiquantitative realtime reverse transcriptase-polymerase chain reaction. P < 0.05: *versus control group (CT); #versus D30 group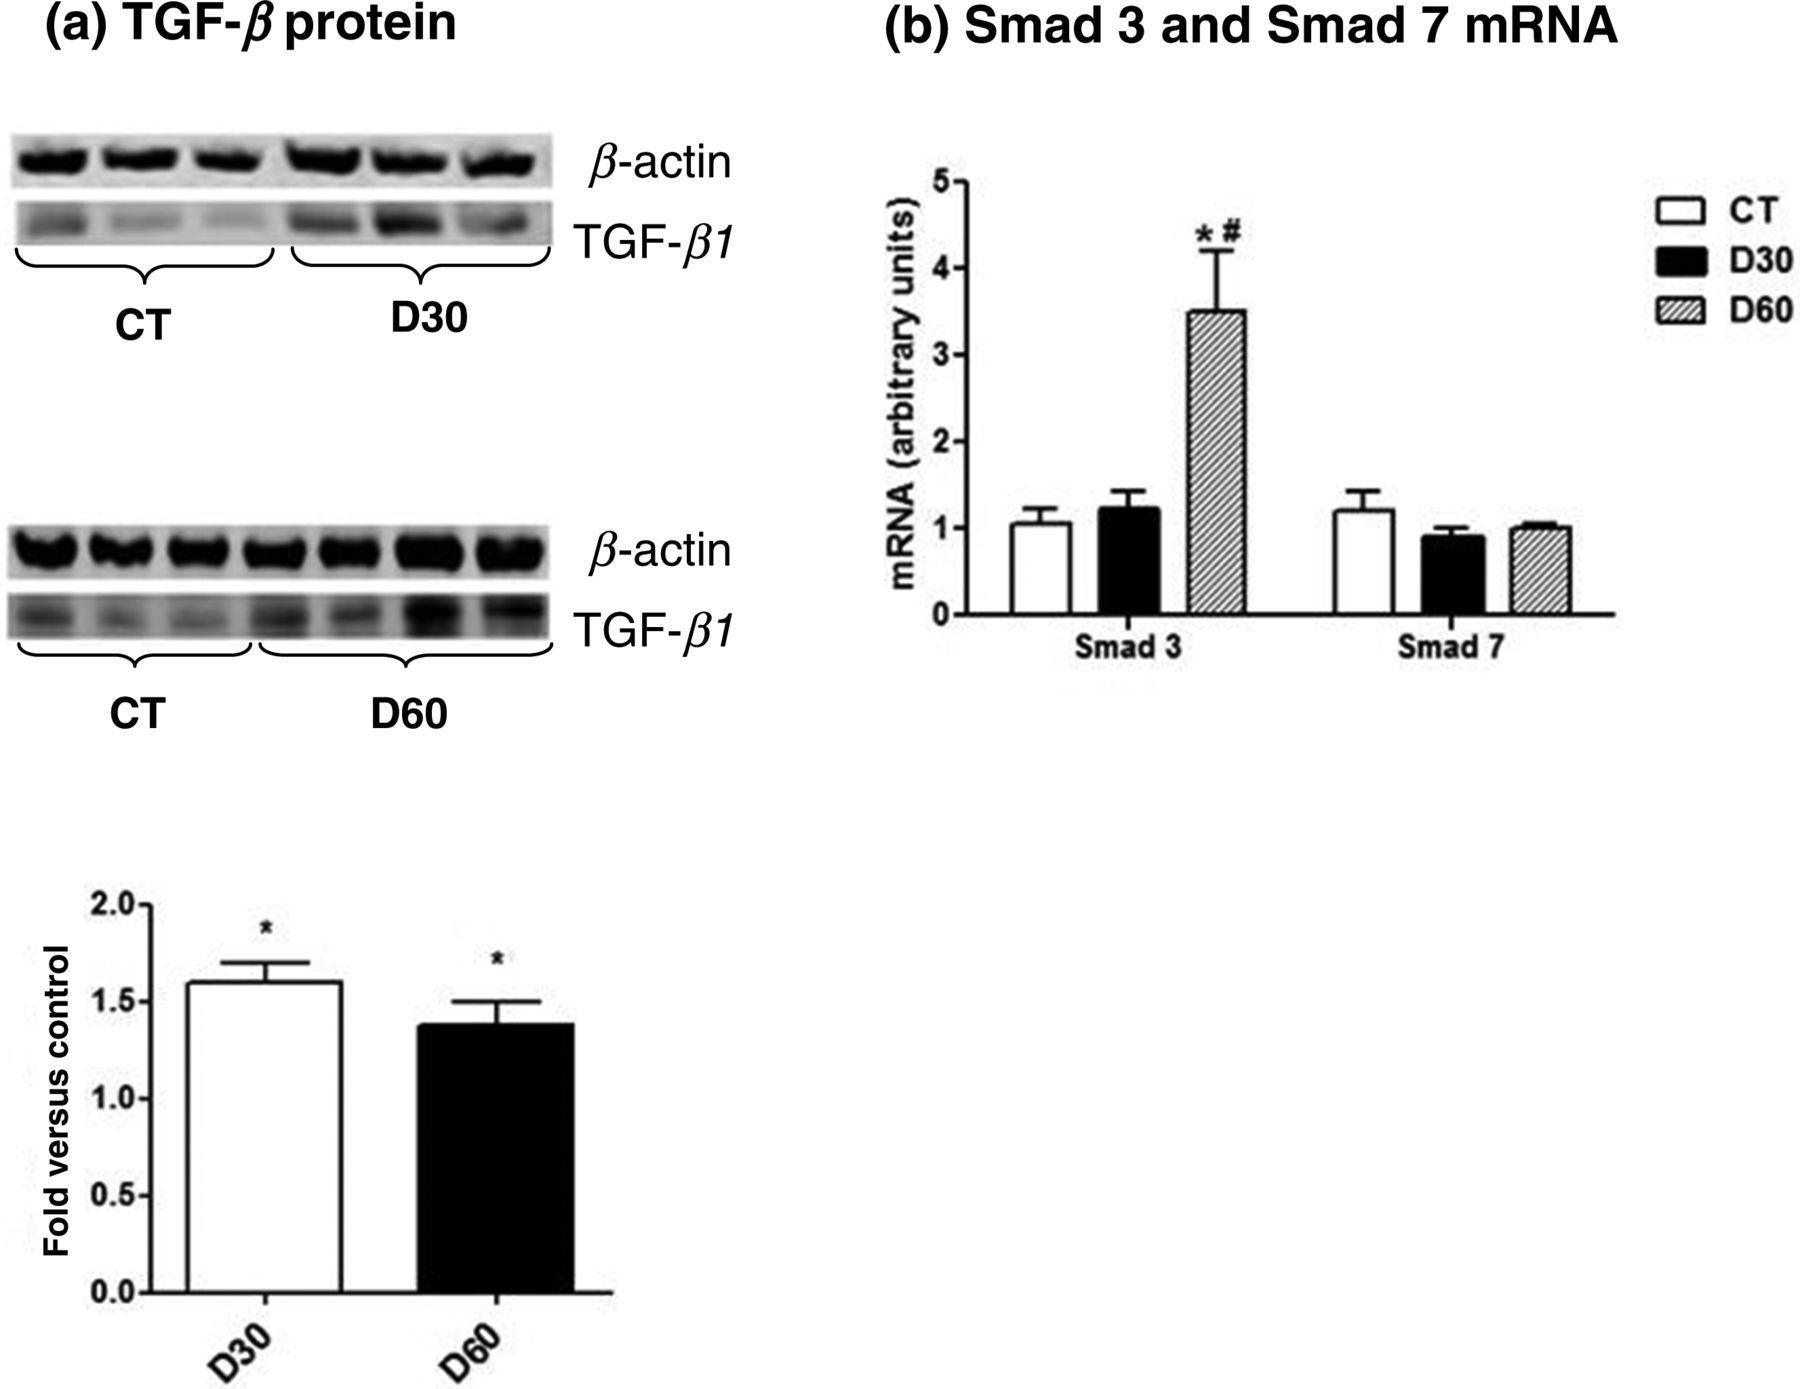
The expressions of fibronectin and collagen I and III were not altered in kidneys from the D30 group, but they were significantly elevated in the D60 group, when compared with the control group (Figure 3).
Expression levels of fibronectin and collagen I and III in kidney tissue. mRNA levels were measured by semiquantitative realtime reverse transcriptase-polymerase chain reaction. P < 0.05: *versus control group (CT); #versus D30 group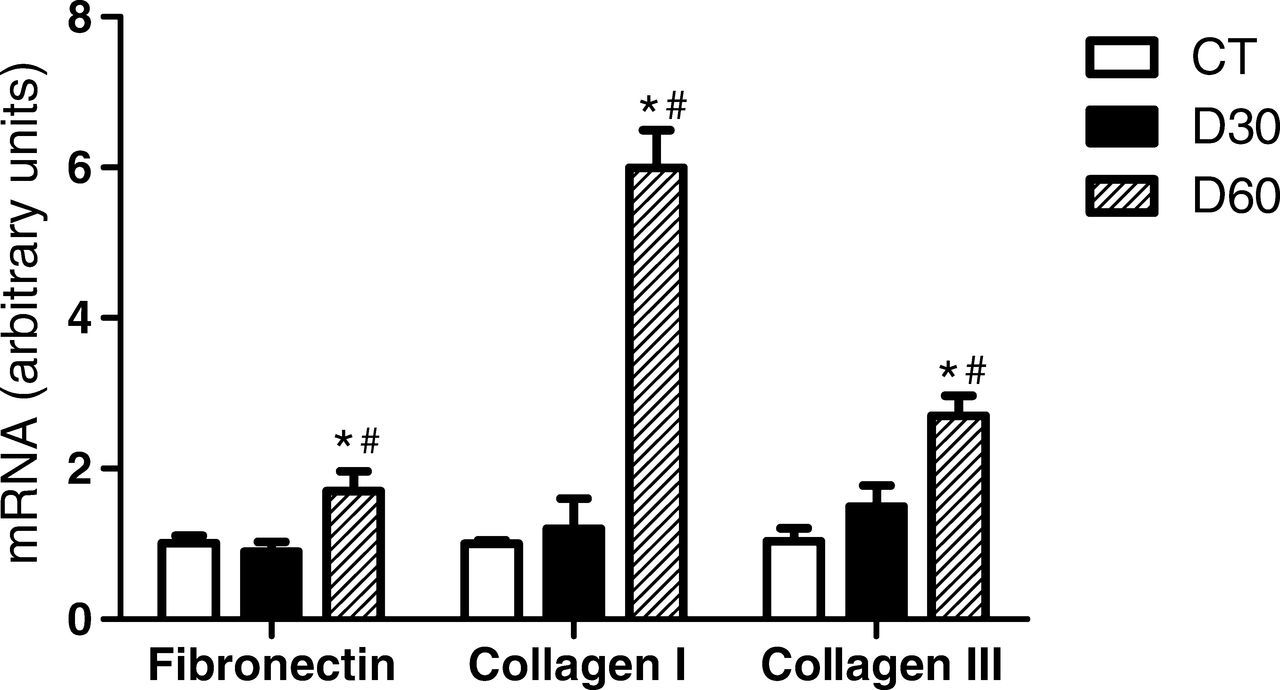
In vitro studies
Chymase activity
Chymase catalytic activity in rat mesangial cells
Ci, chymase inhibitor; HG, high glucose; CT, control group. Effects of glucose and incubation time on chymase activity. Enzyme activity was determined in the cell lysates by a fluorimetric method using Abz-Ala-Ile-Lys-Phe-Phe-Ser-Ala-Gln-EDDnp as a substrate. Results represent the mean of five samples from each group. Mean ± SE; P < 0.05: *versus CT
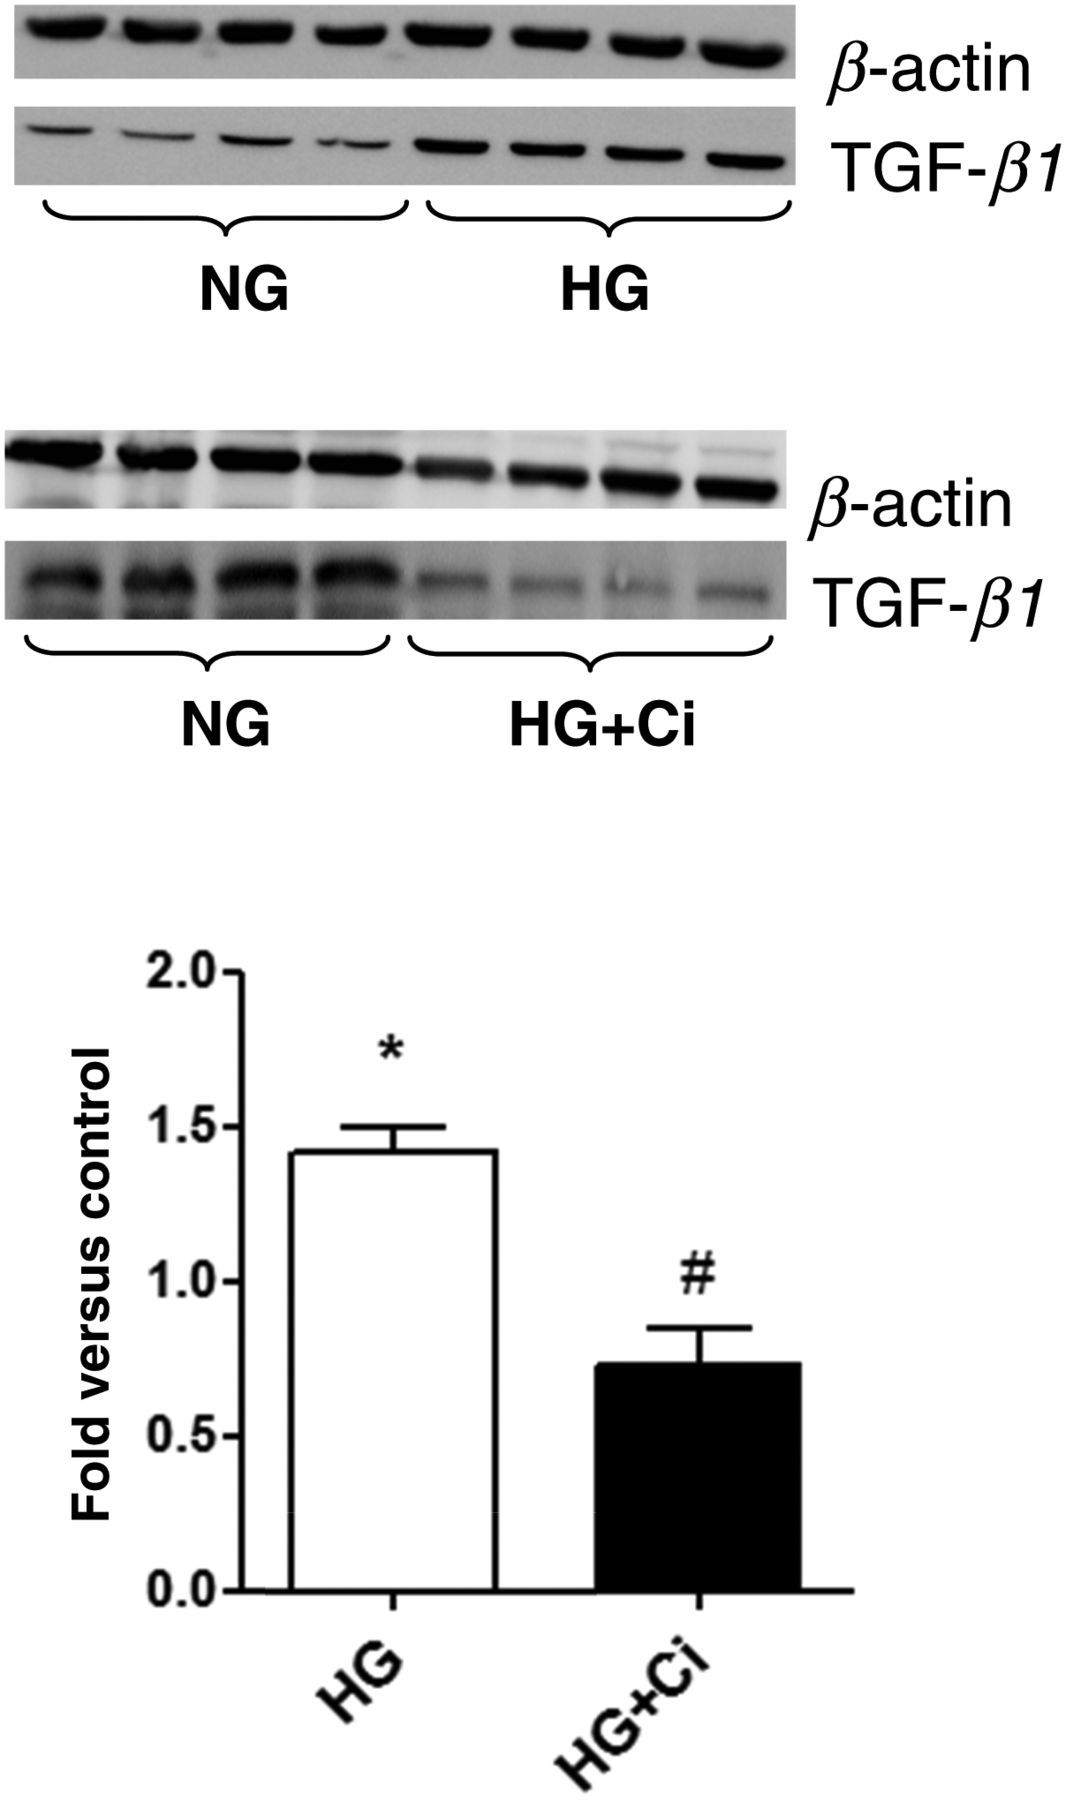
HG caused an increase in chymase mRNA expression (Figure 4a) that was not reversed by the Ci chymostatin; however, the Ci significantly decreased HG-induced increases in chymase protein levels (Figure 4b). HG induced significant increases in TGF-β1 expression levels, compared with the control group, which were completely reversed by the Ci (Figure 5).
Chymase mRNA and protein expressions were evaluated under normal glucose (NG) or high glucose (HG) concentration. Cells were exposed to HG for 48 h in the presence or absence of a chymase inhibitor (Ci, 50 μmol/L). (a) The mRNA levels were measured by semiquantitative realtime reverse transcriptase-polymerase chain reaction. (b) Immunoblots of rat mesangial cell homogenates were probed with antichymase or anti-β-actin antibodies. Bands were quantified by densitometry, and chymase expression was normalized by β-actin Immunoblotting for transforming growth factor (TGF-β1) in rat mesangial cells incubated with high glucose (HG) in the presence or absence of a chymase inhibitor (Ci, 50 μmol/L). Bands were quantified by densitometry, and TGF-β1 expression was normalized by β-actin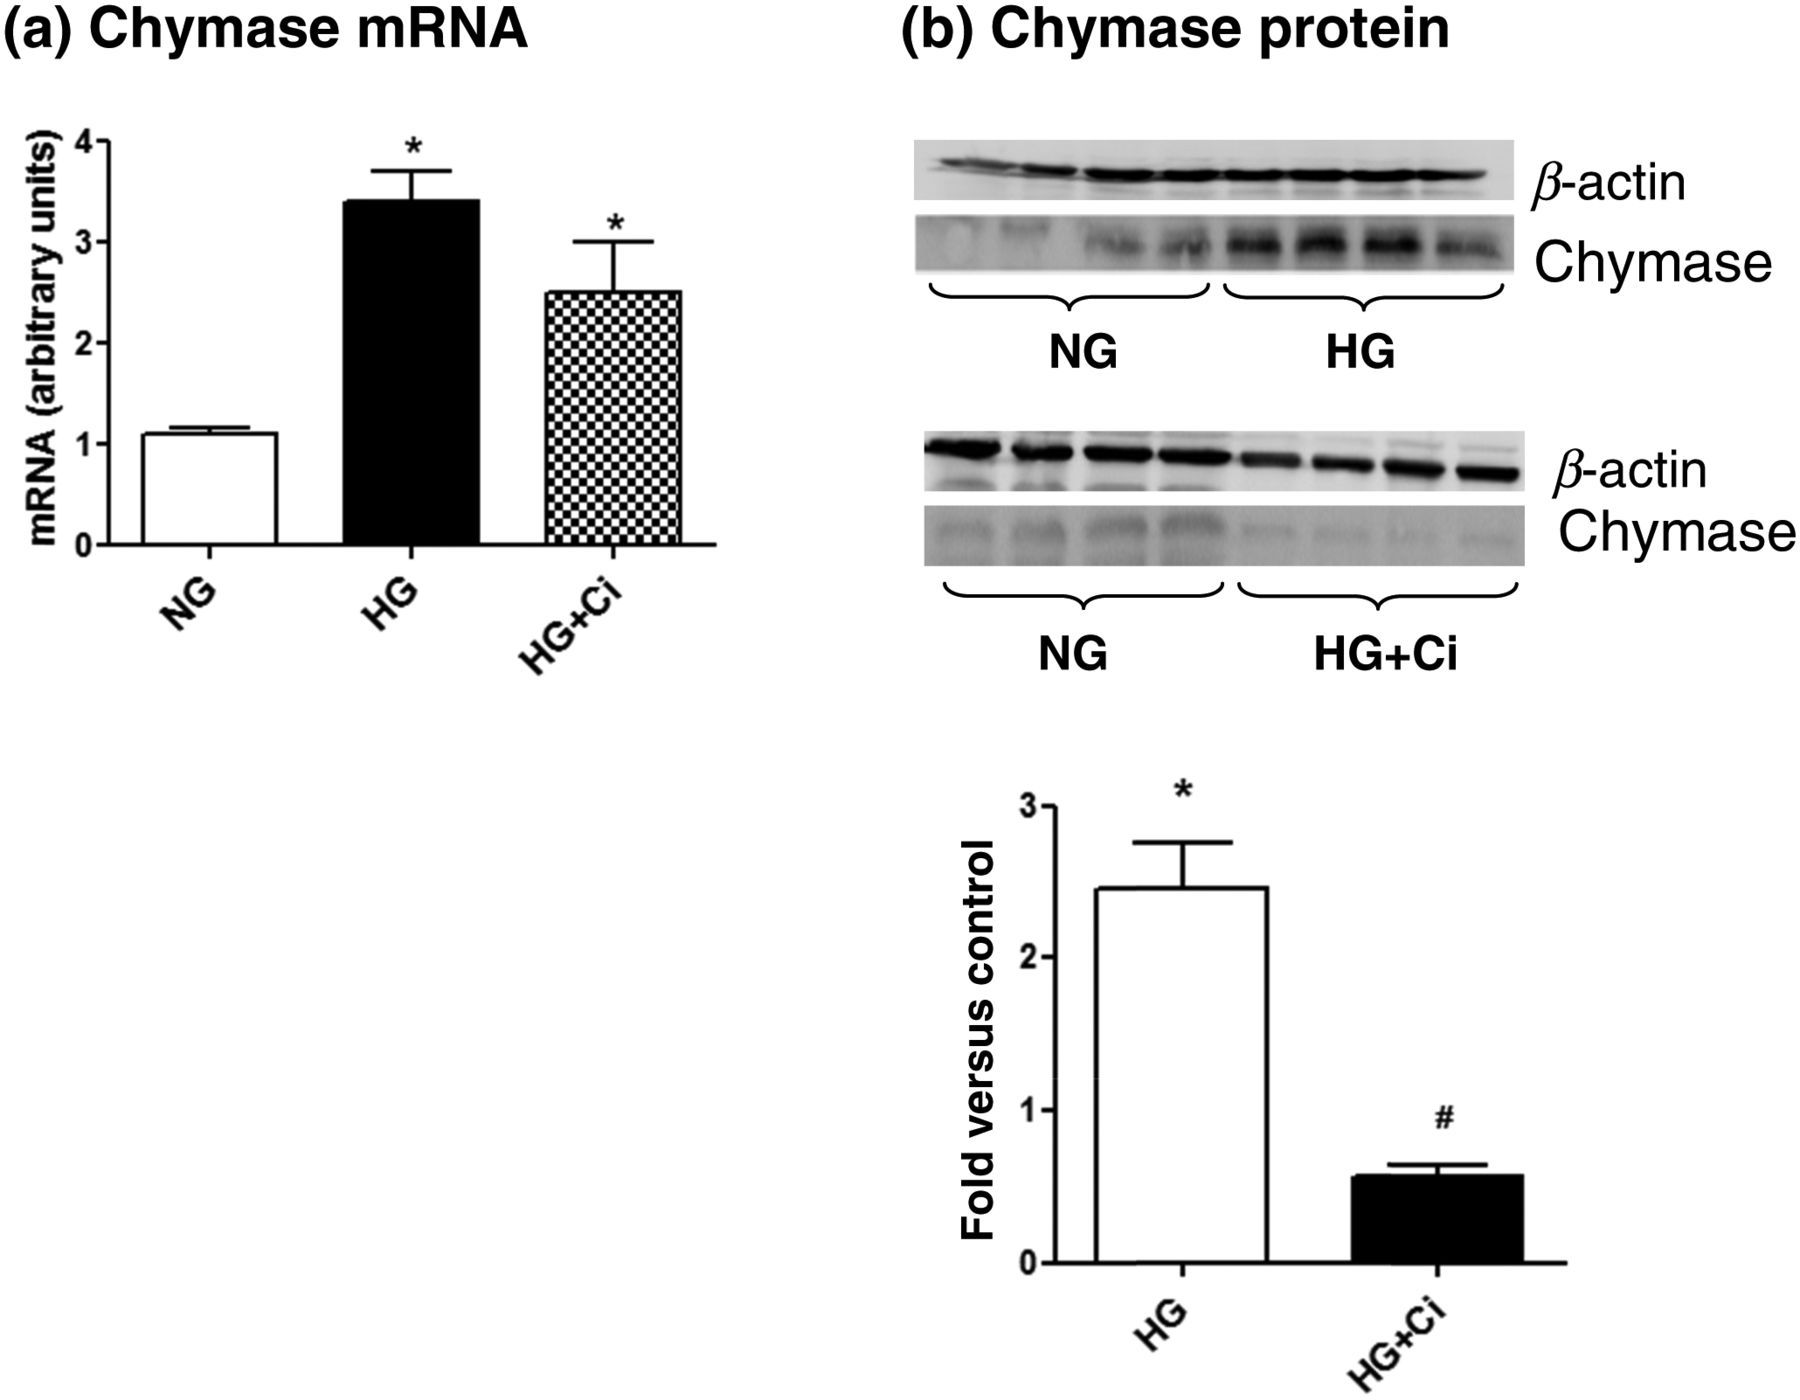
To compare the chymase and Ang II effects, the RMCs were incubated with losartan or chymostatin. HG induced a significant increase in fibronectin and type III collagen expression levels, and this effect was completely reversed by chymostatin and by losartan (Figure 6). Similar to the whole kidney, HG induced an increase in Smad 3 and a reduction in Smad 7 mRNA expressions. These changes were reversed by chymostatin but not by the type 1 angiotensin II receptor blocker losartan (Figure 6).
Fibronectin, collagen I and III, and Smad 3 and 7 expression levels in rat mesangial cells stimulated with high glucose (HG; 55 mmol/L) in the presence or absence of a chymase inhibitor (Ci, 50 μmol/L) and an Ang II receptor blocker (losartan, 100 nmol/L). P < 0.05: *versus normal glucose (NG); #versus HG group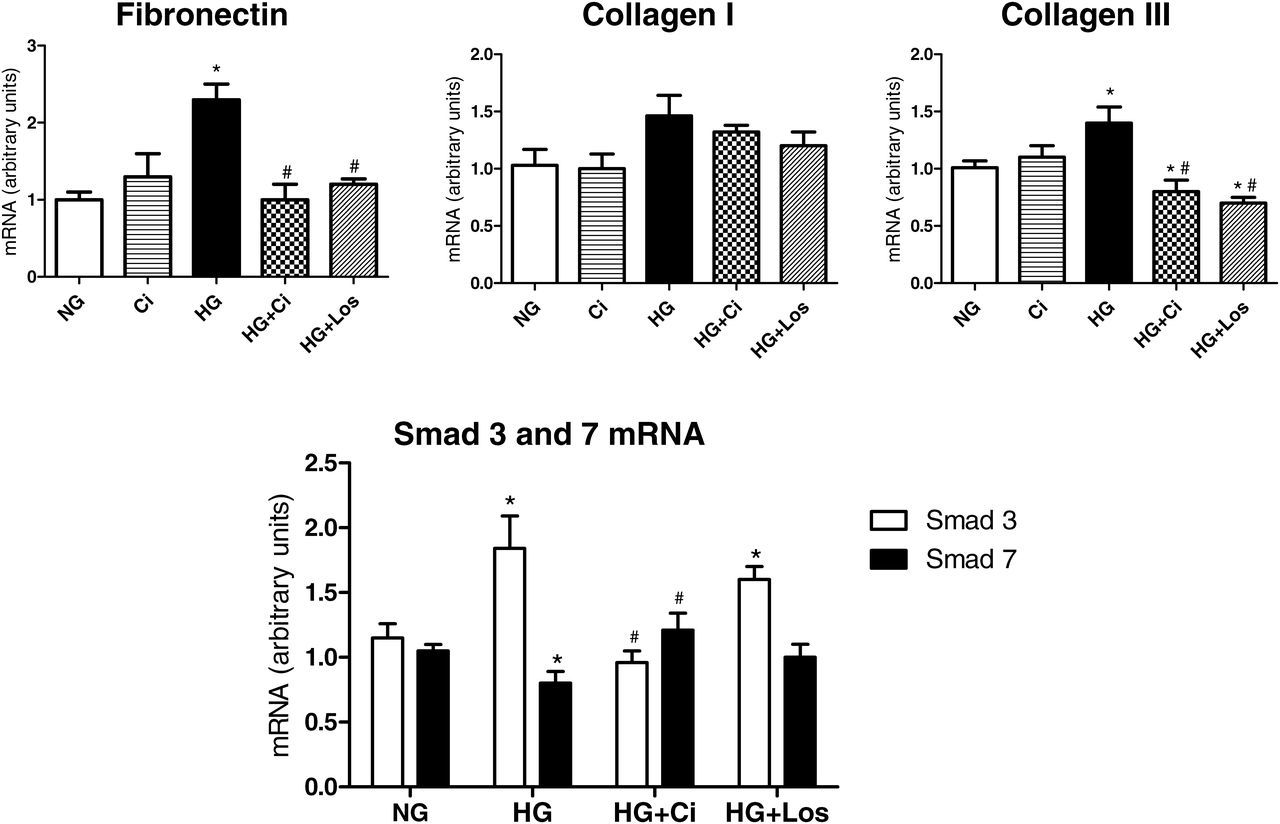
To confirm that chymase was, at least in part, responsible for the effects caused by HG, we stimulated the control RMCs with 30 ng/mL of chymase, which induced changes in gene expression similar to those produced by HG. The results in Figure 7 show that chymase induced increases in TGF-β1, Smad 3 and fibrosis markers, and as expected, all these effects were reversed by chymostatin but not by losartan.
Immunoblotting for transforming growth factor (TGF-β1) in rat mesangial cells stimulated with chymase (Ch), in the presence or absence of chymostatin (chymase inhibitor, Ci) (50 μmol/L). Bands were quantified by densitometry, and TGF-β1 expression was normalized by β-actin expression. TGF-β1, Smad 3, fibronectin and collagen I and III mRNA expression levels in rat mesangial cells stimulated with chymase, in the presence or absence of chymostatin (50 μmol/L) and losartan (Los, 100 nmol/L). The mRNA levels were measured by semiquantitative realtime reverse transcriptase-polymerase chain reaction. P < 0.05: *versus control group (CT); #versus Ch group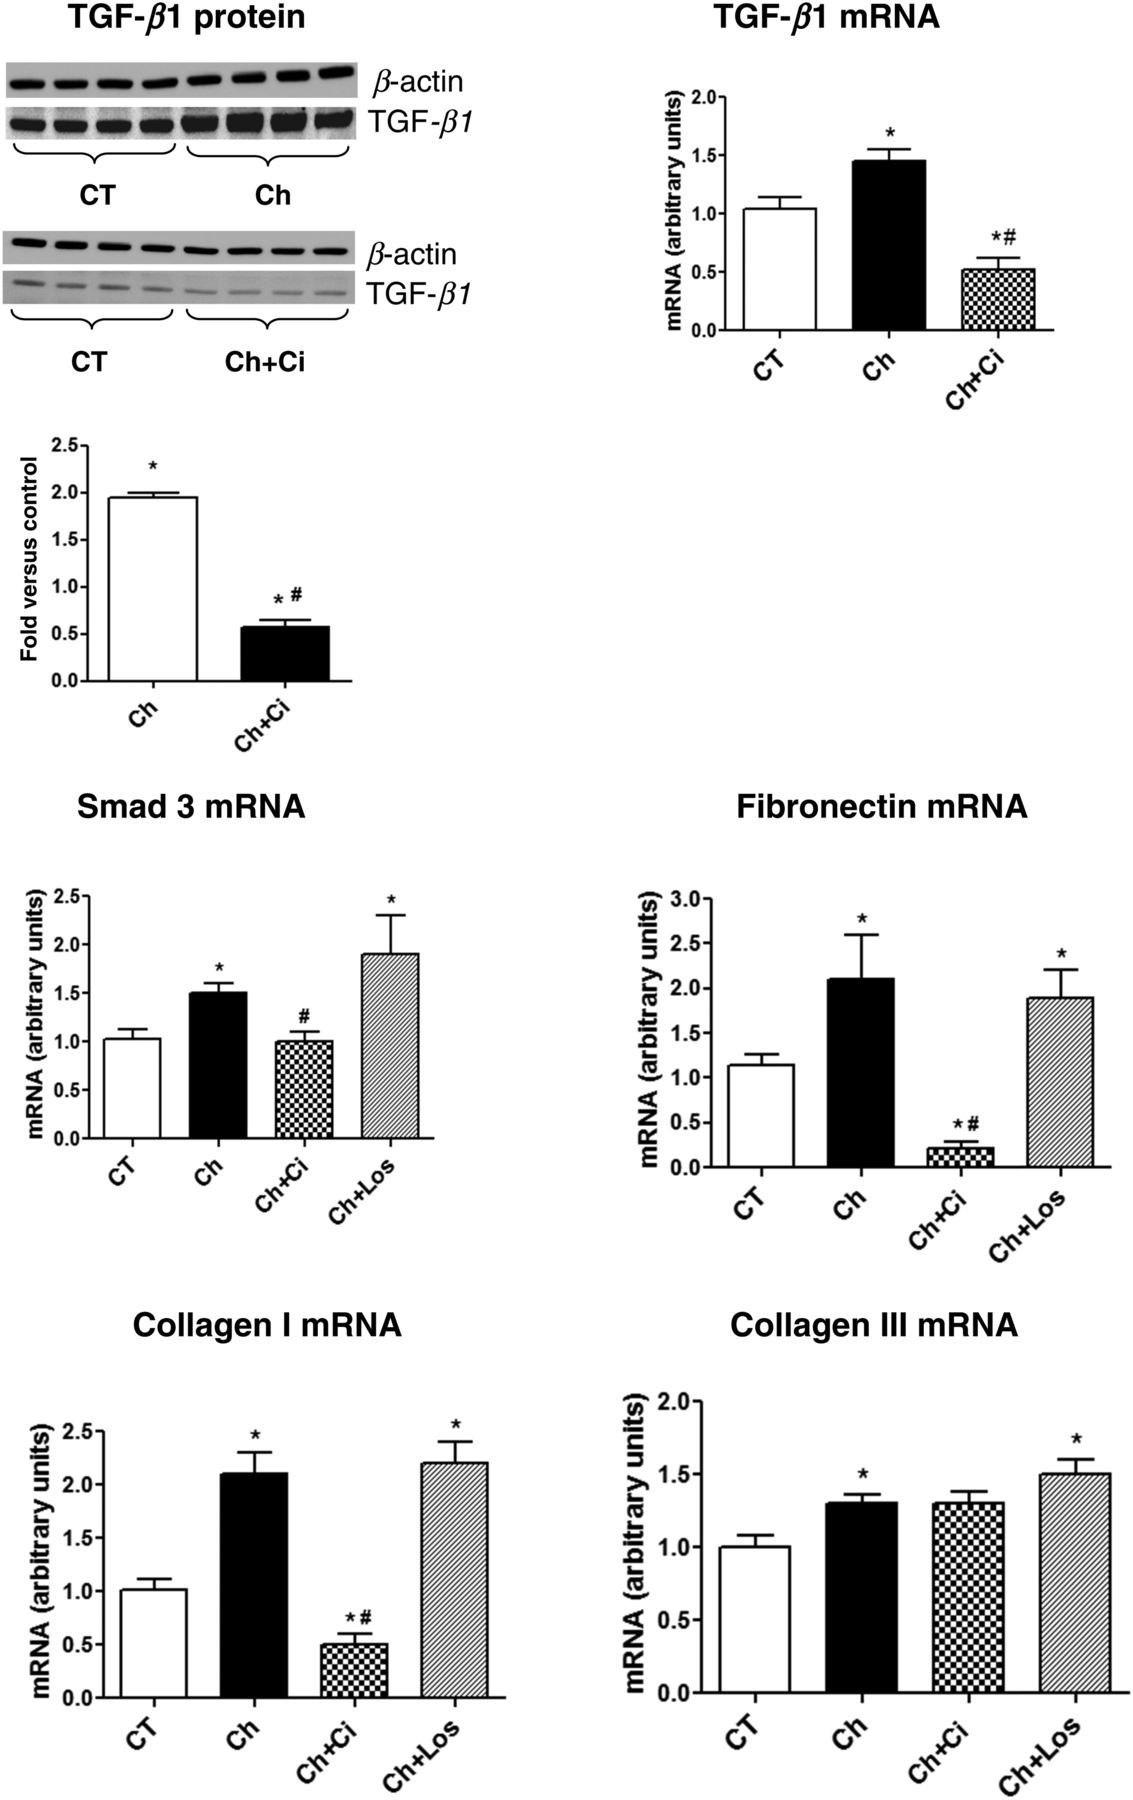
Discussion
This study evaluated the role of chymase in TGF-β1 activation and induction of fibrosis markers in a model of diabetic nephropathy. In recent years, more attention has been given to this serine protease because of its ability to hydrolyze the latent form of TGF-β1, resulting in the release of the active form of this profibrotic molecule. 18 As the chymase pathway is not relevant to form Ang II in rats, these animals were suitable for assessing whether chymase would participate as a profibrotic factor mediated by TGF-β1 in an Ang II-independent pathway.
Diabetic animals presented characteristics consistent with those described in the literature, including persistent hyperglycemia, body weight loss, elevation in systolic blood pressure and proteinuria. Chymase expression and activity were increased in diabetic kidneys. Mast cells are the main source of chymase; however, these cells were absent in both control and diabetic kidneys, suggesting that chymase was synthesized by resident renal cells. Indeed, we previously demonstrated that MCs in culture expressed chymase mRNA whose levels were upregulated in glucose-stimulated cells, 4 suggesting that these cells may be a potential source of chymase in diabetic kidneys.
It has been demonstrated that TGF-β1 activation can be accomplished via chymase due to its ability to release TGF-β1 from the extracellular matrix through specific proteolytic cleavage of the latent TGF-β binding protein, 19,20 resulting in TGF-β1/Smad axis activation. 11 In fact, we found an overexpression of TGF-β1 and its signaling pathway in diabetic kidneys, with an increase in Smad 3 expression, with no change in Smad 7. Smad 7 is able to inhibit the formation of Smad 3 and Smad 4 complexes, thereby preventing TGF-β1 effects, and thus these results provide evidence for the activation of the TGF-β1 downstream signaling pathway in this model.
Activation of TGF-β1 by chymase has been observed in cardiovascular injury 21–23 and lung 24 and kidney inflammation. 25 The results of this study point to the involvement of chymase in TGF-β1/Smad in diabetic kidneys as well; however, this hypothesis would have to be proved with the use of specific chymase inhibitors. Unfortunately, such drugs are not commercially available, at this time, for in vivo use. Thus, we employed an in vitro model, using RMCs stimulated with glucose, to prove the chymase involvement in TGF-β1 activation. The choice of RMCs was based on the central role of these cells in the pathogenesis of diabetic glomerulosclerosis and their ability to produce chymase. 4 The exposure of cells to a HG environment resulted in increases in both chymase activity and expression, and chymostatin significantly decreased chymase protein levels but not chymase mRNA, suggesting that chymase inhibition does not induce a feedback response that increases gene transcription.
HG induced a significant increase in TGF-β1 expression, together with its main downstream signaling molecule, Smad 3, resulting in an increase in fibrosis markers as observed in vivo. All these effects were completely reversed by chymostatin, indicating an involvement of chymase in the fibrosis mechanism via TGF-β1 activation in MCs in vitro. Chymostatin is a non-selective Ci and thus the involvement of other converting enzymes, such as cathepsin D, could contribute to the TGF-β1 activation. However this hypothesis is unlike since the aspartyl proteases, such as cathepsin D, are activated in vitro only in lower pH values, whereas chymase, a serine protease, is activated in pH 7.0, which was used in our in vitro experiments. In addition, it was previously demonstrated that the HG environment caused a reduction in cathepsin B and D expressions. 26 Finally, the important increase in the renal chymase gene expression and activity observed in the present study, in vivo and in vitro, points to a relevant role of chymase in TGF-β1 activation in this DN model.
It is well established that Ang II is primarily involved in MCs' responses to HG, 27,28 and thus chymase-mediated RMC activation would be an additional pathway contributing to diabetic glomerulosclerosis. To discriminate the contribution of Ang II- and chymase-mediated increases in TGF-β1 activation, stimulated RMCs were treated with chymostatin or losartan. Both were efficient to reduce the fibrosis markers; however, by different pathways. Chymostatin completely reversed the Smad 3 upregulation and Smad 7 downregulation induced by glucose whereas losartan did not affect this pathway. These results suggest that chymase participates in TGF-β1 activation, resulting in a signaling pathway involving Smad 3 and 7, and this effect was Ang II-independent and may contribute, together with Ang II, in the pathophysiology of the diabetic renal fibrosis.
Results from this study indicate that chymase, paralleled with Ang II, induces fibrosis through the TGF-β1/Smad3 axis, contributing to diabetic nephropathy. Although the role of chymase as a fibrogenic factor in humans has been attributed to its ability to generate Ang II, the direct role of this enzyme in TGF-β1 activation in human DN needs to be investigated.
Footnotes
ACKNOWLEDGEMENTS
This work was supported by grants from Fundação de Amparo a Pesquisa do Estado de São Paulo (FAPESP), Conselho Nacional de Desenvolvimento Científico e Tecnológico (CNPq), Fundação Oswaldo Ramos (FOR) and Fundo de Auxílio aos Docentes e Alunos (FADA).