
Abstract
The focus of this study was to identify changes in protein expression within the bone tissue environment between osteopenic and control bone tissue of human femoral neck patients with osteoarthritis. Femoral necks were compared from osteopenic patients and age-matched controls. A new method of bone protein extraction was developed to provide a swift, clear view of the bone proteome. Relative changes in protein expression between control and osteopenic samples were quantified using difference gel electrophoresis (DIGE) technology after affinity chromatographic depletion of albumin and IgG. The proteins that were determined to be differentially expressed were identified using standard liquid chromatography mass spectrometry (LC/MS/MS) and database searching techniques. In order to rule out blood contamination, blood from age-matched osteoporotic, osteopenic and controls were analyzed in a similar manner. Image analysis of the DIGE gels indicated that 145 spots in the osteopenic bone samples changed at least ± 1.5-fold from the control samples (P < 0.05). Three of the proteins were identified by LC/MS/MS. Of the proteins that increased in the osteopenic femurs, two were especially significant: carbonic anhydrase I and phosphoglycerate kinase 1. Apolipoprotein A–I was the most prominent protein that significantly decreased in the osteopenic femurs. The blood samples revealed no significant differences between groups for any of these proteins. In conclusion, carbonic anhydrase I, phosphoglycerate kinase 1 and apolipoprotein A–I appeared to be the most significant variations of proteins in patients with osteopenia and osteoarthritis.
Introduction
Osteoporosis is responsible for more than 1.5 million fractures annually. One in two women and one in four men over age 50 will have an osteoporosis-related fracture in their lifetime. The estimated national (US) direct expenditures (hospitals and nursing homes) for osteoporotic and associated fractures was $19 billion in 2005 ($47 million each day) – and the cost is rising. 1 The National Osteoporosis Risk Assessment, an ongoing study of osteoporosis in more than 200,000 postmenopausal women, demonstrated that bone mineral density (BMD) declines with age in all women. 2
Tremendous strides have been made in the understanding of the pathogenesis and treatment of osteoporosis, but the specific pathogenetic mechanisms in osteoporosis remain poorly understood. 3,4 At the cellular level, the advances made following the discovery of receptor activator of nuclear factor kappa B ligand (RANKL), RANK and osteoprotegrin have revolutionized our thinking concerning bone resorption, and great strides have been made concerning the role of insulin-like growth factor 1, bone morphogenetic proteins and other signaling molecules in bone formation. 3–5 However, understanding of the pathophysiology of osteoporosis at the level of bone as a tissue has not been achieved. The focus of this study is to identify changes in bone tissue proteomes that differentiate between osteopenic and control bone tissue of human femoral neck and its total environment, possibly leading to a better understanding of the pathogenesis of osteoporosis.
Methods
Patient characterization
Postmenopausal women with degenerative osteoarthritis requiring hip replacement were recruited following an institutional review board (Scott & White Hospital, Temple, TX, USA)-approved protocol and obtaining informed consent of the patient. Patients for the femoral neck studies were placed into two groups divided by preoperative dual-energy X-ray absorptiometry (DEXA) T scores of their affected hip for surgery (Table 1). Patients with a T-score greater than −1 were placed into the control group. Patients with T scores less than −1 were placed into the investigational group. World Health Organization has previously defined osteoporosis as BMD 2.5 standard deviations below the mean for young adult white women (T score <− 2.5). Osteopenia is defined as BMD between −2.5 and −1. Patients were excluded who were taking glucocorticoids, bisphosphonates or hormone replacement therapy. All procedures were approved by the Scott & White Institutional Review Board. A different group of patients providing blood samples were divided into three groups according to the criteria described above (Table 1). These patients were not undergoing hip surgery.
Subject characteristics
*Osteoporosis
DEXA scans
DEXA scans of both hips and the spine were performed preoperatively using Lunar Prodigy Technology (Minster, OH, USA) scans. This involves placing the patient's hip in special holders that internally rotate the hip to allow a better approximation of a true anterior-posterior. A computer then draws boxes in accordance with specific anatomic landmarks. Separate boxes are created for the proximal femoral neck, Ward's triangle and the subtrochanteric region. A technician then draws the outline of the femur and pelvis which the computer uses as a separation between bone and air to calculate the BMD. The femoral head can have osteophytes and cortical thickening related to degenerative changes. An effort was made to minimize false elevations of estimated BMD related to these periacetabular and pericervical osteophytes by using the measurement at Ward's triangle to define BMD. Ward's triangle is a specific identifiable portion of the femoral neck commonly used for DEXA scans. This triangle is located below the region where osteophytes typically form and all cancellous bone samples were obtained from this same anatomic triangle.
Bone sample acquisition
The head and neck of the femur was removed from osteopenic and non-osteopenic hips during routine scheduled total hip surgery. The tissue was rapidly frozen in liquid nitrogen, sectioned with a hacksaw and samples of bone were taken from the femoral neck with a rongeur. The bone was then sectioned and pulverized under liquid nitrogen using a Spex Freezer Mill (SPEX SamplePrep, St Metuchen, NJ, USA) to obtain frozen powder.
Bone protein preparation
Various methods for bone protein extraction have been reported. 6–8 Each of the published methods utilizes multiple extraction steps using acidic conditions (to demineralize the bone prior to protein extraction) and guanidine and ethylenediaminetetraacetic acid to extract the proteins. Some of the steps require multiple days of treatment prior to complete protein extraction. These conditions offer challenges to the mass-spectrometry-based analysis of the proteome including the possibility of protein degradation due to long incubations in solubilization buffers. In particular, the extracted proteins, present in guanidine-containing buffers, are incompatible with standard difference gel electrophoresis (DIGE)-labeling protocols. Contamination with high levels of salts would require a precipitation step to concentrate and desalt the proteins prior to labeling with the Cy dyes leading to the potential loss of proteins.
In order to simplify the extraction procedure while at the same time preparing samples in a buffer that is more compatible with the DIGE procedure and obviate the need for a precipitation step, we tested several protein extraction protocols and compared them to published procedures. One procedure using 10 mmol/L Tris, pH 7.5, 1% 3-[(3-cholamidopropyl)dimethylammonio]-1-propanesulfonate (CHAPS) with protease inhibitors appeared to be comparable to the multiday extraction procedure used by Jiang et al.,
8
based on sodium dodecyl sulfate polyacrylamide gel electrophoresis (SDS-PAGE) analysis of the extracted bone proteome. To make the comparison, bone proteins were extracted from 200 mg pulverized bone according to the three-step process of Jiang et al.
8
The extracts were clarified by centrifugation and stored separately until further analysis. For comparison, 50 mg of bone powder was incubated with 1 mL of 10 mmol/L Tris, pH 7.5, 1% CHAPS, with a protease inhibitor cocktail added (Complete™; Roche, Indianapolis, IN, USA), vigorously vortexed, then placed on ice for 60 min and subjected to centrifugation at 13,000 ×
Human blood protein preparation
Protease inhibitors (Complete™) were pipetted onto the frozen, clotted blood as it was thawed on ice in an effort to reduce protein degradation. The clots were disrupted using a Polytron (30 s, setting #5; Polytron Corporation, Montreal, QC, Canada) while the samples were held on ice. The disrupted blood was subjected to centrifugation (100,000 ×
Albumin and immunoglobulin G depletion
Solutions of extracted proteins were filtered through a 0.45 μm filter (Millipore, Billerica, MA, USA) and immunodepleted of albumin and IgG using anti-human albumin and anti-human IgG Seppro® microbeads (GenWay Biotech Inc, San Diego, CA, USA) according to the manufacturer's instructions on a ÄKTA Explorer 10 chromatography system (GE Healthcare, Piscataway, NJ, USA). Fractions were monitored by SDS-PAGE 9 and fractions determined to be albumin-free were pooled and concentrated by spin filters (Vivaspin 6 with 5 kDa cut-off membrane; Vivascience, Hannover, Germany) by centrifugation at 4000 g at 4°C. SDS-PAGE analysis of the depleted proteins indicated that the mixtures were free of these major proteins. The albumin- and IgG-depleted samples were concentrated to approximately 0.1 mL using spin filters as described above prior to labeling with Cy dyes.
Minimal labeling of bone proteins with Cy dyes
The extracted, depleted proteins were diluted into DIGE labeling buffer (9 mol/L urea, 2% CHAPS, 30 mmol/L Tris, pH 8.5). The mixed internal standard methodology of Friedman 10 was used in these studies. Each experiment comprised two samples performed in duplicate, generating four individual samples that were co-resolved across four two-dimensional (2D) (DIGE) gels that were all coordinated through the same pooled-sample internal standard. All experiments were performed using 13 cm pH 4–7 isoelectric focusing (IEF) gradients containing 300 μg of total protein equally divided between any two samples and an aliquot of the internal standard as follows. Protein from each sample was dissolved in labeling buffer (see above) to a concentration of 10 mg/mL. An aliquot of each sample was removed and combined in a separate tube containing the pooled-sample internal standard and labeled with Cy2 (GE Healthcare). Fifty micrograms of each individual sample were labeled with 200 pmol of either Cy3 or Cy5. A dye-swapping scheme was used on duplicate samples to control for any dye-specific labeling artifacts that might occur. All reactions were performed in semi-darkness and on ice for 30 min according to the manufacturer's instructions and quenched with the addition of 10 mmol/L lysine for an additional 10 min on ice. The labeled and quenched samples were combined and mixed with an aliquot of the Cy2-labeled pooled-sample standard and brought to a final volume of 250 μL with rehydration buffer (9 mol/L urea, 2% CHAPS, 18 mmol/L DL-dithiothreitol (DTT) that contained 0.5% immobilized pH gradient (IPG) buffer (pH 4–7) and mixed thoroughly.
2D gel electrophoresis and imaging
First dimension separation was carried out with an IPGphor apparatus (GE Healthcare). Samples were incubated with Immobiline pH gradient DryStrips (pH 4–7; GE Healthcare) and allowed to rehydrate overnight in ceramic strip holders. IEF was carried out at a constant temperature of 20°C for a total of 35 kVh (500 V for 0.5 kVh, step to 1000 V for 1 kVh, step to 8000 for 33.5 kVh). Before the second dimension, the strips were incubated with equilibration buffer (50 mmol/L Tris-HCl, pH 8.8, 6 mol/L urea, 30% glycerol, 2% SDS, 0.01% bromophenol blue) containing 100 mmol/L DTT for 15 min at room temperature. The strips were subsequently alkylated in a fresh aliquot of the equilibration buffer containing 250 mmol/L iodoacetamide for 15 min at room temperature before loading on top of hand-cast 12% polyacrylamide slab gels prepared using low-fluorescence glass plates (GE Healthcare) with one plate pretreated with Bind Silane (GE Healthcare) to preferentially affix the gel to ensure accuracy of subsequent robotic protein excision. Molecular weight markers were applied alongside the sample strip on a small tab of Whatman #1 filter paper saturated with standard proteins (Bio-Rad, Hercules, CA, USA). The strips and the tabs were fixed in place with 0.5% low melting temperature agarose. Electrophoresis was carried out in a Hoefer SE600 Electrophoresis System (GE Healthcare) at constant 35 mA per gel at 10°C until the dye front reached the gel bottom. Electrophoresis was continued for seven minutes after this point to allow the unused Cy dye (dye front) to emerge from the gel into the lower buffer tank. The Cy3-, Cy3- and Cy5-labeled, co-resolved protein maps were imaged at 488, 520 and 620 nm, respectively, using a Typhoon Trio Variable Mode Imager (GE Healthcare). Gels were scanned at 100 μm resolution and analyzed using the DeCyder v6.5 suite of software (GE Healthcare). After imaging for the Cy dye components, the non-silanized glass plate was removed and the gel was fixed and stained with Deep Purple (GE Healthcare) according to the manufacturer's instructions. The gel was scanned on the same imager and the Deep Purple stained protein image was merged into the DIGE analysis and used as a guide for subsequent protein excision.
DIGE analysis
All gel images were analyzed using the DeCyder v6.5 suite of software tools (GE Healthcare). Differentially labeled proteins were analyzed in the differential in-gel analysis (DIA) module to quantitatively compare the normalized volume ratios of each protein. These data-sets were then collectively analyzed using the biological variation analysis (BVA) module. Protein spots were matched and relative ratios were calculated between control and experimental samples. Statistical significance was associated with each change in abundance using Student's t-test and analysis of variance (ANOVA) analyses. Proteins whose abundances changed ±1.5-fold and had Student's t-test values <0.05 were classified as proteins of interest (POIs).
In-gel digestion, mass spectrometry and protein identification
POIs were robotically excised, and digested with modified procine trypsin (Promega, Madison, WI, USA) using the Ettan spot picker and digestor (GE Healthcare). Peptides were fractionated on a hand-crafted microcapillary RP-C18 column (0.75 μm id × 10 cm) followed by fragmentation using electrospray ionization-liquid chromatography-mass spectrometry (ESI LC/MS/MS) in a nanospray configuration with a LCQ DecaXP (ThermoElectron, Inc, San Jose, CA, USA). The MS method was set to cycle through one full MS scan followed by three MS/MS scans. The scan range in full MS mode was 400–1400m/z. Dynamic exclusion was enabled in the Xcalibur instrument control software. The default charge state was set to 2. Three microscans were acquired per scan. The spectra obtained from mass spectrometric analyses were searched using Sequest search engine (BioWorks 3.1 software from ThermoElectron Inc). For TurboSEQUEST search parameters for .dta generation, we used a threshold of 50,000, precursor mass tolerance of 1.4 AMU, group scan of 25, minimum group count of 1 and minimum ion count of 12. For TurboSEQUEST search parameters, we used a peptide tolerance of 2.5 AMU and fragment ions tolerance of 0.0 with charge state set on ‘Auto’. An in-house indexed database was created from the nr database (retrieved from ftp.ncbi.nih.gov, July 2007) using search terms human and Homo sapien. PicoFrit columns used for nanospray were purchased from New Objectives (Woburn, MA, USA). Magic C18AQ resin was purchased from Michrom Bioresources, Inc (Auburn, CA,USA). HPLC grade water, acetonitrile and methanol were purchased from Burdick and Jackson (Phillipsburg, NJ, USA). Formic acid was purchased from Sigma Chemical Co (St Louis, MO, USA).
Western blotting
Bone proteins were extracted from pulverized bone using a solution containing 10 mmol/L Tris (pH 7.5), 1% CHAPS. The extracted proteins were separated by SDS-PAGE according to Laemmli 9 and electroblotted to polyvinylidene fluoride membranes (Millipore) according to Mozdzanowsky. 11 Polyclonal antibodies to the specific proteins under examination were purchased from Abcam Laboratories (Cambridge, MA, USA) and used according to the manufacturer's recommendations. Western blots were developed using biotinylated secondary antibodies and alkaline phosphatase and 5-bromo-4-chloro-3'-indolyphosphate-p-toluidine salt and nitro-blue tetrazolium chloride (BCIP/NBT) provided in ABC Kits from Vector Laboratories (Burlingame, CA, USA). Briefly, membranes were blocked using 5% non-fat dried milk (NFDM) in Tris-buffered saline overnight (4°C). Primary antibodies were diluted in 5% NFDM incubated with the membranes at dilutions suggested by the suppliers. After washing in NFDM, the membranes were incubated with biotinylated secondary antibodies diluted in NFDM and later mixed with avidin-conjugated alkaline phosphatase. The labeled membranes were subsequently washed in RIPA buffer prior to addition of the BCIP/NBT substrate. Development was terminated by washing the membranes with MilliQ (Millipore) water and air-dried.
Protein estimation and SDS-PAGE analysis
The protein concentration of all extracts was estimated by the method of Bradford (Pierce Chemical Co, Rockford, IL, USA) using albumin as a standard. All extracts were analyzed by SDS-PAGE according to Laemmli 12 on gels composed of 12% acrylamide and stained with Gel Code (Pierce Chemical Co, Rockford, IL, USA).
Results
The age of the patients in the two bone groups was essentially the same, with each group mean being 71 years of age (Table 1). The patients in the blood sample group had a mean of 67 years for the osteoporotic and osteopenic groups and the control group averaged 73 years. Bone density measures demonstrated a three-fold difference (P ≤ 0.019) in t-value and an 18% difference (P ≤ 0.025) in BMD as determined from Table 1.
One hundred and forty-five spots in the osteopenic bone samples changed at least ±1.5-fold from the control samples. Fifteen were chosen to be viable candidates for LC/MS/MS. These 15 are identified by circles on Figure 1 and correspond with the spot number in Table 2, which gives the characteristics of each protein. Ten of these proteins decreased in osteopenia and five increased. Of the proteins that increased in the osteopenic femur necks, two appeared to be especially significant: carbonic anhydrase I and phosphoglycerate kinase 1. Of the proteins that decreased in the osteopenic femur necks, apolipoprotein A–I and annexin were most prominent; however, the change in annexin could not be confirmed by Western blotting. WD Repeat Domain 35 had a large fold change, but the peptide count was never more than one. The protein that was most consistently increased in the osteopenic femurs was carbonic anhydrase I, which increased up to six-fold (Figure 2a). Phosphoglycerate kinase 1 was increased up to 12-fold (Figure 2b), but the number of peptides detected was not as large as was carbonic anhydrase I. Apolipoprotein A–I (Figure 2c) strongly decreased up to 23-fold with a high peptide count. It must be kept in mind that it is the difference in protein presence between the two groups that is detected, and therefore the normally identified proteins in bone would not be identified. There were no significant protein changes between the blood sample groups.

A representative gel of two-dimensional difference gel electrophoresis experiments with the spots of the final picks circled. The numbers represent the proteins listed in Table 2 of the protein identification summary
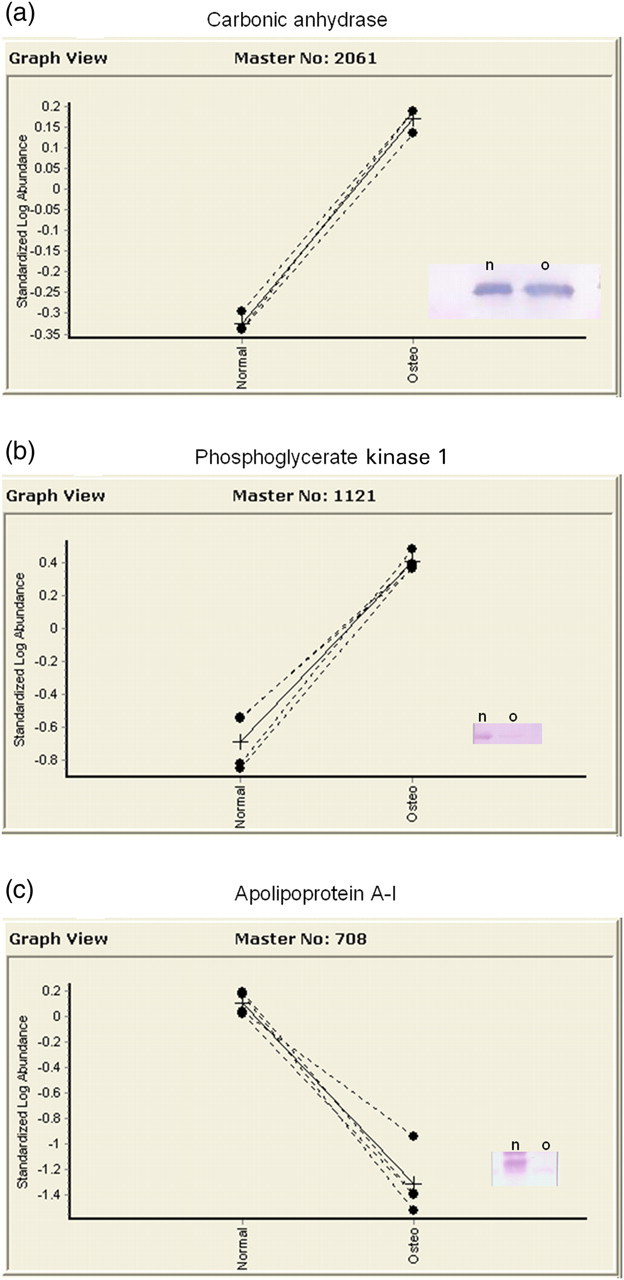
Graph view of the protein changes for all patients. (a) Change for carbonic anhydrase I was up to a six-fold increase for osteopenic patients. Western blot is goat 1:1000 dilution. (b) Phosphoglycerate kinase 1 increased by 12-fold, but the peptide count was not as strong. Western blot is rabbit 1:250 dilution. (c) Apolipoprotein A–I demonstrated a 23-fold decrease. Western blot is goat 1:5000 (note: label reference to normal refers to control samples)
Protein identification summary
Discussion
DIGE adds a quantitative component to 2D-gel electrophoresis and allows for the detection of subtle changes in protein abundance with statistical confidence. DIGE uses three spectrally resolvable fluorescent dyes (Cy2, Cy3 and Cy5) to label up to three samples and run them together on the same 2D gel. This allows for direct relative quantification for a given protein without interference from gel-to-gel variation. In addition, the use of a third dye to label a pooled-sample internal standard allowed us to run a series of coordinated DIGE gels that not only removed the technical variability but improved statistical confidence using Student's t-test or ANOVA. In this way, statistical confidence was measured for each individual protein based on the variance of repetitive measurements, independent of the variation in the population. Importantly, the design of the experiment with the internal standard (third dye-labeled pooled sample) allowed for multivariable analyses to be performed in one coordinated experiment.
Protein samples extracted from osteopenic and control bone tissue were labeled with fluorescent dyes and separated by IEF on immobilized pH gradient strips, and molecular weight using SDS-PAGE. The gels were scanned using a Typhoon Trio imager (GE Healthcare) to resolve the three dye images. The gels were subsequently post-stained with Deep Purple and then the CyDye and Deep Purple images were assembled and analyzed using DeCyder Software (GE Healthcare).
The DeCyder suite of software tools was specifically developed to support the DIGE platform, especially for those experiments that incorporate the internal standard approach. The DIA module was used to directly quantify the protein-spot volume ratios between the triply co-detected signals. The BVA module was used for these experiments to cross-compare replicate samples from pair-wise and multivariate analyses (N = 4). This allowed for the calculation of Student's t-test and ANOVA statistics for individual protein abundance changes. These statistics measure the significance of the variation of a specific protein change, independent of the overall distribution of abundance changes in the population. In these experiments, proteins whose abundances changed ±1.5-fold and had Student's t-test values <0.05 were classified as POIs and added to an automated Pick List for further processing and identification.
The identification of POIs
The identification of the POIs on the Pick List was accomplished using ESI LC/MS/MS. The proteins were robotically excised from the Deep Purple stained gels and digested with trypsin using the Ettan Picker and Digestor system (GE Healthcare). Tryptic peptides were extracted from the digested gel plugs and analyzed on a ThermoFinnigan LCQ DecaXP ESI ion trap mass spectrometer equipped with a nanospray source (ThermoFinnigan Thermo Scientific, Vernon Hills, IL, USA). The instrument is capable of MSn and will provide additional fragment information on ions of interest. The data provided by these instruments were analyzed with established routines with either in-house copies of TurboSequest or MASCOT search algorithms.
The POIs were identified from their primary sequence, using the mass spectrometry data acquired as described above, together with the search engine MASCOT (Matrix Science,
The techniques used in this study identified three proteins, with major variations between control and osteopenic patients – carbonic anhydrase I, phosphoglycerate kinase 1 and apolipoprotein A–I. It must be kept in mind that we are looking at bone as an intact tissue, including bone, marrow, fat and blood. It cannot be confirmed conclusively that the proteins were localized specifically in bone, blood or hemopoietic tissue; however, all of these components constitute the milieu or micro-environment of the bone tissue and were consistent changes in all osteopenic patients. None of the significant protein differences identified in bone tissue were found in the blood samples, indicating that the protein changes are most likely due to osteopenic changes in the bone tissue.
The function of these proteins in osteoporosis, if any, is absolutely unknown and must await further study. Our data indicate that there is a three- to six-fold increase in carbonic anhydrase I in the femoral neck of osteopenic patients. This is a protein intimately involved in the process of bone resorption and some kidney disorders. There is also known to be an erythroid carbonic anhydrase. Carbonic anhydrase II is involved in the formation of HCl in osteoclasts, the bone resorbing cells, and is known to play a significant role in bone metabolism. 13,14 There have been several lines of evidence associating osteoporosis with acidosis, but this has been, for the most part, unsubstantiated. The Western diet is high in protein, which results in a slight dietary-induced metabolic acidosis and decreased BMD. 12,15–17 Patients with incomplete distal renal tubular acidosis have systemic acidosis and reduced bone mass. 18,19 Interestingly, animal models 20,21 and a human study 22 have demonstrated improved BMD when given proton inhibitors and one animal study has demonstrated an increase in carbonic anhydrase II gene expression following ovariectomy. 23 Inversely, carbonic anhydrase II deficiency has been reported to result in osteopetrosis. 24
Phosphoglycerate kinase 1 is increased in the osteopenic state up to 12-fold. It is a transferase enzyme used to transfer a phosphate group from 1,3-biphosphoglycerate to ADP, forming ATP and 3-phosphoglycerate during glycolysis. Its increase may signify nothing more than an increase in anaerobic metabolism; however, this is unlikely since none of the other members of the glycolytic cycle are increased. Phosphoglycerate kinase 1 functions as a catalyst in both directions in glycolysis. The metabolism of 3-phosphoglycerate can lead to the production of serine, an amino acid that when substituted for glycine in type I collagen, can result in osteogenesis imperfecta. 25–27 On the other hand, 1,3-biphosphoglycerate can be metabolized to 2,3-diphosphoglycerate which controls the movement of oxygen from red blood cells to body tissues. A study of Israeli Arabs from the village of Jasser El Zarka in the Northern Coast of Israel reported increased levels of 2,3-diphosphoglycerate and frequent osteoporosis. 28 Any of these suggestions explaining the increased expression of phosphoglycerate kinase 1 in osteoporosis is purely speculative and only gives direction for further research. It is not infrequent that enzymes function independently in roles that are not in the present understanding of their usual metabolic pathways. 29 For example, there has been one report of the overexpression of phosphoglycerate kinase inducing a multidrug resistance phenotype. 30 Could phosphoglycerate kinase 1 possibly have some previously unseen independent role in the pathogenesis of osteoporosis?
The most prominent protein that decreased in the osteopenic femoral necks was apolipoprotein A–I. Apolipoprotein A–I demonstrated the most consistent and greatest change of all the proteins identified. It is a major component of HDL, both of which have been reported to be increased by estrogens and decreased by progesterone. 31 On the other hand, many have reported increased serum apolipoprotein A-I in postmenopausal women with decreases following hormone replacement therapy treatment. 32–35 These changes were quite small and not in the range of the decreases seen in this study. Also, hormone replacement therapy was an exclusion for this study. Further study is required to understand this observation.
In conclusion, we have identified major changes in proteins from osteopenic femurs that were not identified in osteopenic blood samples. Their function or role in osteoporosis, if any, is completely unknown at this time, but these data lend an interesting twist to the study of osteoporosis. It also must be kept in mind that osteoarthritic patients are thought to rarely have true osteoporosis and this study might possible be indicative only of a subset of osteoarthritic patients that are also osteopenic. 36
Footnotes
ACKNOWLEDGEMENTS
The authors wish to thank Sabrina Schmidtke for her technical assistance in DIGE analysis and mass spectrophotometry and Elena Lyuksyutova for her assistance with sample preparation and DIGE gels. This study was supported, in part, by the Center for Bone, Joint and Spine Research, Department of Orthopedics, Scott and White Hospital, Temple, TX, USA. The authors have full control of all primary data.