
Abstract
Ataxia-telangiectasia mutated (ATM) kinase is a component of a signalling mechanism that determines the process of decision-making in response to DNA damage and involves the participation of multiple proteins. ATM is activated by DNA double-strand breaks (DSBs) through the Mre11–Rad50–Nbs1 (MRN) DNA repair complex, and orchestrates signalling cascades that initiate the DNA damage response. Cells lacking ATM are hypersensitive to insults, particularly genotoxic stress, induced through radiation or radiomimetic drugs. Here, we investigate the degree of ATM activation during time-dependent treatment with genotoxic agents and the effects of ATM on phospho-induction and localization of its downstream substrates. Additionally, we have demonstrated a new cell-cycle-independent mechanism of ATM gene regulation following ATM kinase inhibition with KU5593. Inhibition of ATM activity causes induction of ATM protein followed by oscillation and this mechanism is governed at the transcriptional level. Furthermore, this autoregulatory induction of ATM is also accompanied by a transient upregulation of p53, pATR and E2F1 levels. Since ATM inhibition is believed to sensitize cancer cells to genotoxic agents, this novel insight into the mechanism of ATM regulation might be useful for designing more precise strategies for modulation of ATM activity in cancer therapy.
Introduction
Eukaryotic cells are equipped with complex signalling mechanisms that sense DNA damage and repair it, by activating the DNA damage response (DDR) pathway. 1 The DDR pathway generates a signalling response that coordinates cell cycle progression, DNA damage repair, cellular senescence and apoptosis. 2,3 ATM (ataxia-telangiectasia mutated), the gene that codes for a 370-kDa serine–threonine kinase protein that belongs to the phosphoinositide 3-kinase super family, is a key nodal point in the DDR pathway. 4 Once activated in the course of the DNA damage response, ATM elicits signalling that leads to G1, S or G2 cell cycle arrest and activation of repair pathways or apoptosis. 4–6 Since ATM function is implicated in a number of responses resulting from DNA damage, ATM kinase needs to interact in a timely manner with a variety of downstream effectors. These interactions induce various signalling functions such as checkpoint arrest with p53, Mdm2 and Chk2 in the G1, 6–8 damage-induced S-phase arrest with Nbs1, Brca1, FancD2 and SMC1, 9–12 G2/M arrest with Brca1 and hRad17, 13,14 and apoptosis with E2F1, Chk2, p53, p73 and Bax. 15–21
The important role of ATM in DDR signalling is recognized by the fact that ataxia-telangiectasia (AT) patients (lacking a functional ATM) have a pleiotropic phenotype marked by neurological abnormalities, immunodeficiency and predisposition to cancer, especially but not restricted to, lymphomas and leukemias. 22 At a cellular level, AT cells, which lack detectable ATM, are radiosensitive, have abnormal telomere morphology and genomic instability, undergo radio-resistant DNA synthesis and fail to respond to and repair double-stranded DNA damage. 23
ATM is normally held in an inactive homodimeric state. Once activated after DNA damage, it undergoes autophosphorylation on residue serine-1981, resulting in the ATM dimers to form active monomers. This represents a key feature of regulation of ATM activity. 24 Other autophosphorylation sites have also been reported. 25 This phosphorylational induction of ATM happens rapidly after ionizing radiation-induced DNA damage, suggesting that it predominantly acts early in the DDR signalling. 11 At the damaged foci, it co-localizes with γH2AX, mediated by NBS1, where several other downstream ATM substrates participate in signalling. 26
In terms of its expression, ATM is regarded as a housekeeping gene with a steady constitutive expression. 27 It has been demonstrated that the levels of ATM remain constant throughout the cell cycle. 27 Additionally, exposure of cells to damaging agents does not cause any change in ATM expression levels or subcellular localization, 27,28 with the major control of ATM activity being modulated by autophosphorylation of the pre-existing ATM molecules. 24 However, there are contrary reports demonstrating radiation-induced upregulation of ATM in situ. 29 Previous studies have also reported induction of ATM protein in response to mitogens, resulting in increased ATM activity. 29 By contrast, epidermal growth factor has been reported to downregulate ATM at the transcriptional level. 30 In most of these instances, alterations in the amount of ATM protein resulted in variation in its activity, ultimately impacting cellular sensitivity towards genotoxic agents. Promoter studies of ATM have revealed radiation inducibility 31 and tissue-dependent variation in expression in vivo. 32 We have previously reported a link between ATM activity and its expression via promoter studies. 33 Nevertheless, there are still gaps in our understanding of the exact molecular mechanisms that lead from sensing DNA damage to the regulation, localization and activation of the ATM molecule.
We studied the regulation and subcellular localization of ATM and its substrates in early phases of the cell cycle, upon different extents of DNA damage in the human epithelial cell line MCF10A. We have found that inhibition of ATM kinase by its specific inhibitor KU55933 (KU) results in a rapid upregulation of ATM protein expression followed by oscillation in its expression. Using promoter reporter assays, we discovered that this particular behavior is governed at a transcriptional level. ATM protein oscillation upon inhibition of its kinase activity is accompanied by a temporary induction of ATM and ATR phosphorylation and nuclear accumulation of E2F1. Moreover, it has been revealed that the oscillation pattern occurring at the transcriptional level is not a cell-specific phenomenon, as it has been observed in normal HaCaT and cancer MCF-7 cells. Thus, we have revealed a novel negative autoregulatory mechanism of ATM expression affecting regulation of its substrate in both normal and DNA-damaged conditions.
Materials and methods
Cell culture and treatments
MCF-10A, HaCaT and MCF-7 cells were maintained in Dulbecco's modified Eagle's medium (DMEM; Invitrogen, Paisley UK) supplemented with 10% fetal bovine serum (FBS), 2 mmol/L glutamine, 1 mmol/L sodium pyruvate, 100 μg/mL streptomycin and 100 U/mL penicillin in an atmosphere of 5% CO2. ATM kinase inhibitor KU55933 (Cat. No. 118500) and doxorubicin (Cat. No. 324380) were obtained from Calbiochem, Nottingham UK. Synchronization of cells was established by serum-starving the cells in DMEM for 48 h followed by serum addition for different time points. Cycloheximide (CHX) was obtained from Sigma-Aldrich, Dorset, UK (Cat. No. 01810) and the treatment with CHX was always performed one hour prior to any other treatment.
Protein extraction and quantification
Cell extracts were prepared using RIPA buffer (Pierce Biotech, Northumberland, UK) containing a protease and phosphatase inhibitor cocktail (Pierce Biotech). All the protein extracts were prepared according to the manufacturers’ instructions and subjected to sonication of two cycles for 10 s at 50% pulse. The final mixture was shaken gently on ice for 15 min and the protein supernatant was obtained by centrifuging the lysates at 14,000 ×
To obtain nuclear fractions, the pellet was briefly washed thrice in ice-cold hypertonic buffer (0.4 mmol/L NaCl, 1 mmol/L EGTA, 1 mmol/L EDTA, 20 mmol/L HEPES pH 8.0, 1 mmol/L DTT, 1 mmol/L PMSF, 1 mg/ml aprotinin, 1 mg/mL leupeptin, 1 mg/mL pepstatin, 0.1 mmol/L Na3VO4), followed by incubation in hypertonic buffer for 30 min at 4°C, and centrifugation (13,000 ×
Antibodies and immunoblotting
Antibodies used in the study
*Abcam Bioscience, Cambridge, UK
†Cell Signaling, Danvers, MA, USA
Immunocytochemistry
MCF-10A cells were grown in standard glass coverslips coated with polylysine (Sigma-Aldrich) and placed in Petri dishes containing DMEM supplemented with 10% fetal bovine serum, 2 mmol/L glutamine, 1 mmol/L sodium pyruvate, 100 μg/mL streptomycin and 100 U/mL penicillin in an atmosphere of 5% CO2. The next day, following relevant treatments, cells were fixed in 3% paraformaldehyde in standard phosphate-buffered saline (PBS) at room temperature for 30 min. The cells were gently washed twice with 1 mL of PBS, blocked by 1% goat serum, 1% bovine serum albumin in PBS containing 0.05% Triton X-100, for 30 min, incubated with relevant primary antibody (Table 1) diluted in blocking solution, washed three times with 0.3% Triton X-100/PBS for five minutes, and then incubated with Alexa Fluor 488/568-conjugated goat anti-rabbit or anti-mouse antibodies (Invitrogen) for 30 min. After subsequent washing three times with 0.3% Triton X-100/PBS for five minutes, cells were mounted with Vectashield solution (Vector Laboratories, Peterborough, UK) and imaged under relevant filters with a Leica DMiRe2 electronic microscope (Leica Microsystems, Wetzlar, Germany).
ATM promoter characterization
Promoter characterization assays were performed using a dual luciferase assay system (Promega, Southampton, UK) and P-Timer1 vector (Clontech Laboratories, Mountain View, CA, USA). The ATM promoter region
32
was subjected to polymerase chain reaction using primers ATM F 5′ GATCAAAACCACAGCAGG 3′ flanked by xho-restriction sites and ATM R 5′ CTCTCACCCACCCTCTTC 3′ flanked either by Nco1 or HindIII restriction sites and cloned into multiple cloning sites of PGL-3 vector using Xho1 and Nco1 restriction sites and P-Timer1 vector using Xho1 and HindIII restriction sites. The fidelity of the constructs was checked and verified by sequencing using commercial sequencing service (
Imaging and analysis
Semiquantitative analysis of raw immunoblots was performed by capturing the images in high-resolution TIFF format files using a charge-coupled-device camera (AxioCam MRc; Carl Zeiss, Hertfordshire, UK) and being subjected to Gelpro analysis software (Gelpro Software, Bethesda, MD, USA) for densitometry. Fluorescence images of immunocytochemistry and P-Timer 1 ATM promoter were collected under relevant excitation and emission filters depending on the fluorotype under a Leica DMiRe2 electronic microscope equipped with a iXonEM +897 EMCCD camera (Andor Technology Ltd, South Windsor, CT, USA). Images were visualized using multidimensional microscopy software Andor Module iQ Core. Co-localization assays and fluorescence intensity measurements were performed and determined with software integral features supplied by Andor IQ core software features. All results were analyzed by analysis of variance with the post hoc Dunnett's test using GraphPad Prism 3.02 software (GraphPad Software, Inc., San Diego, CA, USA). The statistical results with P < 0.05 were considered as significant. Data were generally expressed as mean ± SEM for individual sets of experiments.
Results
ATM signalling activity at different extents of damage in the DDR pathway
It has been shown that ATM is involved in the regulation of cell cycle progression by phosphorylation of a variety of substrates including P53, Chk2 and E2F1. 6,16,35 However, ATM regulation during the cell cycle and the effects of such regulation on its downstream substrates are not fully elucidated.
First, we studied the level of ATM and the phosphorylation of its key substrates, P53, Chk2 and E2F1, through the early phases (G1 to S phase) of the cell cycle in the human epithelial cell line, MCF10A. Cells were grown until 70% confluent and serum-starved for 48 h to synchronize them in the G1 phase. Serum was added back and cells were allowed to grow for different time points and their protein lysates were collected and processed for Western blot analysis. We observed a slight increase in the total and phospho-ATM serine-1981 (pATM) concentrations at 0.5 h postserum addition. This small upregulation was generally maintained with a further increase at the four-hour time point while overall showing no major change (Figure 1a). Consistent with ATM and pATM, both P53 and phospho P53 serine 15 (pP53) showed an overall increase at the four-hour time point (Figure 1a). Total and phospho Chk2 threonine-68 (pChk2) concentrations, while remaining generally unchanged for the first three time points, showed induction after two hours, with the highest levels at eight hours postserum addition. E2F1 showed significant changes in the levels of both total and phospho E2F1 serine-31 (pE2F1) forms, rising after two hours postserum addition and reaching a maximum at eight hours (>8-fold increase P < 0.001) (Figure 1a). The induction that we observed in the levels of these proteins at different time points may indicate a requirement for cell cycle progression, where an upregulation of E2F1 (∼4 h after serum addition) is associated with degradation of cyclin D through G1/S transition.
36
DNA damage response (DDR) proteins through the cell cycle and under DNA damage. (a) Levels of DDR proteins change during cell cycle progression after release from serum starvation. Lysates from synchronized cells were blotted for total ATM, pATM S-1981, total p53, pP53 S-15, total E2F1, pE2F1 S-31, and total Chk2 and pChk2 T-68 at different time points after serum addition as indicated. (b) The DDR pathway is active in the MCF10A cell line. Synchronized cells were either left untreated, or exposed to 0.5 μmol/L doxorubicin (Dox) for the indicated time points and lysates processed for immunoblotting for total ATM, pATM S-1981, total p53, pP53 S-15, total E2F1, pE2F1 S-31, and total Chk2 and pChk2 T-68. For (a, b), semiquantitative analysis of Western blot signals are shown, by using integrated optical densitometry analysis. Data presented in all panels are the mean with standard error (bars) of n = 3 independent experiments with statistical significance calculated according to the scale (*P < 0.05, **P < 0.01, ***P < 0.001)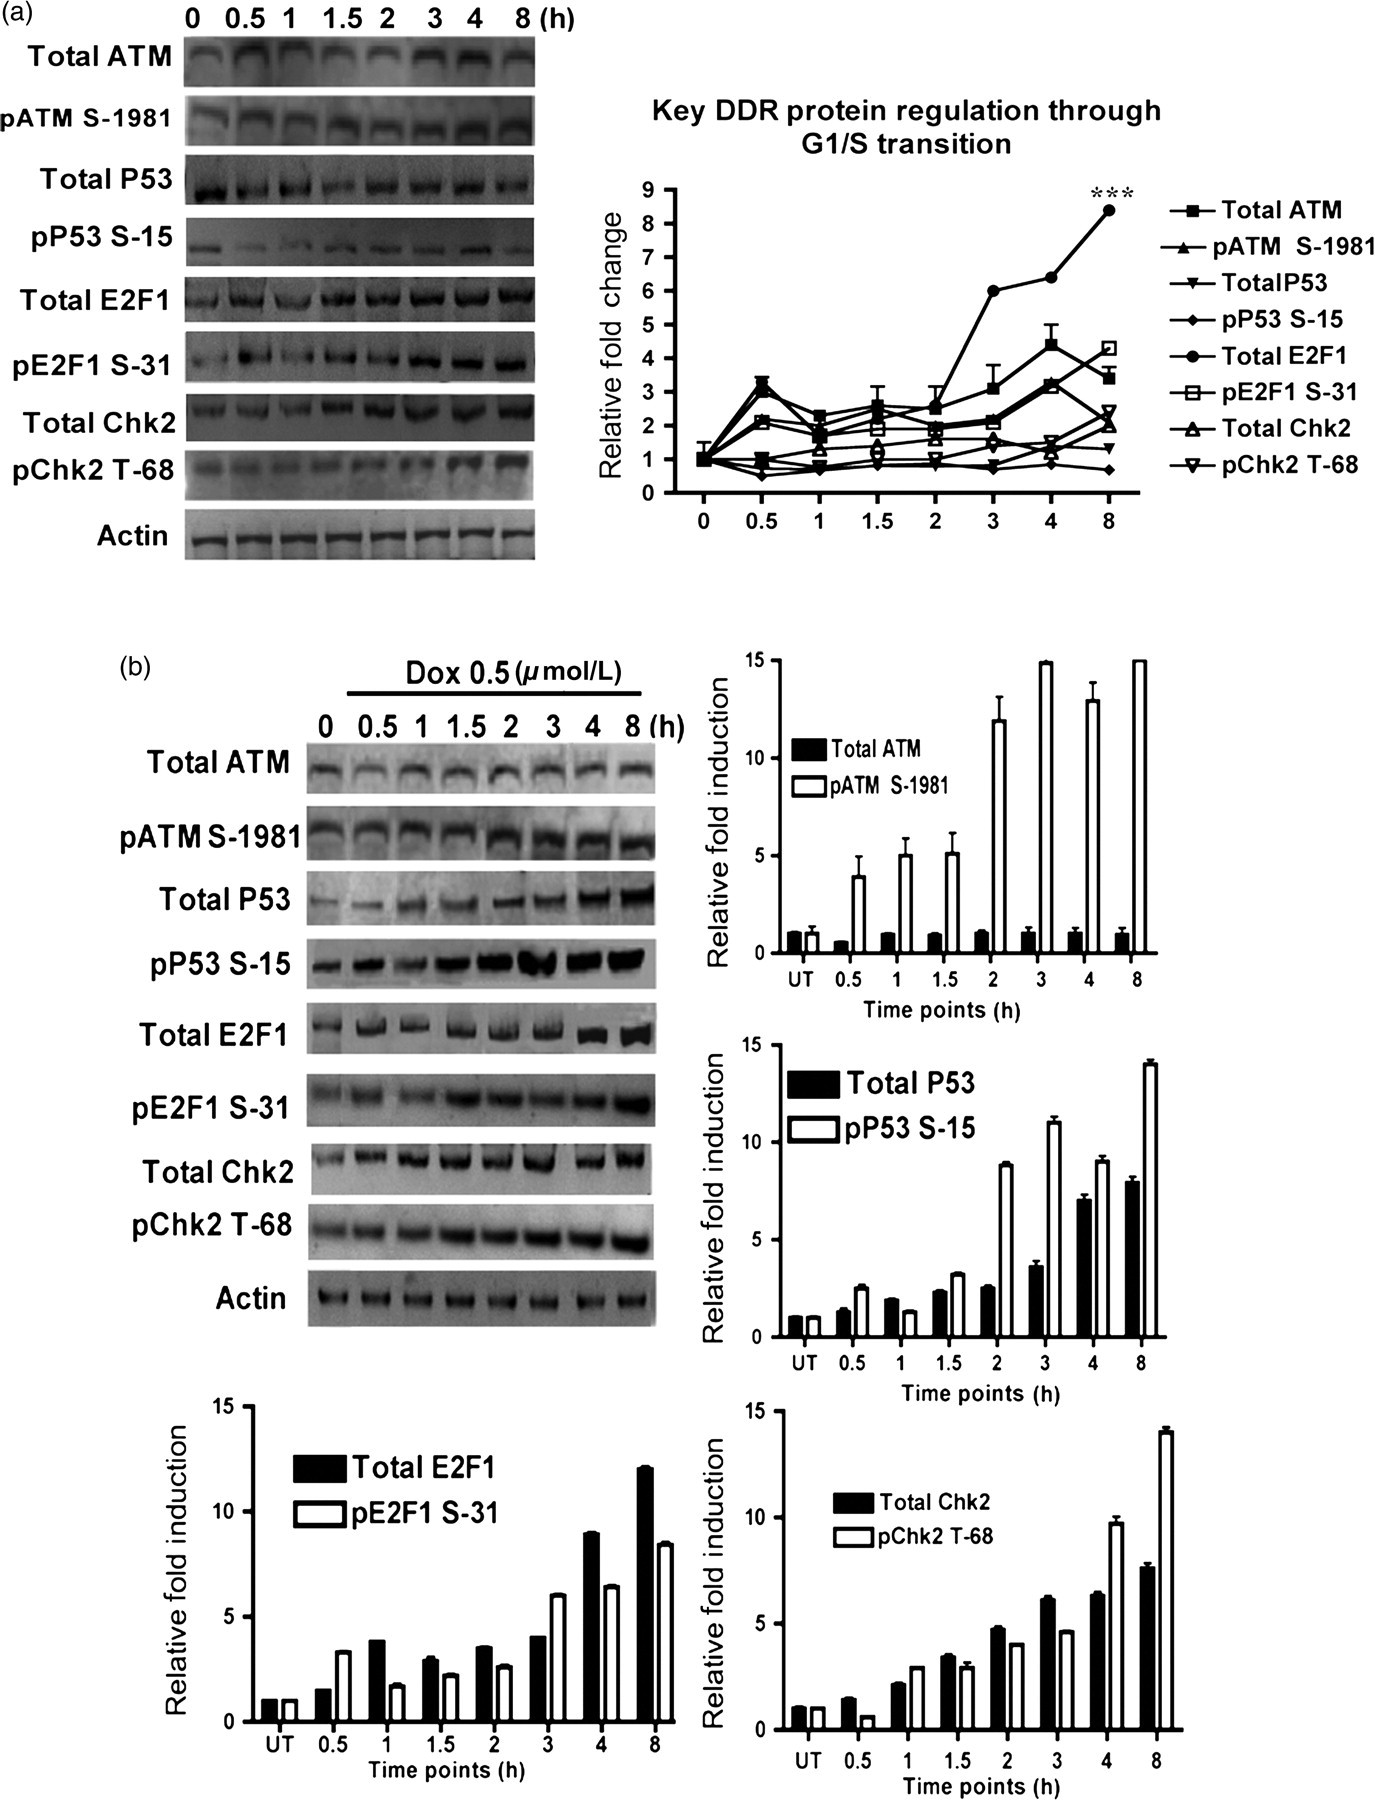
Next, the double-strand break inducing agent, doxorubicin (Dox), was used to induce DNA damage in cells synchronized at the same time points, to study the kinetics of DDR pathway activation. While no major change was observed in the level of total ATM under DNA damaging conditions of 0.5 μmol/L Dox (compare Figures 1a and b), pATM showed induction starting at 0.5 h of Dox treatment and continuing further until the eight-hour time point (Figure 1b). Similarly, ATM substrates P53, Chk2 and E2F1 and their phosphorylated forms showed a time-dependent induction after Dox treatment but with different kinetics, demonstrating a functional DDR pathway in the MCF10A cell line (Figure 1b).
Localization of ATM and its substrates upon DNA damage
We next wanted to see whether the induction of DDR proteins that we observed during cell cycle progression and under DNA damage also caused any localizational changes. MCF10A cells were grown on poly-L-lysine-coated coverslips and serum-starved for 48 h to synchronize them in G1 phase. Serum was added back and cells were allowed to grow for different time points and immunostained to study the intracellular localization changes of ATM, pATM, pP53 and E2F1 through the cell cycle. Consistent with previous reports, 27 ATM and its phosphorylated form were mostly localized in the nucleus and no detectable changes in their intracellular localization were observed. However, while there was always some cytosolic ATM present (especially in serum-starved cells and at 0.5 and 1 h after serum stimulation), pATM was strictly localized in the nucleus.
Furthermore, in the untreated cells, nuclear ATM was greatly reduced in serum-starved cells and recovered after serum addition in a time-dependent manner. Hence, the changes that we observed in the levels of total and phospho ATM through the cell cycle in Western blots (Figure 1a) appeared to have taken place in the nuclear fraction of these proteins (Figure 2a). pP53 mostly had nuclear localization at all time points and appeared to co-localize with pATM, suggesting that in the absence of DNA damage, P53 may be maintained in a phosphorylated state by ATM. The E2F family of transcription factors are known to be mostly nuclear, with some reports suggesting cell cycle dependent localization and continuous shuttling between the nucleus and cytoplasm.
37
We saw a distinct increase in nuclear and cytoplasmic E2F1 during cell cycle progression after serum release (Figure 2a). The nuclear fraction of E2F1 increased to a greater extent than the cytoplasmic fraction. Total ATM expression and localization in DNA damaging conditions of 0.5 μmol/L Dox for different time periods (Figure 2b) exhibited no significant change when compared with the untreated controls (Figure 2a). The rise in nuclear ATM after the 1.5-h time point in the untreated controls also remained unchanged after DNA damage (Figure 2b). As expected, pATM concentrations increased at 0.5 h of Dox treatment and this induction correlated with that of pP53. A remarkable increase in nuclear E2F1 concentrations was observed most prominently at the three-hour time point of Dox treatment, continuing thereafter. To rule out any antibody-specific effects in our immunocytochemical studies, the experiments were also repeated with an antibody from a different source (data not shown).
Phospho-ATM serine-1981 (pATM) and ATM downstream substrates are upregulated during cell cycle progression and after DNA damage. (a) The levels of total ATM, pATM S-1981 and pP53 S-15 change slightly while total E2F1 increases significantly as cells are released from serum starvation into the cell cycle. Cells were grown on poly-
ATM protein concentrations oscillate after inhibition of its kinase activity
We next used a specific, small molecular inhibitor of ATM, KU55933 (KU),
38
to study its effects on ATM kinase in a time-dependent manner and to determine if the ATM protein concentration is influenced by its own kinase activity. It has been shown that KU inhibits ATM in vitro but not related kinases such as ATR (ataxia telangiectasia mutated Rad3 related) and DNA-dependent protein kinase (DNA-PK).
38
Unsynchronized MCF-10A cells were exposed to 10 μmol/L KU alone, or with the addition of Dox for relevant time points (Figure 3). Surprisingly, it was found that at 0.5 h post KU treatment, total ATM concentrations showed a three-fold (P < 0.001) induction as compared with the untreated controls. With KU and Dox treatment, there was still a significant rise in protein concentrations (P < 0.01). Immunofluorescence studies on non-synchronous MCF10A cells confirmed that both nuclear and cytoplasmic ATM exhibited a rise at this time point as compared with their untreated control counterparts (Figure 4a). At further time points, the protein concentrations remained low but with an oscillatory pattern between different time points (Figure 3).
Total ATM concentrations undergo an induction followed by oscillation after inhibition of its kinase activity. Cell lysates from unsynchronized cells acquired after treatment with either 10 μmol/L KU (KU55933) alone or 0.5 μmol/L doxorubicin (Dox) plus 10 μmol/L KU for different time periods are blotted for total ATM, pATM S-1981, total P53, total E2F1 and pATR S-428. Graph shows the integrated optical densitometry values of Western blot results. Data presented in all panels are the mean with standard error (bars) of n = 3 independent experiments with statistical significance calculated according to the scale (*P < 0.05, **P < 0.01, ***P < 0.001) KU55933 (KU)-induced ATM upregulation is accompanied by an increase in pATM and E2F1 concentrations. Immunostaining of total ATM, pATM S-15 and E2F1 was performed after treatment of cells with either 10 μmol/L KU or 10 μmol/L KU plus 0.5 μmol/L doxorubicin (Dox) for different time periods as indicated. These are representative images taken in different fields of view under ×40 objective. (A color version of this figure is available in the online journal)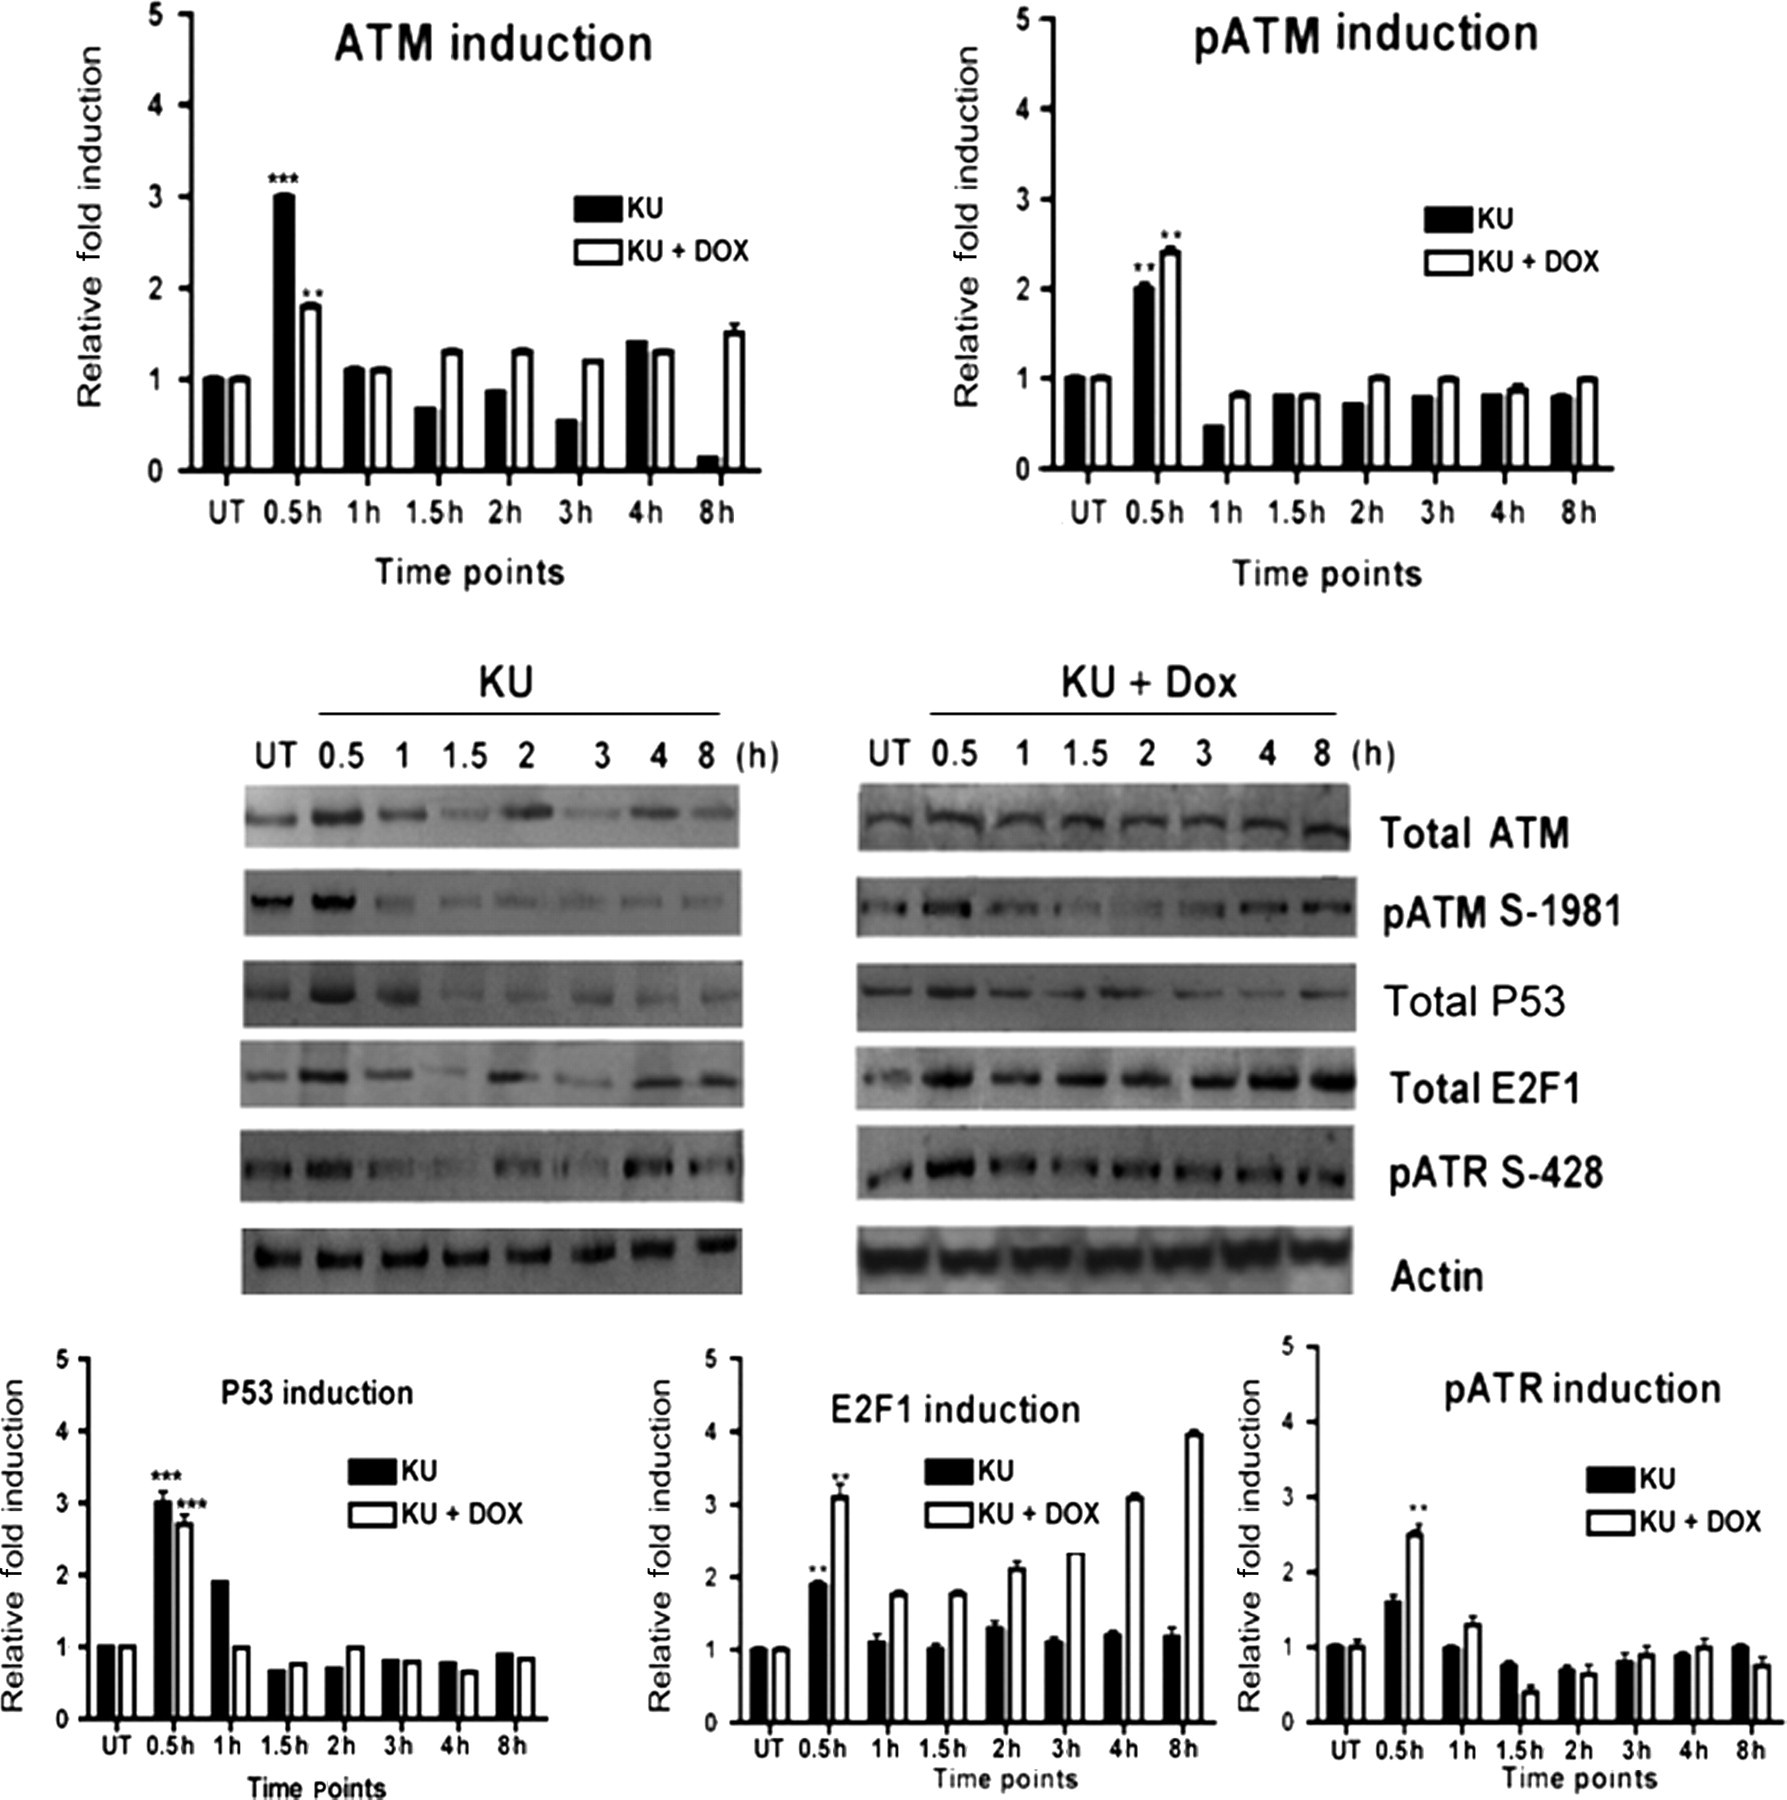

Oscillation of ATM protein impacts downstream signalling
In order to further study if ATM kinase inhibition-induced ATM induction followed by oscillation has an impact on the ATM pathway, unsynchronized MCF10A cells were subjected to either 10 μmol/L KU alone or KU plus 0.5 μmol/L Dox for relevant time points. Immunoblotting of protein lysates obtained from the treated cells revealed that pATM, as well as p53, E2F1 and pATR, showed induction at the 0.5 h time point after either KU or KU plus Dox treatment (p53 P < 0.001, E2F1 P < 0.01, pATR P < 0.01), as compared with the untreated controls (Figure 3). Levels of pATM were lower compared with untreated controls at all time points apart from at 0.5 h. The E2F1 signal, which also showed an initial induction at the 0.5 h time point followed by reduction at 1 and 1.5 h post-treatment, continued to increase after two hours of KU and Dox treatment, demonstrating an ATM-independent increase at later time points (Figure 3). For further characterization of this upregulation, immunocytochemical studies were performed which showed that at 0.5 h after KU alone or KU and Dox treatment, there was a noticeable upregulation only in the nuclear fraction of E2F1 (Figure 4). Similar to the Western blot results, there was a reduction in E2F1 concentrations at 1 and 1.5 h treatment followed by a rise at two hours post-treatment in KU and Dox treated cells (compare Figures 3 and 4). However, in the case of treatment with KU only, a sustained lower level of E2F1 after the initial spike at the 0.5 h time point was seen. These results are in agreement with our immunoblotting results from the lysates collected as nuclear (Nuc) and cytoplasmic (Cyt) fractions at the same time points (Figure 5). The quality of these subcellular protein lysates was assessed by slot blot analysis for known subcellular protein markers (Supplementary Figure 1). For all supplementary figures, please see KU55933 (KU)-induced ATM upregulation is accompanied by nuclear induction of E2F1. Cells were treated with either 10 μmol/L KU alone or 0.5 μmol/L doxorubicin (Dox) plus 10 μmol/L KU for different time periods as indicated. Cell lysates were acquired and nuclear (Nuc) and cytoplasmic (Cyt) protein fractions were prepared as described in the Materials and methods section and blotted for pATM S-1981 and total E2F1. The quality of subcellular fractions was determined by blotting for Rb (nuclear protein) and actin (cytoplasmic protein) shown in Supplementary Figure 1. Semiquantitative analysis of the data presented in all panels are the mean with standard error (bars) of n = 3 independent experiments
ATM protein induction after inhibition of its kinase activity results from alteration of its transcriptional regulation
First, to examine whether KU-induced ATM oscillation resulted from alteration in protein stability, we looked at any changes in ATM protein stability upon DNA damage or inhibition of ATM kinase. We did not find any difference in the protein stability of ATM with any treatment, and all the samples underwent a reduction in protein concentrations at the same rate after CHX treatment (Supplementary Figure 3). Next, to study the transcriptional regulation of ATM under different conditions and the basis for the oscillatory behaviour of ATM protein after 0.5 h KU treatment, we cloned the ATM promoter region (ATMpr) as described earlier
32
in a luciferase reporter vector, PGL-3 basic (ATMpr/PGL-3), as well as a fluorescence reporter P-Timer1 (ATMpr/P-Timer1), for determining ATMpr activity. Previously, the ATMpr-based luciferase reporters have been employed to study different aspects of ATM regulation both in vivo and in vitro.
29,30,33,39
The P-Timer1 fluorescent reporter uses a mutant form of Ds Red fluorophore, which has unique spectral properties shifting from early green fluorescence to red fluorescence depending on the protein maturation rate.
40
Hence, this fluorophore, expressed under the control of the ATM promoter, was tested for the efficiency in promoter activity after KU treatment. Transfected MCF10A cells with either empty vector or ATMpr/PGL3 were treated with either 0.5 μmol/L Dox, 10 μmol/L KU or both Dox and KU for relevant time points (Figure 6). Treatment with Dox resulted in a decrease in the promoter signal at 0.25 h followed by recovery to untreated levels, with no significant changes at all the other time points in the ATMpr/PGL3 luciferase reporter assay, consistent with our Western blot results (Figure 1b). Remarkably, after KU treatment, >4-fold induction (P < 0.001), while with KU and Dox treatment, up to two-fold induction (P < 0.01) were observed in the promoter signal at 0.25 h post-treatment (Figure 6). Exposure of the cells to KU alone also resulted in an oscillatory signal after the initial spike at 0.25 h post-treatment, and the values of this oscillation were fluctuating around those of the untreated cells. In the ATMpr/P-Timer1 reporter, after 0.5 h of KU addition, we found an almost four-fold increase (P < 0.001) reported through green fluorescence, with the red fluorescence still moderate at about half the fluorescence of green, suggesting a recent induction in transcription in ATMpr/Ptimer1-expressing cells (Figures 7a and b). Moreover, at the two-hour time point, there was an increased red fluorescence signal and a reduced green fluorescence signal, suggesting a halt in transcription and the pre-existing green fluorophore maturing into red (Figure 7a). At the four-hour time point, the green fluorescence signal appeared to have recovered to a higher intensity which equalled that of the red, suggesting a steady-state expression (Figure 7b).
ATM undergoes a transcriptional upregulation after treatment with its kinase inhibitor. Exponentially growing MCF10A cells were transfected with either empty PGL3 basic vector or 1 μg PGL3 basic vector containing ATM promoter sequence (ATMpr). In total, 0.2 μg pRL-CMV plasmid was used to detect luciferase activity as an internal control, as described in the Materials and methods section. At 24 h post-transfection, cells were either left untreated, or treated with 0.5 μmol/L doxorubicin (Dox) or 10 μmol/L KU (KU55933) or both for different time periods as indicated. After the treatments, lysates were prepared and luciferase activity was analyzed by a dual luciferase reporter assay kit (Promega). Data are the means and standard error (bars) of n = 3 independent experiments performed in octuplets with statistical significance calculated according to the scale (*P < 0.05, **P < 0.01, ***P < 0.001) Timing fluorescent reporter assay for ATM promoter. (a) Exponentially growing MCF10 cells were grown on poly-

The overall pattern of ATMpr oscillation after KU treatment was consistent in both types of promoter reporter assays (Figures 6 and 7), and with the previous Western blot results (Figure 3). Hence, it is concluded that the KU-induced upregulation of ATM after inhibition of its kinase activity is governed at a transcriptional level and may involve an autoregulatory negative feedback loop affecting its own expression and activity.
Discussion
In this study, we looked at important aspects of ATM expression, activity and subcellular localization in a cell cycle dependent and independent manner under normal and DNA damaging conditions. We found that ATM concentrations slightly changed at particular time points after serum stimulation, most notably at 0.5 and four hours postserum addition. This increase in the protein concentration was accompanied by a change in its activity (as determined by pATM concentrations). Immunolocalization of ATM and its DDR substrates exhibited no significant difference under normal and damaging conditions. However, there was a marked increase in the levels of nuclear pATM, E2F1 and pP53 after DNA damage.
We found that inhibition of ATM kinase activity by a small molecular inhibitor, KU, resulted in an induction followed by oscillation of total ATM. The initial induction is indicative of an autoregulatory mode of ATM regulation independent of the cell cycle. This suggests that an equilibrium may exist between ATM activity and the amount of ATM expressed and that ATM enzymatic activity may monitor its own expression levels under normal conditions. With the addition of KU, this equilibrium would be disturbed, resulting in oscillation, as observed in our study. Interestingly, the rise in ATM concentrations at 0.5 h post KU treatment also resulted in a rise in pATM concentrations, which may suggest that the upregulated fraction of ATM is kinase active. This result is explained by the fact that the kinase inhibitor, KU, used in this study, is a reversible small molecular inhibitor which binds to the ATP binding pocket of ATM, blocking its kinase function. At 10 μmol/L KU concentration, most of the pre-existing ATM molecules are blocked and stop signalling. However, any de novo synthesis of ATM protein, e.g. at 0.5 h KU induction, would be in a free state and may exceed the number of KU molecules in the cell, hence restoring its role in DDR signalling. Therefore, the kinase inhibition-induced upregulated fraction of ATM may be free from KU, and therefore functional, and able to induce a temporary DDR by activating its substrates. E2F1 and P53, which are known to regulate ATM transcription by directly binding to its promoter, 39,41 and ATR, which was previously demonstrated to have a functional link with ATM, 39,42 showed transient induction after treatment with KU in a cell-cycle-independent manner. In terms of ATR activity, a previous study has shown its dependence on ATM in a cell-cycle-dependent manner. 42 However, here, we show a cell-cycle-independent upregulation upon ATM kinase inhibition, which may be a different mechanism of dependence on ATM. This may imply that any higher concentration of KU, sufficient to inhibit all the molecules of ATM kinase, may still not completely prevent a downstream DDR signal because of pATR induction. The fact that this ATM autoregulation points toward a negative feedback loop between its activity and expression is also supported by the observation that the activation of ATM kinase after DNA damage caused a reduction in the total ATM concentrations at 0.5 h post-treatment (Figures 1b and 6).
E2F1, which can directly bind the ATM promoter and upregulate it
41
and P53, known to be a negative regulator of ATM,
39
may participate in this ATM autoregulation. This proposed mechanism is illustrated in Figure 8. First, KU-induced ATM inhibition will cause deactivation of P53 transcription
43
and decrease constitutive P53 activity. This will be followed by a reduction in the CIP/KIP family p21 and p27, which otherwise mediate the RB-induced check on E2F1 transcriptional activities.
44
As a result, ATM induction following inhibition of its kinase activity will occur via two mechanisms. One is the deactivation of P53, which is otherwise a negative regulator of ATM, and the second is the release of E2F1, which is known to upregulate ATM. On the other hand, increased E2F1 above a certain level itself can cause P53 activation at the protein concentration
45
or transcriptionally by binding to the p53 promoter.
46
This may explain the reason for the reduction in initial ATM induction post 0.5 h. Hence, ATM may maintain a balance between its expression and activity by modulating E2F1 and P53 function under normal conditions, which is disturbed by inhibiting its kinase activity. While this could be a possible explanation, further insights into this mechanism could be provided by studying this phenomenon in P53 or E2F1 null cell lines. Involvement of DDR kinase in its negative autoregulation via P53 has also been described earlier for Chk1.
47
Proposed scheme of ATM regulation under damage or kinase inhibition. Lines with arrow heads indicate transcriptional upregulation while lines with bars indicate transcriptional repression. Red line with bar head indicates kinase inhibition via KU (KU55933). Blue lines with arrowhead indicate translation. Dotted lines with arrowheads indicate phosphorylational activation while dotted lines with bar heads indicate inactivation. Dotted lines with arrows or bar heads with ‘X’ denote disruption of that signal while two arrows or two bar headed lines indicate enhancement of that signal. (a) Under a normal (undamaged) state, stable constitutive ATM expression is maintained by the activities of P53 and E2F1 transcription factors, which repress or induce ATM expression respectively. (b) Under a ATM kinase inhibition, the ATM stops signalling to P53, which loses its transcriptional potential and thus ATM is released from the transcriptional repression of P53. Also, decreased P53 stability no longer keeps the ATM transcription activator, E2F1 in the RB-check, which will bind to ATM promoter and induce ATM expression, evident after KU-mediated ATM kinase inhibition. (c) Under a DNA damage condition, ATM kinase is activated, which rapidly stabilizes P53 which in turn will not only cause E2F1 block via the Rb pathway, thus preventing E2F1 binding to the ATM promoter, but also bind directly to the ATM promoter and repress it, as evident in the doxorubicin (Dox)-mediated downregulation of ATM. States B and C are both temporary and will ultimately restore to normal state A, as excess E2F1 as in state B, itself is a positive regulator of P53 which will balance the system back to state A, while excess damage in state C can cause ATM to phosphorylate and stabilize E2F1, which will abrogate the ATM repression by P53 and hence bring the pathway back to state A. (A color version of this figure is available in the online journal)
The ATMpr-PGL3 and ATMpr/Ptimer-1 confirmed KU-induced upregulation of the promoter activity in MCF10A. The response of ATMpr to KU treatment in cell lines such as MCF7 and HaCat transfected with ATMpr-PGL3 has shown a similar induction of the promoter signal upon ATM kinase inhibition (Figure 9). While in HaCat and other skin cell lines, ATM is reported to be expressed and regulated differently,
48
we showed that in these cell lines, ATM underwent induction in its transcription following ATM kinase inhibition in a similar manner as well, and at exactly the same time point (Figure 9). These results in multiple cell lines suggest that this novel phenomenon is conserved and is independent of constitutive expression levels of ATM and the cell type. In addition, the data obtained using ATMpr as a reporter demonstrate its potential use as a tool in screening for small molecular inhibitors that target ATM kinase specifically, both in normal and cancer scenarios.
ATMpr (ATM promoter region) induction in HaCat and MCF7 cell lines following KU treatments. Exponentially growing MCF-7 and HaCat cells were transfected with either empty PGL3 basic vector, or with 1 μg PGL3 basic vector containing ATMpr. In total, 0.2 μg pRL-CMV plasmid was transfected as an internal control to detect luciferase activity, as described in the Materials and methods section. At 24 h post-transfection, cells were either left untreated, or treated 10 μmol/L KU for different time periods as indicated. After the treatments, lysates were prepared and luciferase activity was analyzed by dual luciferase reporter assay kit (Promega). Data are the means and standard error (bars) of n = 3 independent experiments performed in octuplets with statistical significance calculated according to the scale (*P < 0.05, **P < 0.01, ***P < 0.001).
This study addresses one of the major challenges for cancer biologists in identifying and targeting key survival pathways in cancer cells that could provide selectivity against them. While this is a challenging task owing to the complexity in responses generated by different types of cancers, age and in different settings, 49,50 taking a systems biology approach to study these complex molecular networks and key differences between normal and cancer cells can help researchers to identify novel pathways and novel drug targets as well as better use of combinations of existing drugs. 49,51,52
Conclusion
It is now known that an increased sensitivity of cancer cells toward genotoxic agents could be achieved by inhibiting the DDR proteins implicated in the G2/M checkpoint, e.g. via inhibition of ATM kinase. 53 This forms the rationale of targeting DNA damage response proteins for therapeutic intervention in cancer. This study clearly indicates that inhibition of the ATM kinase activity leads to upregulation of the ATM protein, giving rise to a temporary peak in its activity accompanied by induction in P53, pATR and E2F1. This temporary increase in DDR activity may hinder the therapeutic effect of G2/M checkpoint abrogation, providing an opportunity to repair the DNA in cancer cells. A luciferase reporter assay of the promoter of ATM not only established a transcriptional basis for this change but also demonstrated the precise timing of this upregulation followed by oscillation in the ATM concentrations after its inhibition. This particular oscillation pattern might differ in its timing and regulation in different types of cancers. However, the novel information in this study could be used to time the chemotherapy or radiotherapy treatments to precise time points after ATM inhibition, when the ATM concentrations are at their lowest, hence allowing a better therapeutic intervention.
Footnotes
ACKNOWLEDGEMENTS
The authors thank Northwood charitable trust for their support in the study. The authors also acknowledge Professor John Palfreyman Head of School, University of Abertay Dundee for his kind support during this study.