
Abstract
Neurotoxic properties of manganese (Mn) are well documented. It is less known that Mn contributes to the development of neurodegenerative disorders in the general population. This study presents Mn data from patients with amyotrophic lateral sclerosis (ALS) in a well-defined cohort diagnosed by electrophysiological methods. Cerebrospinal fluid (CSF) and plasma were collected from patients and controls. Mn concentrations were analyzed by high-resolution inductively coupled plasma mass spectrometry. Concentrations of Mn were significantly higher in ALS CSF (median 5.67 μg/L) than in CSF from controls (median 2.08 μg/L). Also, ALS CSF Mn concentrations were higher than ALS plasma Mn concentrations (median 0.91 μg/L), suggesting transport of Mn into the central nervous system. The properties of barrier systems between blood and the brain are discussed and the possibility of Mn accumulation contributing to the relentless course of ALS is introduced.
Introduction
Amyotrophic lateral sclerosis (ALS) is a disorder of the nervous system characterized by degeneration of motor neurons in the spinal cord, brain and brainstem. Proposed mechanisms for nerve cell degeneration in ALS include genetic, viral, metabolic and toxic mechanisms 1–3 and disturbed neurotransmitter function.
Manganese (Mn) in trace quantities is essential for proper nerve cell function. However, Mn in higher concentrations is neurotoxic. 4 An increased incidence of ALS is reported in areas with high concentrations of Mn in drinking water and soil. 5 Mn as a causative agent in the pathogenesis of such endemic ALS has been suggested. 5
Different compartments in the human body, including the cerebrospinal fluid (CSF), receive various contributions of metal ions from external sources. The nervous system is partially protected from such exposure by the blood–brain barrier (BBB) and the blood–CSF barrier. 6–8 In situations of impaired barrier function, or overload of metal, a significant increase of metal might be found within the nervous system. Basun et al. 9 reported in a group of demented subjects a Mn concentration in CSF of 6 μg/L. Kapaki et al. 10 noted among 28 ALS patients a CSF Mn concentration of 3.5 μg/L. These concentration levels are higher than CSF Mn concentrations found in normal individulas. 11 By comparing concentrations of Mn in CSF with concentrations in plasma, properties of the barrier systems can be investigated. 12 Mn-CSF can be expected to reflect a more extended time frame than Mn-plasma, showing a higher turnover than CSF.
Aware of Mn neurotoxicity, we decided to investigate whether Mn concentrations in CSF and simultaneously sampled plasma from ALS patients differ from those of controls. The results may indicate a possible relationship between Mn occurrence in body fluids and neurotoxic effects in ALS patients. The study was performed with modern sampling techniques and advanced metal analysis technology.
Materials and methods
Population
Consecutive patients referred for electrophysiological investigations under the suspicion of ALS were recruited for the study. Patients meeting the World Federation of Neurology (WFN) criteria for definite diagnoses of ALS 13 were included. Quantitative electromyographic studies were performed twice and showed positive sharp waves as well as fibrillation potentials indicating denervation 14 in a pattern consistent with the diagnosis of ALS in each included case. Every patient was investigated at separate occasions independently by two experienced neurologists before the final diagnosis. Each patient was followed for two years or more to secure clinical progression. Nerve conduction studies excluded other causes of denervation, e.g. polyneuropathy. Seventeen ALS cases and 10 controls were recruited.
Spouses or friends of ALS patients, medical students or outpatients at the neurological clinic who had planned lumbar punctures, served as controls. The outpatients had minor complaints such as transient headache or numbness or worries about their illness. Blood parameters and CSF albumin, CSF total protein, CSF glucose and standard CSF-electrophoresis were normal in this category. Controls were followed for at least two years for unexpected exacerbations and no such events occurred.
Clinical characteristics of the amyotrophic lateral sclerosis patients controls
The rows Indication describe the reason why spinal tap and electromyography was performed. The rows Age show age at date of sampling
F, female; M, male
Sampling
Spinal tap was performed in the supine position from lumbar levels using a standard 0.9 × 88 mm Spirocan syringe (B Braun Melsungen AG, Melsungen, Germany). The skin was washed five times with clear 4% chlorhexidine gluconate in ethanol (Fresnius Kabi Norge AS, Oslo, Norway) prior to spinal tap. CSF was collected in 1 mL aliquots into polypropylene CryoTubes (Nunc, Roskilde, Denmark) with a stopper and silicone gasket rinsed twice with ultrapure water (Elga purification system, Elga LabWater, High Wycombe, UK). The first milliliter of CSF was discarded. Punctuation bleeding was checked for by visual inspection.
Blood was collected from an antecubital vein immediately after the spinal tap, using a 21G needle and 7.5 mL lithium-heparin polypropylene tubes dedicated for metal analysis (Sarstedt S Monovette System, Sarstedt AG, Nümbrecht, Germany). After centrifugation at 3000 rpm for 10 min, aliquots of 1.5 mL plasma were transferred with a clean plastic pipette to CryoTubes rinsed three times with ultrapure water in a whirl mixer. The paired samples of CSF and plasma were frozen at −18°C and then stored at −86°C until further analysis. To avoid contamination from external sources, enhanced cleanliness routines were adopted for the sampling room, equipment, bed and patients. Thorough hand washing was performed. Gloves were not used.
Neurophysiologic evaluations
Electrodiagnostic evaluations were performed to confirm the clinical suspicion of ALS and exclude possible differential diagnoses such as polymyositis or polyneuropathy. Procedures included quantitative electromyography with a concentric needle electrode and neurography with surface electrodes. Motor unit potentials were examined for stability as well as amplitude, duration and complexity of the signal. Fibrillation potentials and positive sharp waves were recorded and documented. Fasciculation potentials were recorded and evaluated for complexity and stability. Sensory nerve conduction studies included orthodromic conduction from fingers to wrist for the ulnar and median nerves and antidromic conduction from below the knee to the lateral malleolus for the sural nerves. Motor nerve conduction in the median, ulnar, radial, tibial and peroneal nerves was studied using routine methods. The temperature was measured and kept above 29°C in the upper extremity and 27°C in the lower extremity. A keypoint electrodiagnostic system was used. The included patients met the WFN criteria for definite ALS.
Metal analysis
Prior to trace element analysis, all samples were digested by adding 1.0 mL concentrated HNO3 (Scanpure, Chemscan, Elverum, Norway). Digestion was performed using a block heater (110°C, 1 h) or a high-pressure microwave-based system (Milestone UltraCLAVE, Leutkirch, Germany). After digestion, samples were diluted with ultrapure water (Elga) to a final acid concentration of 0.6 mol/L. CSF and plasma samples were analyzed for Mn with high-resolution inductively coupled plasma mass spectrometry (HR-ICP-MS), using a Finnegan Element 2 instrument (Bremen, Germany). The radio frequency power was 1250 W. Samples were introduced using a CETAC ASX 500 autosampler (Omaha, NE, USA) and a peristaltic pump (1 mL/min). The instrument was equipped with a concentric Meinhard nebulizer (Golden, CO, USA) connected to a Scott polyfluoroalkoxy spray chamber (PerkinElmer, Waltham, MA, USA), platinum interface cones and a quartz burner with a guard electrode. The instrument was calibrated using 0.6 mol/L HNO3 solutions of matrix-matched multielement standards. Details of the analytical methods have been previously described. 15
Quality control
For ultra-trace element analysis of clinical samples, controlling and minimizing all possible sources of contamination is vital. 16 Blank samples of ultrapure water with HNO3 were prepared using the same procedure as for the samples and analyzed to assess possible contamination. Five blanks were analyzed simultaneously with the samples. Mn concentrations in blanks were 0.270 ± 0.087 μg/L. Sample digestion using an UltraCLAVE high-pressure and microwave digestion system, and digestion by a heating block digestor was performed. Mn values for the two methods were compared with reference values. The accuracy of the method for trace element analysis was verified by separately analyzing the certified reference material Seronorm® Serum Level 1 (Sero, Billingstad, Norway). Comparisons with reference values for several metals have been previously presented. 15 For Mn, the certified value was 8.3 μg/L and the average measured value was 8.7 μg/L. The detection limit for Mn in this system is 0.176 μg/L and instrumental detection limit is 0.006 μg/L.
Statistics
The outcome variables, Mn concentrations in CSF and in plasma and the CSF/plasma ratio of Mn concentration, were dichotomized due to their heavy right-tailed distributions. Each variable was categorized, using the median value calculated from the combined values from cases and controls taken together (i.e. the overall median [OM] value). The median compared with the mean is not sensitive to outlying observations, and thus suitable for these data. 17 As a measure of effect, the proportion of the number above and below the overall median was calculated for each group. An exact 95% confidence interval (CI) was calculated and a hypothesis test for the difference in proportions was performed to compare ALS patients with controls for each outcome variable. The differences in proportions are presented as percentages in the result section. Graphs were prepared and analyses performed using the IBM SPSS statistics software (version 18.0; SPSS Inc., Chicago, IL, USA) and StatXact 7 (Cytel Software Corparation, Cambridge, MA, USA).
Results
Mn concentrations
CSF
A statistically significant difference in Mn concentrations was noted between the ALS patient group and the control group. The median Mn concentrations were 5.67 μg/L (range 1.40; 11.80 μg/L) in the ALS patients (n = 17) and 2.08 μg/L (range 0.58; 5.40 μg/L) in the control individuals (n = 10) (Table 2) (Figures 1 and 2).
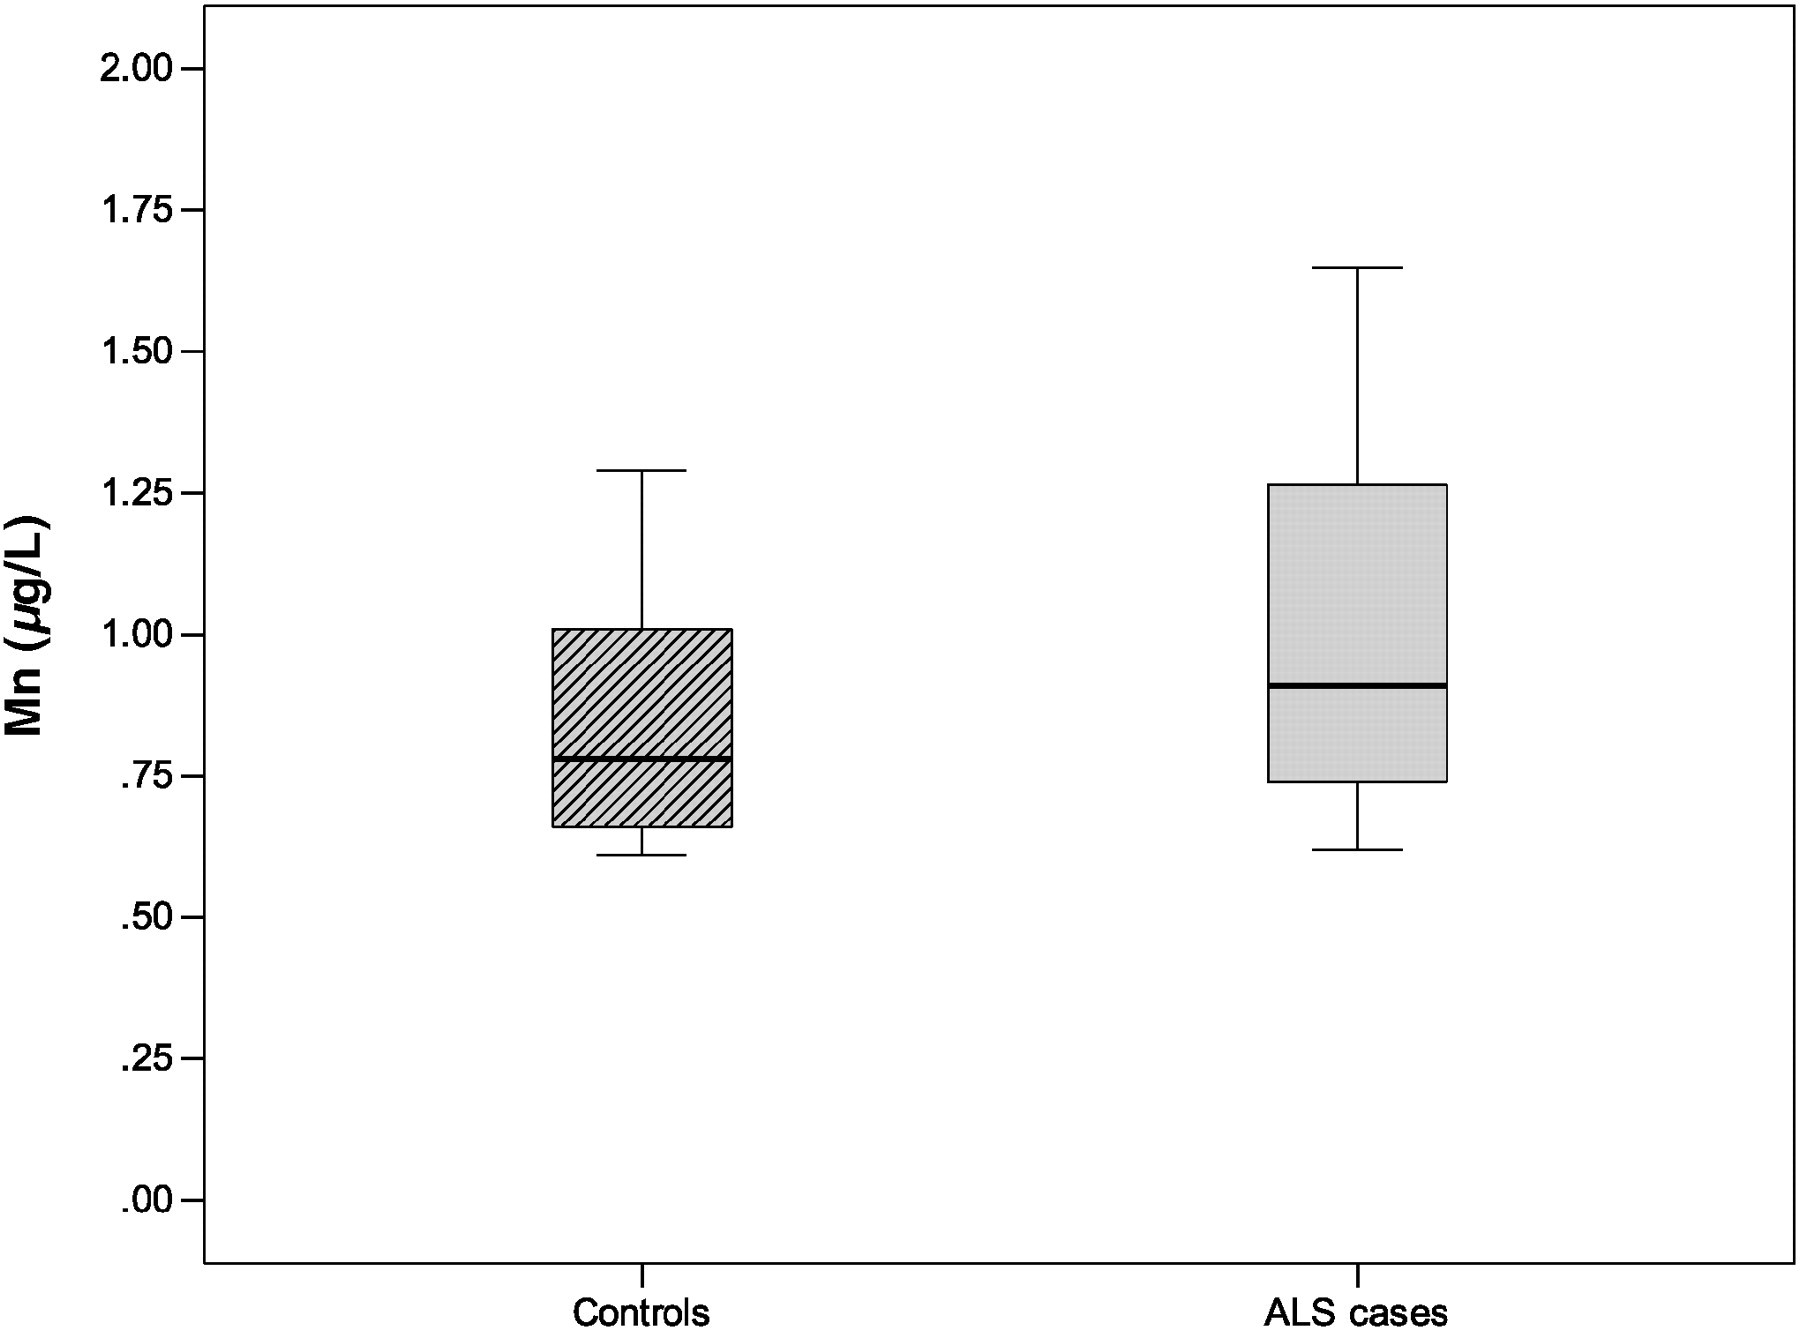
Box plots showing median concentrations of manganese (Mn) in cerebrospinal fluid from amyotrophic lateral sclerosis (ALS) patients and controls. One control outlier is marked with small circle and was omitted from the statistics. The whiskers represent the 25th and 75th percentiles, and the circles and stars represents outliers (1.5*interquartile range) and extreme values (3*interquartile range), respectively Box plots showing median concentrations of manganese (Mn) in plasma from amyotrophic lateral sclerosis (ALS) patients and controls. The whiskers represents the 25th and 75th percentiles, circles and stars represents outliers (1.5*interquartile range) and extreme values (3*interquartile range), respectively Distribution of CSF Mn concentrations (μg/L) Distribution of Mn concentrations in CSF from ALS patients and controls. Median values and 25th and 75th percentiles are depicted together with highest and lowest values CSF, cerebrospinal fluid; ALS, amyotrophic lateral sclerosis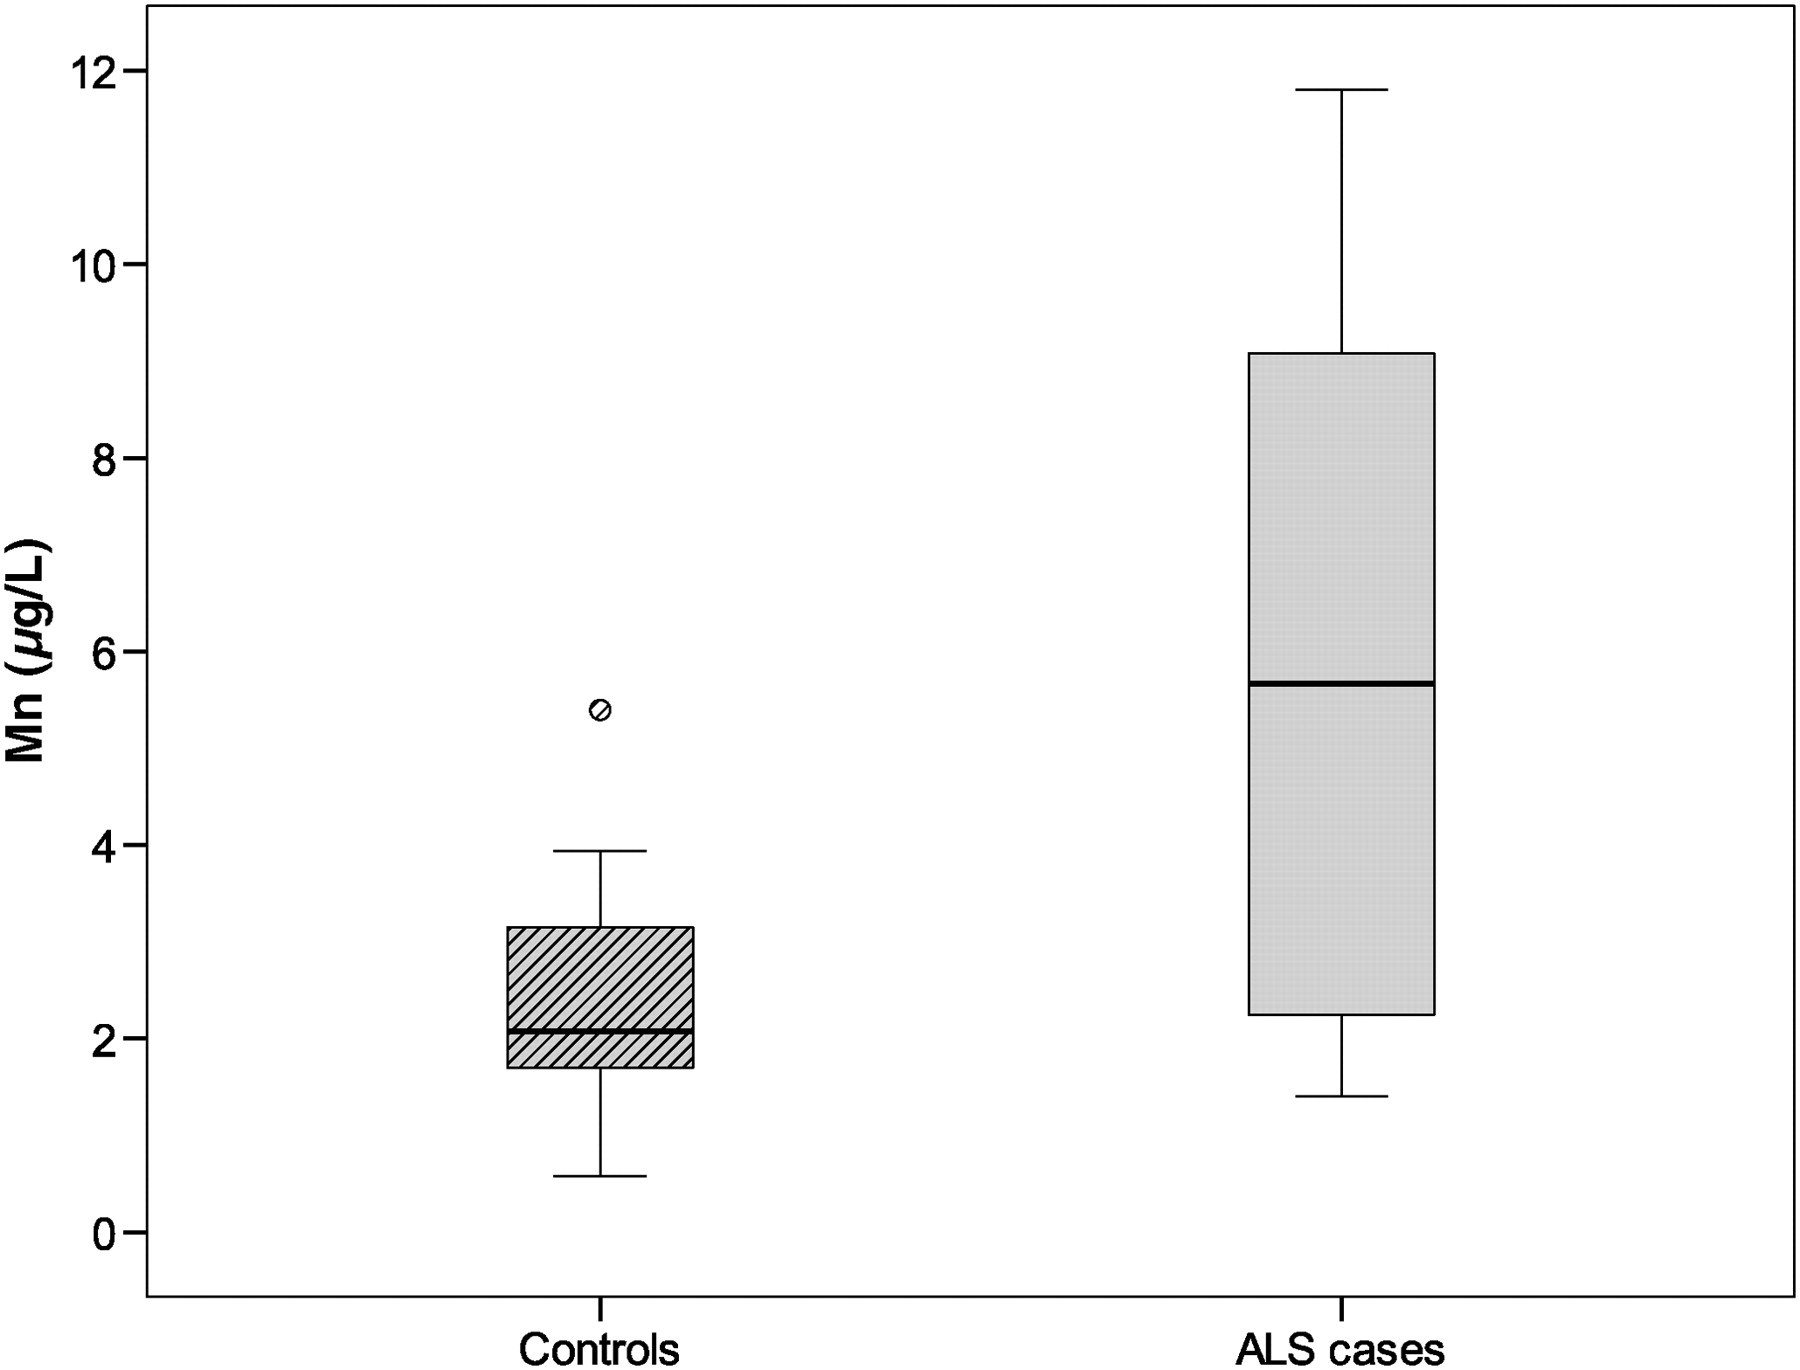
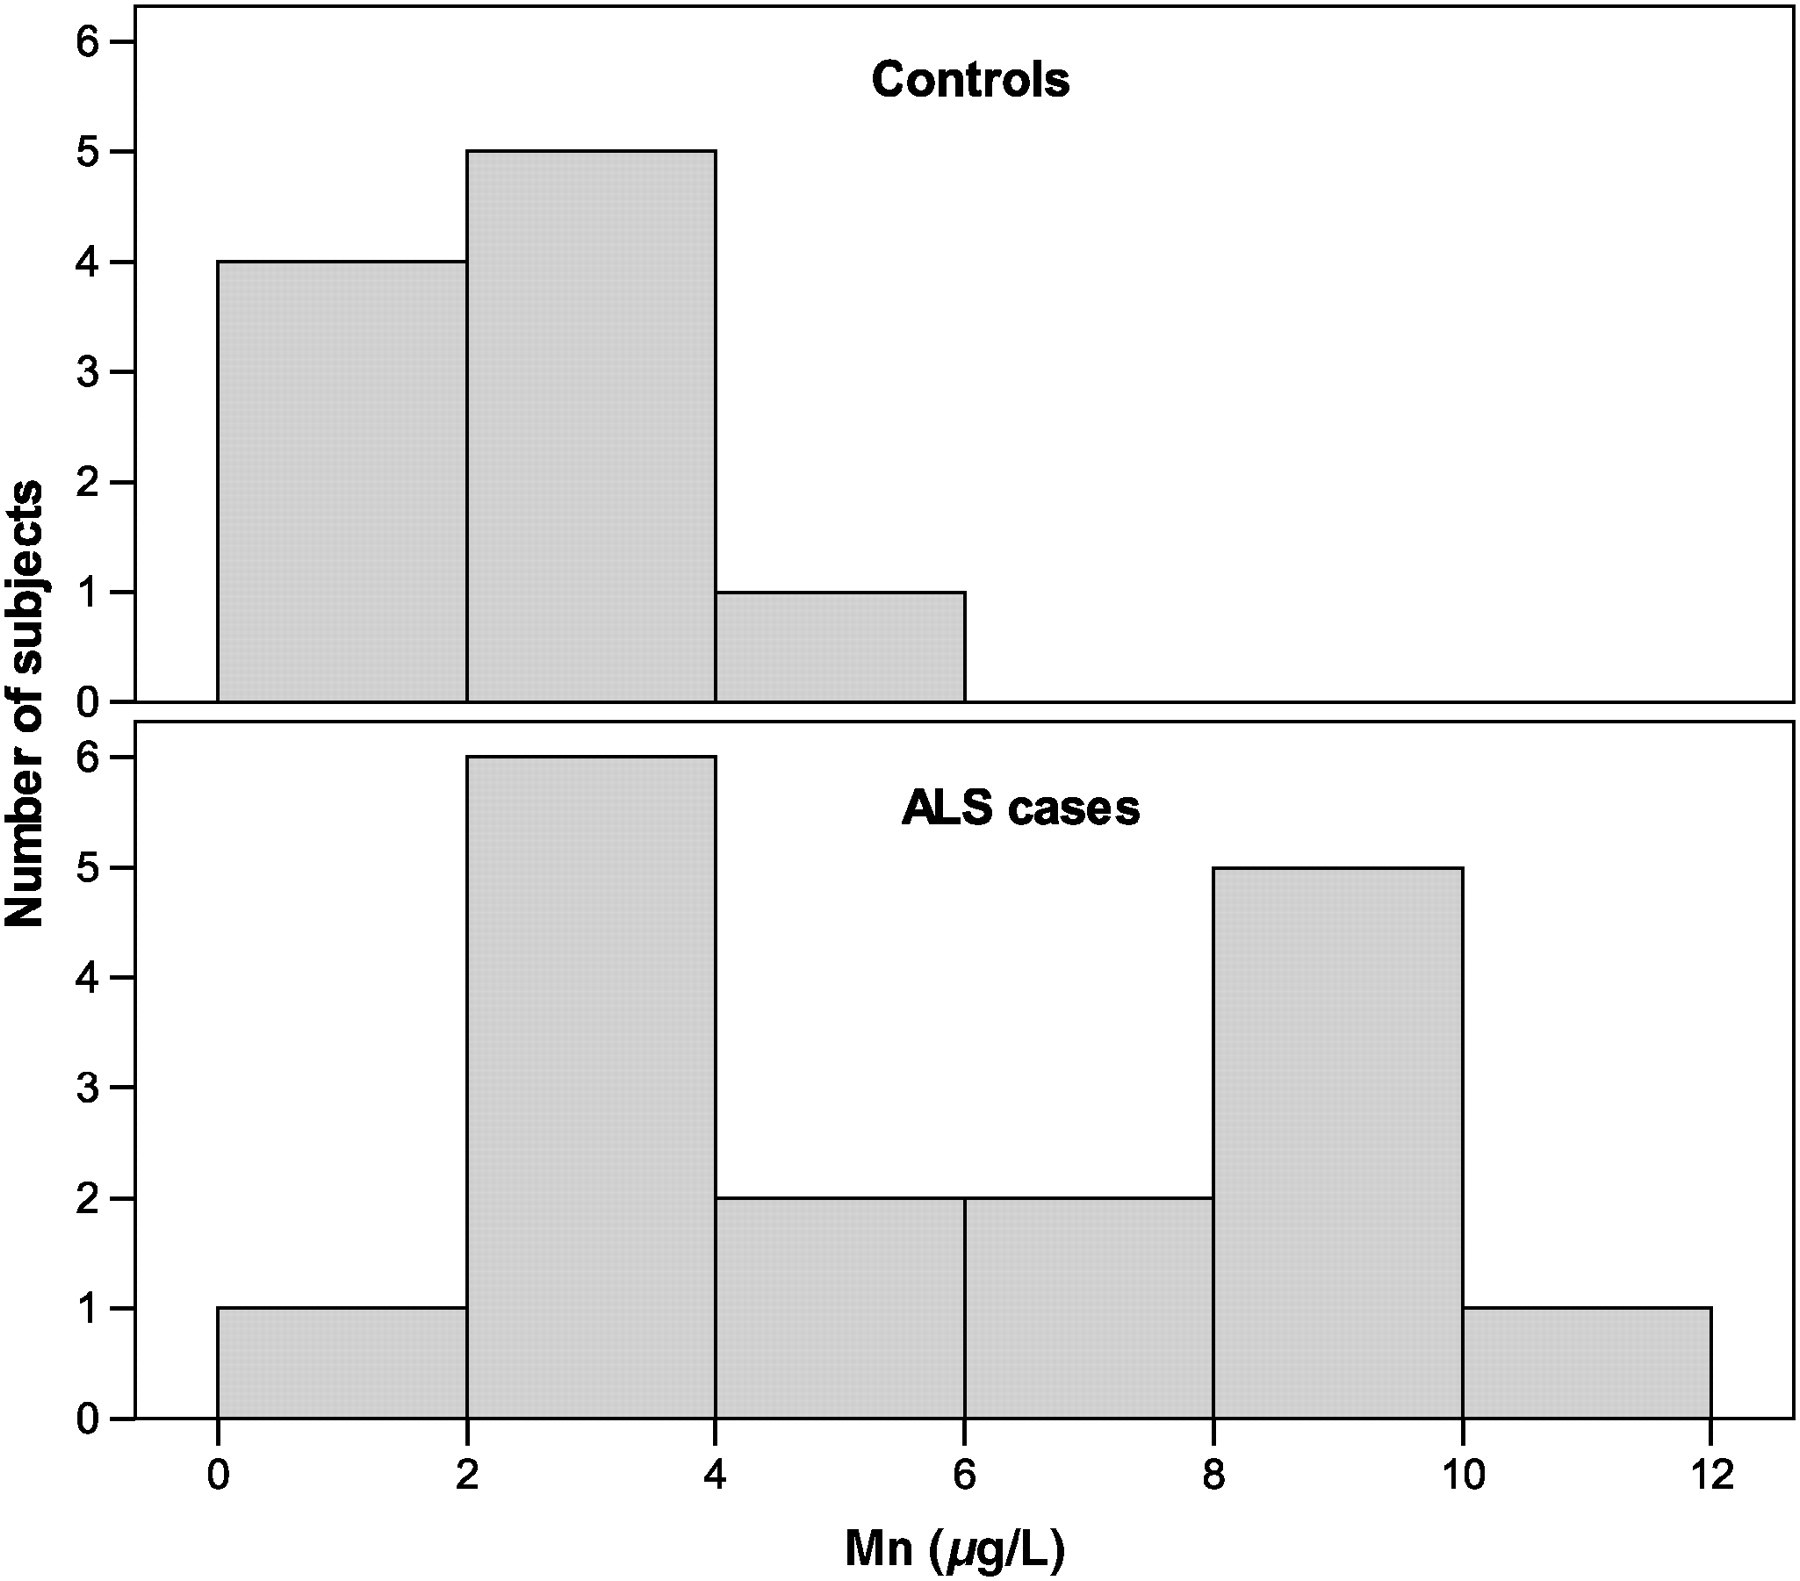
The number of individuals with CSF Mn values above the OM (3.5 μg/L) was 11 ALS patients (65%) and two control individuals (20%). The difference between ALS patients and controls in the proportion above the OM was 45% (95% CI [5; 71%], P = 0.031). The distribution of concentrations among cases seemed to separate in two groups, one with lower concentrations resembling the controls, and one group of higher concentrations, the highest being 11.8 μg/L (Figure 3). The higher concentrations were present in CSF from ALS cases (Figures 4 and 5).
Box plots showing median cerebrospinal fluid (CSF)/plasma ratio of concentrations of manganese from amyotrophic lateral sclerosis (ALS) patients and controls. The whiskers represent the 25th and 75th percentiles, and the circles and stars represents outliers (1.5*interquartile range) and extreme values (3*interquartile range), respectively Histograms showing distribution of manganese (Mn) concentrations (μg/L) in cerebrospinal fluid from amyotrophic lateral sclerosis (ALS) patients and controls Histograms showing distribution of cerebrospinal fluid (CSF)/plasma ratios for amyotrophic lateral sclerosis patients and controls. Values were calculated by dividing manganese concentration in CSF with the corresponding value in plasma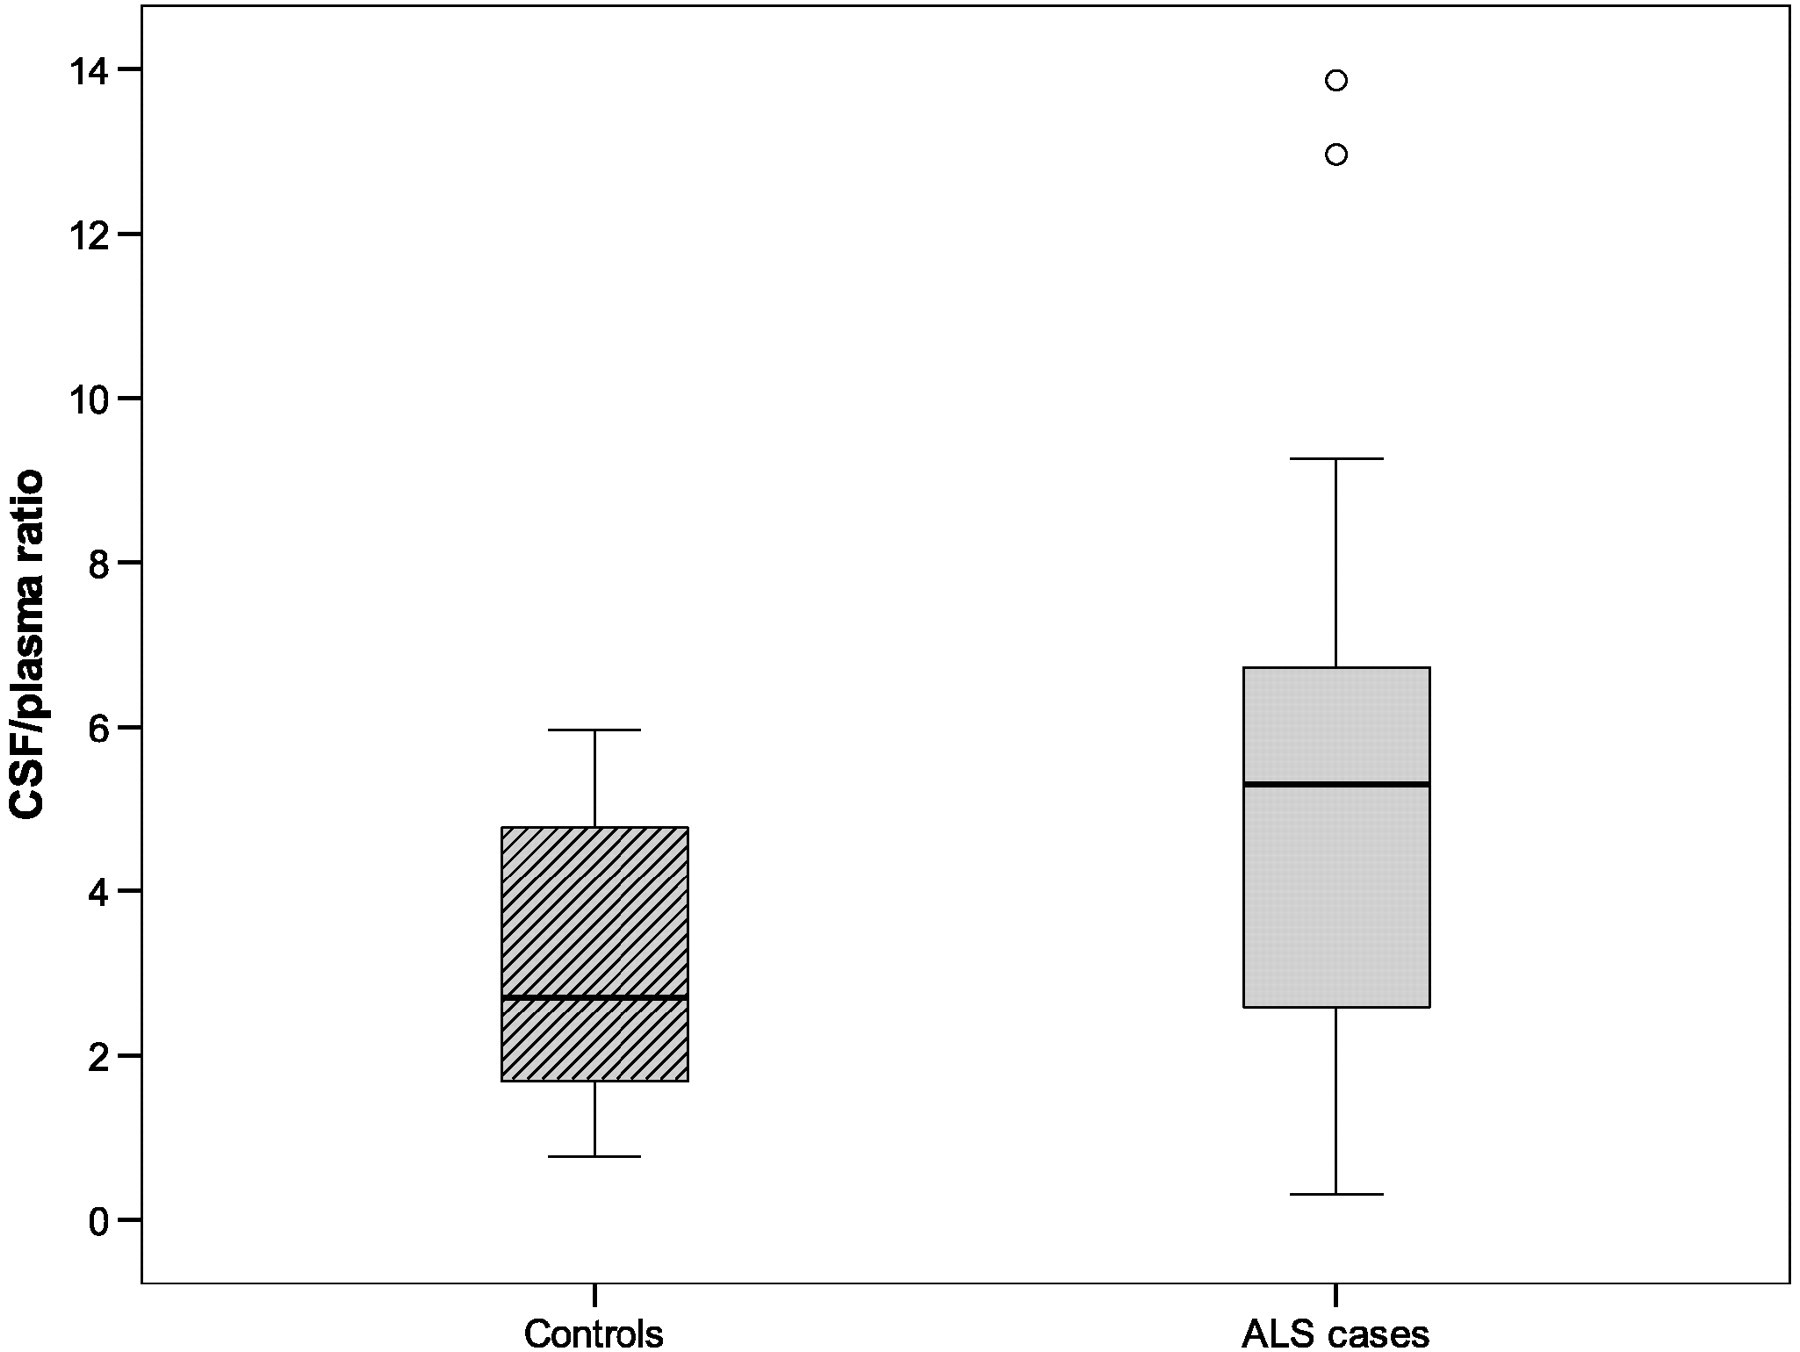

Manganese concentrations (μg/L) in CSF and blood plasma from ALS patients and controls sorted by age and gender
Average concentrations (in bold) in the three age segments ‘very old’, ‘middle aged’ and ‘young’ are given together with average concentrations for male and female individuals
ALS, amyotrophic lateral sclerosis; CSF, cerebrospinal fluid
Plasma
The median Mn plasma concentrations were 0.91 μg/L (range 0.62; 30.6 μg/L) in the ALS patients (n = 15) and 0.78 μg/L (range 0.61; 1.29 μg/L) in the controls (n = 9).
Manganese concentrations (μg/L) in CSF and blood plasma from ALS patients and controls
CSF values are divided by plasma values in the ‘ratio’ columns. Cases n = 17, controls n = 10
ALS, amyotrophic lateral sclerosis; CSF, cerebrospinal fluid
When sorted by age (Table 3), the average ALS plasma Mn concentrations were evenly distributed between age groups. The very old group showed higher plasma concentrations, although this was probably because of one outlier value (patient 7, Figure 3). Male individuals presented higher (4.0 μg/L) Mn concentrations than female individuals (0.8 μg/L). For controls, average concentrations were comparable between age groups and no gender differences were noted.
Mn CSF/plasma ratio
Simultaneously collected samples from CSF and plasma allow for comparison of concentrations of Mn outside of the BBB relative to the inside. The ratio was calculated by dividing the Mn concentration in CSF samples in μg/L by the concentration in the corresponding plasma sample (Tables 2 and 4). The median CSF/plasma ratio for ALS cases was 5.30 (n = 15) and for control individuals 2.37 (n = 9). CSF Mn concentrations were mostly higher than plasma concentrations, both in ALS cases and in controls. Individuals with high CSF concentrations also had high plasma concentrations (Tables 2 and 4). There were nine ALS patients (60%) and three controls (33%) above the OM (4.08 μg/L). The observed difference between ALS and controls, in the proportion above the OM, was 27% (95% CI [−16; 59%], P = 0.242). The higher ratios were ALS cases with concentrations unevenly distributed up to 13.86 μg/L.
When sorted by age (Table 3), the highest average ALS CSF/plasma ratio was found in the youngest group (7.78). The Mn CSF/plasma ratio was inversely correlated with the average age of ALS-afflicted individuals (7.78 in young, 6.01 in middle aged, 3.40 in very old). Female individuals showed slightly higher ratios compared with male individuals.
Discussion
We found statistically significant elevations of Mn concentrations in CSF from ALS patients compared with controls. Mn in physiological concentrations is essential to proper nerve cell function but toxic 4 in higher concentrations. Effective homeostatic mechanisms regulate Mn concentrations by absorption and excretion of the metal. Active protein mechanisms within the choroid plexus 4 transport Mn from the bloodstream into the CSF. The Mn transport pathways into the brain are complex and not yet fully understood, 18 but seem to involve several protein species 19 including metallothionein (MT), 20 the divalent metal transporter and the transferrin receptor.
CSF Mn concentrations in normal individuals
The median CSF Mn concentration for controls in our study was 2.08 μg/L. This value is in agreement with previous studies of Mn in CSF from controls with concentrations ranging from 0.83 to 2.02 using different analytical techniques. Thus, Cotzias and Papavasiliou 21 reported 0.83–1.50 μg/L (n = 7) using neutron activation analysis, Jimenez et al. 22 reported 0.88 ± 0.76 μg/L (n = 37) using atomic absorption spectroscopy and Michalke et al. 23 noted 2.02 ± 0.11 μg/L (n = 15) using ICP-MS. We have previously reported 1.32 μg/L (n = 13) using the HR-ICP-MS method 24 and 1.78 ± 0.26 μg/L (n = 19), and in the same study, 1.51 ± 0.17 μg/L with atomic absorption spectroscopy. 25
Mn levels in ALS
The Mn concentrations in the serum of ALS patients were reported to be significantly elevated by Kapaki et al. 10 compared with controls. However, in that study, performed with atomic absorption spectroscopy, CSF concentrations of Mn from ALS patients were not different from controls. The age distribution between cases and controls varied in the Kapaki study, as in our study. Increased BBB permeability by age 26 could theoretically explain differences in Mn concentrations. However, the age-sorted data (Table 3) do not support the notion that older age with more permeable barriers contribute to higher CSF Mn concentrations. Alternatively, aging may attenuate the ability of molecular mechanisms to transport Mn across the BBB, contributing to the lower CSF/plasma ratios (Table 3) observed in older age.
It is important to study CSF as it surrounds the spinal cord and brain and is in equilibrium with the nerve cells degenerating in ALS. The rationale of sampling CSF in ALS patients is further strengthened by recent magnetic resonance imaging studies, in Mn overexposed non-human primates, of the relationship between CSF Mn levels and specific uptake into the brain in areas adjacent to the large volumes of CSF in the lateral ventricles. 27
Sources of variability
A variation in metal concentrations is often observed between studies and within studies. It may be caused by many factors such as differences in age, gender, diet, medication and occupation. When different metal analysis methods are used, a larger variability is introduced. Therefore, comparisons between studies performed with atomic absorption spectroscopy and newer studies using ICP-MS are less relevant. Our results differ from those of Kapaki et al.'s 10 study and it can be noted that different methods for metal analysis were used as well as different patient selection, centrifugation routines and different test tubes, preventing further conclusions about potential differences in outcome.
Mn transport proteins
Our data show higher Mn concentrations in CSF than in plasma. Mn transport mechanisms across the BBB are complex and seem to involve several proteins such as the divalent metal transporter-1, transferrin receptor, choline transporter, purinoceptors and other possible proteins 19 regulating Mn concentration in the CSF. Excess Mn in blood can lead to loss of regulation across the membrane and trapping of Mn in the CSF. The blood CSF barrier may act as a lock allowing gradients to build up across the membrane and thus causing Mn to concentrate over time inside the CSF compartment in ALS patients. Dose-dependent accumulation of Mn across brain regions has been shown in animal studies. 28 Such an accumulation may contribute to the relentless course of ALS. Further studies are needed to evaluate the contribution from such mechanisms in ALS pathogenesis.
Role of metallothionein
MT is induced by cadmium and zinc. 29 The MT genes are not silenced in ALS 30 nor are MT levels elevated in ALS serum, 31 although elevated MT levels have been noted in liver tissue in ALS. 32
Barrier systems
The choroid plexus protects the CSF against toxic metals, but at the same time, it is a locus minoris resistentiae for entry. If injured at the level of the tight junctions of the endothelial membrane, the choroid plexus provides a route of entry into the CSF. The possibility of injury by toxic metals, such as Mn, to the protective membrane of the choroid plexus itself must also be considered. Once inside of the barriers, Mn seems to be unevenly distributed among different brain regions, as noted in experiments with exposed non-human primates. 33 The highest concentrations of Mn are found in the basal ganglia but the cortex of the parietal and frontal lobe are also affected. In this region, the periventricular organs devoid of BBB are located. Recent reports indicate that in situations of elevated exposure, certain Mn species 34 may enter nerve cells of the central nervous system (CNS). Repeated exposure to elevated Mn levels may lead to accumulation in the CNS.
Mn from external sources 23 accumulated within the nerve cells of the CNS inside the protecting barrier systems, 8 and may also be found in the CSF as this fluid is in constant flux and in exchange with the extracellular fluid surrounding nerve cell membranes. The higher Mn concentrations in CSF indicate Mn CNS accumulation as a possible contributing factor in ALS pathogenesis.
Relevance for ALS
Animal experiments indicate that exposure to Mn changes the transport systems of the choroid plexus itself involving microtubuli mechanisms and changes in metal transporting proteins. 35 Inhalation experiments with Mn fumes have shown accumulation in primate brains. 36 Excretion of Mn occurs primarily through the bile and patients with reduced liver function have elevated Mn concentrations in blood. 37 Reduced liver function is also observed in ALS. 38–40 One autopsy study using neutron activation analysis on cross-sections of ALS spinal cords has shown elevated Mn concentrations in the anterior horns, most prominent in cervical regions. 41
Limitations of the study
There are fewer controls than cases in this study, although the opposite would be desirable. Recruitment of controls has practical limitations as healthy individuals normally are reluctant to undergo a spinal tap without reason. Some volunteering medical students are included in the control material which skews the age distribution. For further studies in this area, recruitment of elderly controls, although hard to find, is advisable.
Clinical implications
Patients suffering from ALS might be considered as a susceptible group in relation to Mn exposure. Different kinetics for Mn could have an influence on the disease development, as could environmental exposure to Mn. Mn blood plasma concentrations did not differ between ALS cases and controls. Routine blood sampling is less suitable for determination of Mn load. Mn concentrations in CSF as well as Mn CSF/plasma ratio might, however, prove useful in the diagnosis of ALS. To consider this, a larger study is warranted. In this study, the background CSF Mn levels were found in the interval of 0.58–5.40 μg/L, consistent with earlier measurements of Mn concentrations in normal individuals. The ALS cases display 10 patients of 17 (Tables 2 and 4) with Mn concentrations above 5.40 and up to 11.8 μg/L. The individuals with Mn concentrations above 5.40 are all ALS cases. Mn CSF/plasma ratio might serve as a biomarker for ALS. In conclusion, our findings show elevated concentrations of Mn in CSF from patients with ALS. Environmental exposure to Mn might be a contributing pathogenetic factor for ALS development, but further studies on this topic are needed.
Footnotes
ACKNOWLEDGEMENTS
Statistician Jakob Bergstrom is acknowledged for his contributions in preparation and completion of the manuscript and for the statistical analyses which were made during his employment at The Medical Statistics Unit, Department of Learning, Informatics, Management & Ethics (LIME), Karolinska Institutet, Stockholm, Sweden. Funding from Martin Rind foundation and Karolinska Institutet research funds are gratefully acknowledged. Skilful secretarial assistance by Ms Mona Nyang is noted.