
Abstract
The transcription factor nuclear factor of activated T-cells 5 (NFAT5) is a key protector from hypertonic stress in the kidney, but its role in skeletal muscle is unexamined. Here, we evaluate the effects of glucose hypertonicity and hyperglycemia on endogenous NFAT5 activity, transverse tubular system morphology and Ca2+ signaling in adult murine skeletal muscle fibers. We found that exposure to elevated glucose (25–50 mmol/L) increased NFAT5 expression and nuclear translocation, and NFAT-driven transcriptional activity. These effects were insensitive to the inhibition of calcineurin A, but sensitive to both p38α mitogen-activated protein kinases and phosphoinositide 3-kinase-related kinase inhibition. Fibers exposed to elevated glucose exhibited disrupted transverse tubular morphology, characterized by swollen transverse tubules and an increase in longitudinal connections between adjacent transverse tubules. Ca2+ transients elicited by a single, brief electric field stimuli were increased in amplitude in fibers challenged by elevated glucose. Muscle fibers from type 1 diabetic mice exhibited increased NFAT5 expression and transverse tubule disruptions, but no differences in electrically evoked Ca2+ transients. Our results suggest the hypothesis that these changes in skeletal muscle could play a role in the pathophysiology of acute and severe hyperglycemic episodes commonly observed in uncontrolled diabetes.
Introduction
The nuclear factor of activated T-cell (NFAT) transcription factors decode signals to the nucleus from a diverse variety of extracellular messages and are required for cellular adaptation and development. 1,2 NFAT5, also known as TonEBP or OREBP, belongs to the Rel family of transcription factors, which also includes (NFATc1–4) and nuclear factor kappa B (NF-κB). 3–5 NFAT5 is not only a key regulator in protection from hypertonic stress in kidney epithelial cells from the renal medulla, 6,7 but also plays a protective role in diverse cell types ranging from macrophages and endothelial cells to cardiomyocytes and brain cells. 6,8–17 Although NFAT5 has some constitutively active transcriptional activity, its activity is modified by changes in extracellular tonicity. 3,18–20 Hypertonicity induces NFAT5 nuclear translocation and activates genes responsible for the transport and synthesis of organic osmolytes (sodium/myo-inositol transporter, SMIT), the taurine transporter, the betaine/gamma-aminobutyric acid transporter, the vasopressin-regulated urea transporter and aldose reductase (AR). 21–24 NFAT5 also induces the expression of heat-shock protein 70 and the water channel AQP2. 25,26 The NFAT5-mediated adaptive transcriptional responses to hypertonicity described above have been extensively studied in kidney-derived epithelial cells; a cell type adapted to function under large variations in osmolarity during normal physiological function in vivo. 18,27
It is likely that certain pathological conditions involving alterations in osmotic balance, such as diabetic hyperglycemia or severe dehydration, also require osmotic adaptative responses in other cell types as well. NFAT5 mRNA is expressed in skeletal muscle, 4 but it is not known if skeletal muscle NFAT5 activity is modulated by osmotic stress. Glucose plasma levels during a hyperglycemic crisis in uncontrolled diabetes can reach extreme values as high as 600–1300 mg/dL (33–72 mmol/L), changing the osmolarity significantly (320–380 mOsm/kg). 28,29 In addition, there is evidence that osmotic stress elicits a morphological disruption of the transverse tubular system and abnormal Ca2+ signals in skeletal muscle fibers. 30–32 Therefore, it is likely that adaptive responses to and/or deleterious effects of osmotic stress play a role in the muscle pathophysiology of hyperglycemia in diabetes. Although skeletal muscle constitutes a relatively large capacity osmoregulatory pool, the possibility of osmoregulatory responses in muscle during hyperglycemia, and the corresponding underlying signaling mechanisms have, surprisingly, not been previously examined to our knowledge.
Here, we seek to evaluate the effects of elevated extracellular glucose on (1) endogenous NFAT5 activity; (2) on transverse tubule morphology; and (3) on intracellular resting Ca2+ levels and action potential-evoked Ca2+ transients using adult skeletal muscle fibers from normal and type 1 diabetic mice exposed to elevated glucose concentrations in culture. Our results provide the first account of activation of NFAT5 signaling in skeletal muscle mediated by glucose hypertonicity, and the effects of elevated glucose on tubular system morphology and electrically evoked Ca2+ signals in skeletal muscle.
Materials and methods
Flexor digitorum brevis skeletal muscle fibers culture
Experiments were performed on skeletal muscle fibers enzymatically isolated from the flexor digitorum brevis (FDB) muscles of four- to five-week-old C57BL/6J mice. Animals were euthanized by CO2 exposure followed by cervical dislocation before removal of the muscles according to protocols approved by the University of Maryland Institutional Animal Care and Use Committee. FDB skeletal muscle fibers were isolated, dissociated and cultured in a humidified incubator at 37°C (5% CO2) as previously described.
33–36
Fibers were cultured on laminin-coated glass-bottom culture dishes. After plating, cultures were maintained in minimum essential media (Invitrogen, Eugene, OR, USA; containing 5.56 mmol/L
Chemically induced type 1 diabetic animal model
The procedure for generation of type 1 diabetic mice was conducted as previously described 37 and following procedures approved by the University of Maryland Institutional Animal Care and Use Committee. Briefly, female C57BL/6J mice (median body weight 22 g) were purchased from Jackson Laboratory (Bar Harbor, Maine, ME, USA). Streptozotocin (STZ) from Sigma (St Louis, MO, USA) was dissolved in sterile 0.1 mol/L citrate buffer (pH 4.5). Eight-week-old C57BL/6J mice were intravenously injected daily with 65 mg/kg STZ for three days to induce diabetes. Insulin pellets were subcutaneously implanted in diabetic mice to restore euglycemia to mimic insulin treatment. After five days, insulin pellets were removed to permit frank hyperglycemia. When blood glucose levels reached ≥250 mg/dL, the animals were considered diabetic. Plasma glucose levels were measured from tail vein samples using a commercially available kit (One Touch UltraMini; LifeScan, Milpitas, CA, USA) according to the manufacturer's instructions. Mice were euthanized after experiencing 10 days of continuous hyperglycemia. Animals injected with the citrate buffer served as euglycemic controls. Tibialis anterior (TA) muscles were dissected and used for Western blot assays. Individual fibers from FDB muscles were isolated and plated as described above and used within the first 24 h.
Dual-luminescence-based gene reporter assays
Approximately 100–150 FDB fibers/dish were transferred to serum-free, isotonic control medium 48 h after plating and ara-C treatment. After serum removal, fibers were co-transfected with adenovirus encoding a luciferase-based reporter of NFAT activity (9X-NFAT-luciferase
38
) and a second adenovirus encoding constitutively active β-galactosidase under the control of a cytomegalovirus (CMV) promoter at a ratio of 5:1. The fibers were exposed to hypertonic (308–336 mOsm/kg) high-glucose media (
Protein extraction and Western blots
Culture plates containing fibers from FDB muscles or TA whole muscle homogenates provided a sufficient amount of cellular material for Western blot experiments. These procedures have been described previously.
39
An independent experiment consisted of cultured isolated fibers from two whole FDB muscles, or one whole TA muscle, 3–4 mice per group. Briefly, FDB fibers were transferred to phosphate-buffered saline (PBS) 48 h after plating and ara-C treatments. Cultured FDB fibers or TA muscles were homogenized with a mammalian protein extraction reagent (M-PER; Pierce, Rockford, IL, USA) supplemented with protease inhibitor cocktail (Complete-Mini EDTA-free; Roche Diagnostics, Indianapolis, IN, USA). The homogenates were subjected to centrifugation at 10,000 rpm for 10 min at 4°C. The supernatant was extracted and stored. Protein concentrations were measured using a Nanodrop-1000 spectrophotometer (Thermo Scientific, Wilmington, DE, USA). Samples for electrophoresis were not boiled, but were solubilized at 70°C for 10 min. Then, 40 μg protein samples were fractionated by 4–12% sodium dodecyl sulfate-polyacrylamide gel electrophoresis and transferred to nitrocellulose membrane, at 20 V for three hours at 4°C using the Xcell II blot module (Invitrogen). Blots were then processed and probed with antibodies against NFAT5 (1:1000; Cat No. sc-101098; Santa Cruz Biotechnology, Inc., Santa Cruz, CA, USA), SMIT (1:1000; Cat. No. H00006526-M02; Abnova, Taipei, Taiwan), AR (1:1000; Cat. No. H00000231-B01P; Abnova) and glyceraldehyde-3-phosphate dehydrogenase (GAPDH; 1:12000; Cat. No. G8795; Sigma). Blots were incubated with the appropriate horseradish peroxidase (HRP)-labeled secondary antibodies (KPL, Gaithersburg, MD, USA). Films were developed following exposure to sensitive enhanced chemiluminescent substrate to detect HRP on immunoblots. Either SuperSignal West Pico or the more sensitive SuperSignal West Femto were used (Pierce). ImageJ (NIH, Bethesda, MD, USA;
Immunocytofluorescence
Fibers were fixed in PBS (pH 7.4) containing 4% (w/v) of paraformaldehyde for 15 min and then permeabilized in PBS containing 0.1% (v/v) Triton ×100 (Sigma) for 15 min. The fibers were exposed to PBS containing 8% (v/v) of donkey serum for one hour at 4°C to block non-specific labeling. The fibers were first incubated with a primary antibody against the C-terminal residues 1439–1455 of NFAT5 (1:400, overnight at 4°C; Cat No. ab3446; Abcam, Cambridge, MA, USA), followed by incubation with Alexa-488-conjugated donkey anti-mouse antibody (1:200 dilution, 2 h at room temperature; Invitrogen). Dishes were washed thoroughly after each step in PBS containing 2% (v/v) of donkey serum. For each primary antibody-treated dish, another dish was treated with the secondary antibody only and used as control. 4',6-Diamidino-2-phenylindole (DAPI; 10 μmol/L; for 30 min; Invitrogen) was used to stain the nuclei. Antibody-labeled and DAPI stained fibers were imaged on a Zeiss LSM 5 Live system, based on an Axiovert 200M inverted microscope (Carl Zeiss Microimaging, Inc., Thornwood, NY, USA) using a 63X NA 1.2 water immersion objective lens. The excitation for Alexa-488 and DAPI were provided by using 488 and 405 nm lasers, respectively. The emitted light for Alexa-488 was collected at > 510 nm. DAPI emission was collected between 420 and 480 nm. Confocal images of randomly selected fibers exposed to either isotonic or high-glucose/hypertonic conditions were collected and evaluated blindly, using the same image acquisition settings and enhancing parameters so that all images could be directly compared. Images were background corrected, after which cytoplasmic and nuclear regions of fixed dimensions were used to estimate average fluorescence within the regions of interest. These values were then used to calculate nuclear/cytosolic ratios and were expressed as arbitrary units (A.U.). Images were processed using custom-written software in IDL (RSI, Boulder, CO, USA) and ImageJ (NIH;
Time-lapse imaging
Long-term live cell incubation and an imaging system (Vivaview FL Incubator; Olympus, Center Valley, PA, USA) were used, where indicated. Fibers were maintained in control media (5.56 mmol/L
Indo-1 ratiometric recordings
Indo-1 acetoxymethyl (AM) ratiometric recording and analysis were performed as previously described
40
but with some modifications for loading. Briefly, cultured FDB fibers were loaded with indo-1AM (2 μmol/L for 30 min at 22°C; Invitrogen) in L-15 media (ionic composition in mM: 137 NaCl, 5.7 KCl, 1.26 CaCl2, 1.8 MgCl2, pH 7.4; Invitrogen) with or without 25–50 mmol/L of added
Transverse tubular network imaging in living fibers
Control or high-glucose-exposed FDB fibers were stained with the voltage-sensitive dye pyridinium, 4-[2-(6-(dioctylamino)-2-naphthalenyl) ethenyl]-1-(3-sulfopropyl)-, inner salt (di-8-ANEPPS) (5 μmol/L; in L-15 media for 1 h) and imaged on a Fluoview 500 confocal system (Olympus; ×60, 1.3 NA water-immersion objective; pixel dimensions 0.2 × 0.2 μm in x and y). Confocal images of the tubular network were obtained with 512 × 512 pixel x–y images (average of eight images). Images from fibers exposed to either control or high-glucose conditions were collected from randomly selected fibers using the same image acquisition settings and enhancing parameters. Images were background corrected and a region of interest of fixed dimensions was used to estimate average fluorescence profile within the region of interest.
Data analysis and statistics methods
Electrophysiology and indo-1 data were analyzed and plotted using Patchmaster, Fitmaster (HEKA Instruments Inc.). Immunocytochemistry, di-8-ANEPPS signals and Western blot data were analyzed with ImageJ. Further data evaluation and statistical analysis were conducted using OriginPro 8 software (OriginLab Corporation, Northampton, MA, USA). Summary data were reported as mean ± SEM when samples followed normal distributions and as medians when samples were less well defined. Box plots and bar graphs were used for graphic illustration of data. Statistical significance was assessed using either parametric two sample t-test or with the non-parametric Mann–Whitney rank-sum test for unpaired data sets.
Results
Elevated glucose activates NFAT-mediated gene transcription and NFAT5 protein expression in cultured FDB fibers
We first evaluated if skeletal muscle NFAT5 signaling is activated by elevated extracellular glucose. Blood glucose levels are closely regulated in healthy individuals and rarely stray outside the range 4.2–6.4 mmol/L, but can reach high values between 7 and 25 mmol/L in individuals with diabetes mellitus and in animal models of diabetes. 43–47 Hyperglycemia is commonly found to be even more extreme (30–70 mmol/L) in patients with uncontrolled diabetes. During such extreme events, life-threatening acute metabolic complications of diabetes such as hyperglycemic hyperosmolar state (HHS) can occur. 28,29 These episodes of severe hyperglycemia (i.e. ≥30 mmol/L glucose) might be accompanied by a substantial increase in plasma tonicity. It is likely that hyperglycemia and associated hypertonicity initiate adaptive responses to osmotic stress.
To address this possibility, we sought to experimentally reproduce this condition. Skeletal muscle fibers isolated from control mice were exposed to media conditions mimicking sustained and extreme elevated glucose. We used an adenoviral system carrying a firefly luciferase reporter driven by nine copies of NFAT binding sites
38
together with a control adenovirus encoding a reporter of β-galactosidase driven by the constitutively active CMV promoter to evaluate if elevated glucose resulted in the activation of NFAT-dependent transcriptional activity (Figure 1a). The time course of the experimental protocol used in these studies is illustrated in Figure 1b. We found that the NFAT-luciferase reporter was activated after 24 h of exposure to glucose levels of 25 and 50 mmol/L when compared with control counterparts (5.56 mmol/L Sustained elevation in extracellular glucose enhances NFAT-dependent transcriptional activity and NFAT5 expression. (a) Schematic representation of the reporters used in this study. (b) Protocol used for experiments illustrated also in Figures 2–5. After plating, FDB fibers were treated with ara-C for 24 h, then ara-C was washed out. Then, after 48 h, plated fibers were co-transfected with adenovirus containing NFAT-driven luciferase and CMV-driven β-galactosidase reporters. Transfection was not performed in fibers used for Western blot and immunofluorescence assays. Beginning one day after transfection, fibers were maintained in control and isotonic (5.56 mmol/L 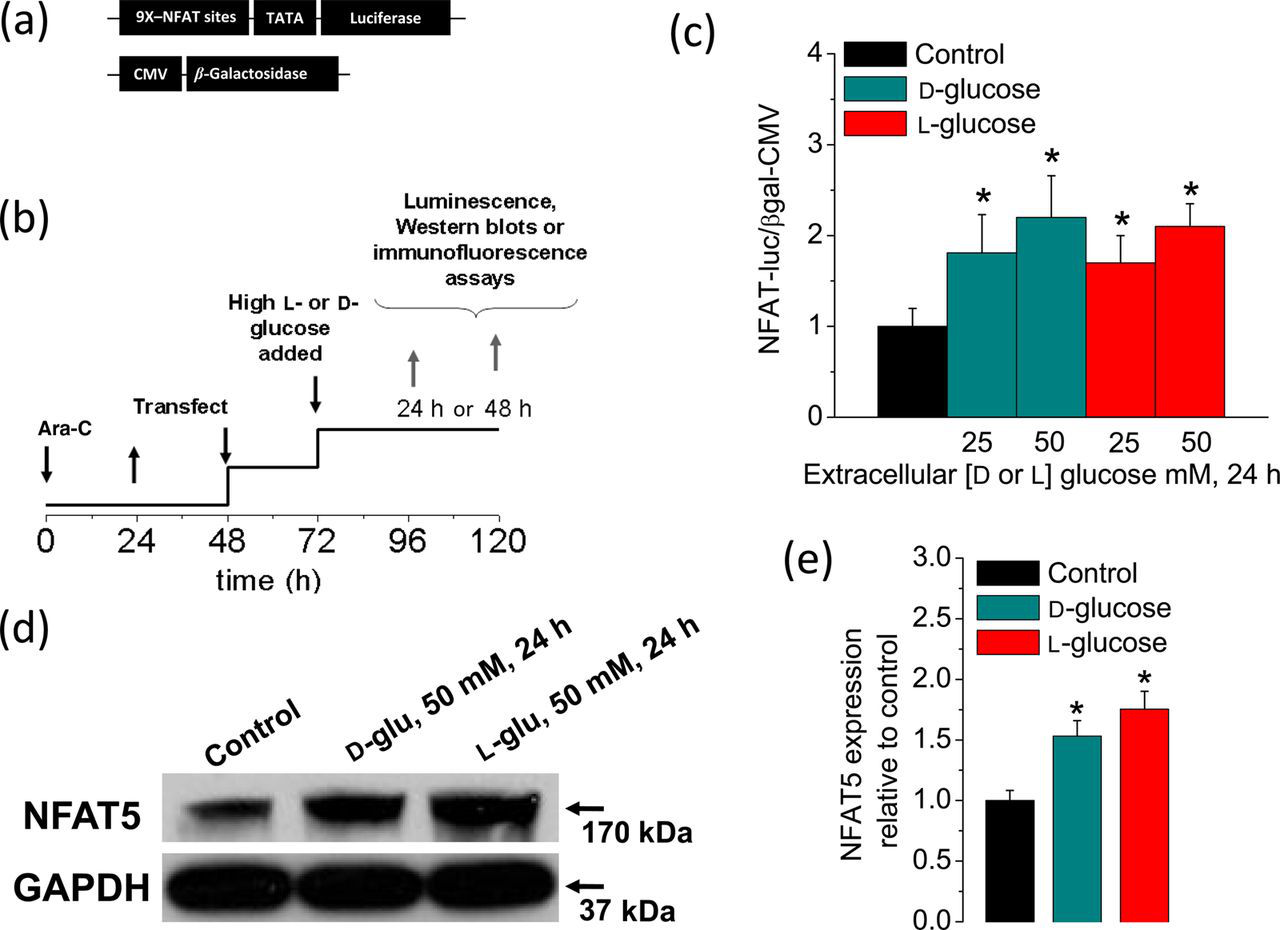
NFAT-dependent transcriptional activity induced by elevated extracellular glucose does not involve Ca2+/calcineurin-dependent NFATc isoforms
It has been shown that 9X-NFAT-luciferase reporter can be used to detect the activities of both the Ca2+-sensitive NFAT isoforms (NFATc1–4) and the Ca2+-independent NFAT5 in primary cells.
11,38
In order to address if NFAT-luciferase reporter was activated by NFATc1–4 or by NFAT5, in our experiments, we used FK506 to inhibit calcineurin A (CnA) activity, and hence the activation of all the Ca2+/CnA-dependent NFAT isoforms (NFATc1–4). For these experiments, fibers were pretreated with FK506 at 250 nmol/L for two hours prior to as well as during the challenge with high glucose (50 mmol/L; 48 h), and compared with fibers without FK506. Figure 2a shows that NFAT-luciferase reporter activity of fibers exposed to high glucose was not suppressed by the CnA inhibitor FK506. We also monitored NFAT5 protein expression in cells pretreated with the FK506 and then challenged with high glucose and found that the inhibition of CnA does not reduce the increment in NFAT5 protein expression observed in fibers challenged with high glucose (Figure 2b). Our results instead show a moderate increase of both NFAT-luciferase and NFAT5 protein expression in fibers pretreated with FK506 and challenged with high glucose. These results indicate that Ca2+/calcineurin-dependent NFATc isoforms are not involved in the elevated NFAT-luciferase reporter activity and augmented NFAT5 expression seen in fibers exposed to high glucose.
High glucose-dependent activation of the NFAT-luciferase reporter and NFAT5 expression are insensitive to the calcineurin-A inhibitor FK506. Fibers were transfected as in the protocol indicated in Figure 1a. One day after transfection, fibers were transferred to isotonic or high-glucose (50 mmol/L) media with DMSO (0.5% v/v) or with FK506 (0.5 μmol/L), a calcineurin-A inhibitor, during 24 h. (a) Luciferase activity driven by NFAT normalized to β-galactosidase activity driven by CMV relative to control fibers. Mean ± S.E. of four independent experiments (four mice per group) is shown. (b) Western blot analysis of whole cell homogenates prepared from FDB fibers cultured in control isotonic media or in high 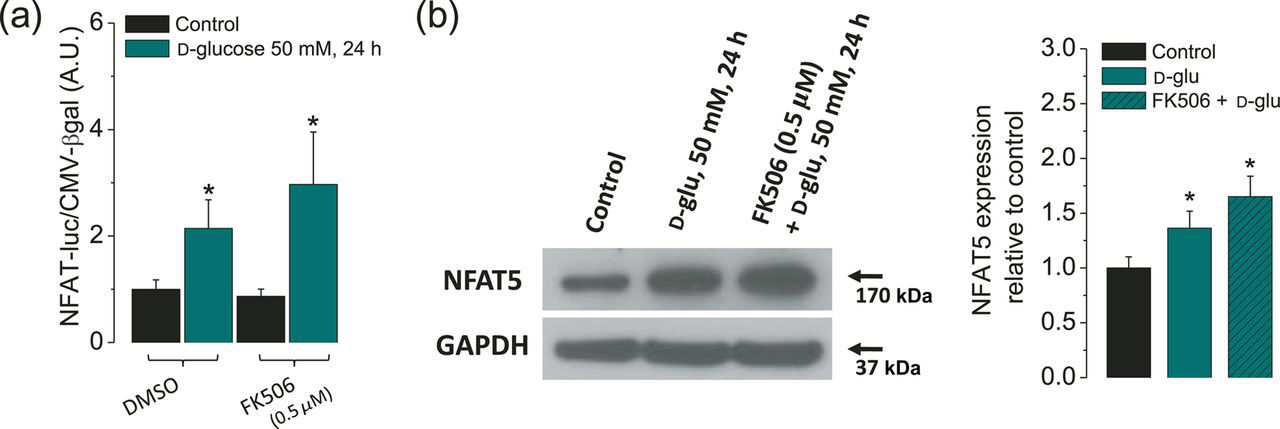
Inhibition of stress kinases p38α and PIKK reduces transcriptional activation of NFAT and NFAT5 protein expression in response to high glucose challenge
Activation of NFAT5 by osmotic stress is complex and may be regulated by a variety of different intracellular signaling pathways whose relative contributions vary among different cell types.
18
Depending on the cell type, the activation of NFAT5 may be regulated by signaling pathways that involve stress-activated kinases such as p38 mitogen-activated protein kinases (MAPK), phosphoinositide 3-kinase and DNA-damage-activated phosphoinositide 3-kinase-related kinase (PIKK), Fyn, a shrinkage-activated tyrosine kinase (PKA) and extracellular-signal-regulated kinases,
48–53
as well as other enzymes such as phospholipase Cγ and Src homology phosphatase-1, a protein phosphatase.
54,55
However, the combination of PIKK and p38α MAPK seems to be essential in primary cell cultures.
18,49,56
Therefore, to investigate the contribution of these kinases on the NFAT-luciferase reporter activity and NFAT5 protein expression induced by high glucose in skeletal muscle fibers, we used inhibitors of p38α MAPK (SB203580) and PIKK (LY294002). As shown in Figure 3a, the NFAT-luciferase reporter activity of fibers exposed to high glucose was sensitive to pretreatment with p38α MAPK inhibitor (SB203580; 10 μmol/L) and the PIKK inhibitor (LY294002; 25 μmol/L). The combined action of both inhibitors produced a slightly larger but still incomplete reduction of the NFAT-luciferase reporter activity (Figure 3a). Figure 3b shows that the inhibition of both p38α and PIKK produced almost a complete suppression of the increase in NFAT5 expression seen in the untreated high-glucose-exposed counterpart. These results implicate p38α MAPK and PIKK (SB203580- and LY294002-sensitive kinases, respectively) in both the transcriptional activation of NFAT5 and in the regulation of its expression in response to high glucose-dependent osmotic stress.
High glucose-dependent activation of the NFAT-luciferase reporter and NFAT5 expression are sensitive to inhibitors of stress kinases p38α and PIKK. FDB fibers were transfected as in Figure 1a. One day after transfection, fibers were transferred to isotonic or high-glucose (50 mmol/L) media with DMSO (0.5% v/v) or with SB203580 (10 μmol/L; a p38α inhibitor), LY2940002 (25 μmol/L; a PIKK inhibitor) or both (SB203580 + LY2940002) during 24 h. (a) Luciferase activity driven by NFAT normalized to β-galactosidase activity driven by CMV relative to control fibers. Mean ± S.E of three independent experiments is shown. (b) Western blot analysis of whole cell homogenates prepared from FDB fibers cultured in control isotonic media or in high 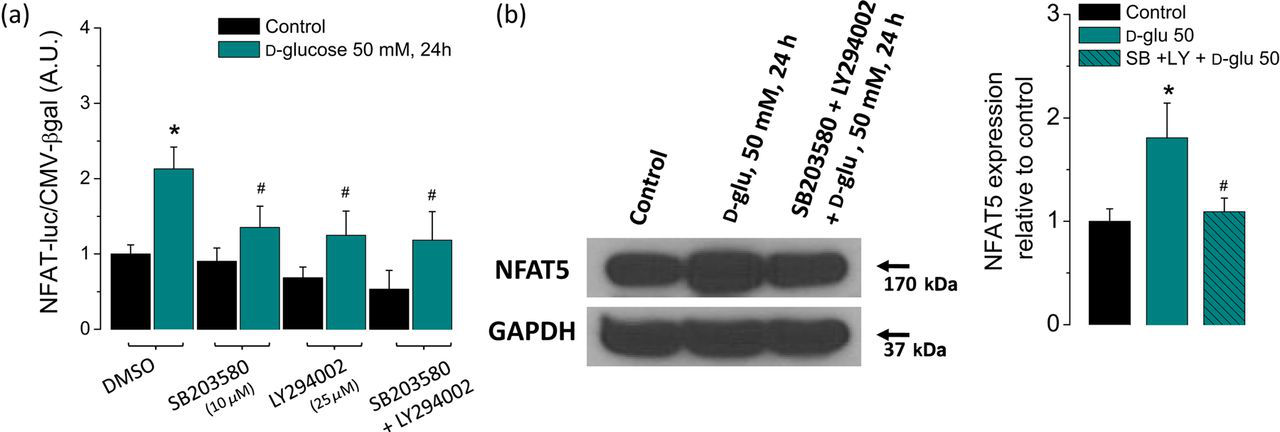
Distribution of endogenous NFAT5 and increased nuclear translocation in fibers exposed to high extracellular glucose
Next, we sought to determine the subcellular distribution of endogenous NFAT5 in skeletal muscle fibers and its potential translocation in fibers challenged with elevated extracellular glucose. To this end, we utilized confocal microscopy to image endogenous NFAT5 in fixed fibers stained with a monoclonal antibody against NFAT5 using indirect immunofluorescence. Figure 4 shows representative confocal images of the NFAT5 intracellular distribution and DAPI staining, to identify the nuclear location and intranuclear structure, in both control (5.56 mmol/L Sustained elevation in extracellular glucose enhances NFAT5 nuclear translocation. Following the protocol described in Figure 1a, at 72 h after plating, fibers were transferred to isotonic or high 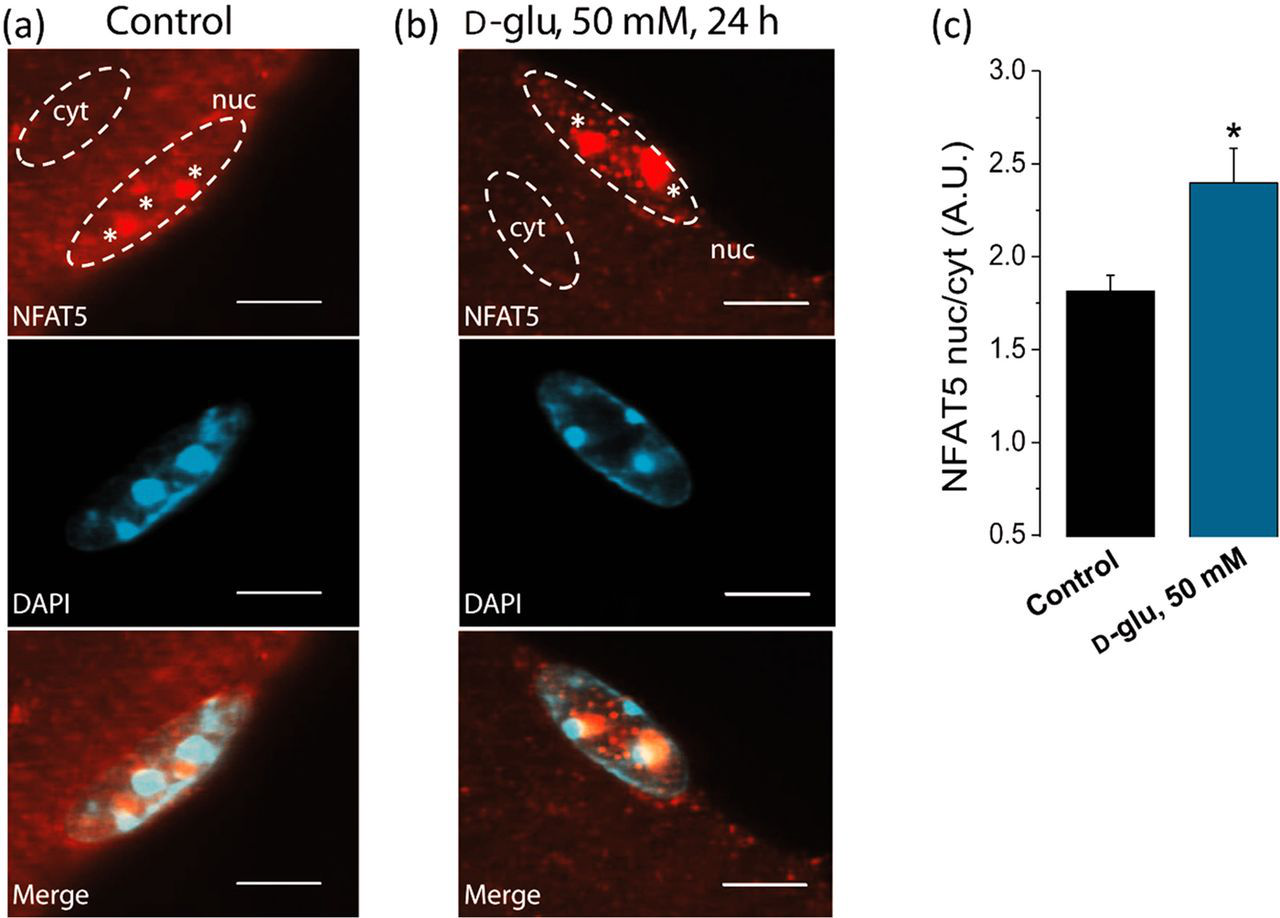
Elevated glucose increased protein expression of aldose reductase and sodium/myo-inositol transporter
Long-term exposure to hypertonic conditions results in altered transcription of a number of osmoregulatory genes, most of which are involved in uptake and synthesis of non-ionic osmolytes (such as sorbitol, inositol, betaine, amino acids and their derivatives), heat-shock proteins and aquaporins.
21–26
In order to evaluate if a sustained elevation in glucose results in the activation of osmoprotective genes in skeletal muscle, we examined the protein expression levels for AR, which catalyzes the reduction of glucose to sorbitol, and of the sodium/myo-inositol transporter SMIT, which is involved in the uptake of inositol. About 75% increase in AR expression was detected 24 h after an elevation in extracellular Activation of NFAT5-dependent osmoprotective genes after an elevation in extracellular 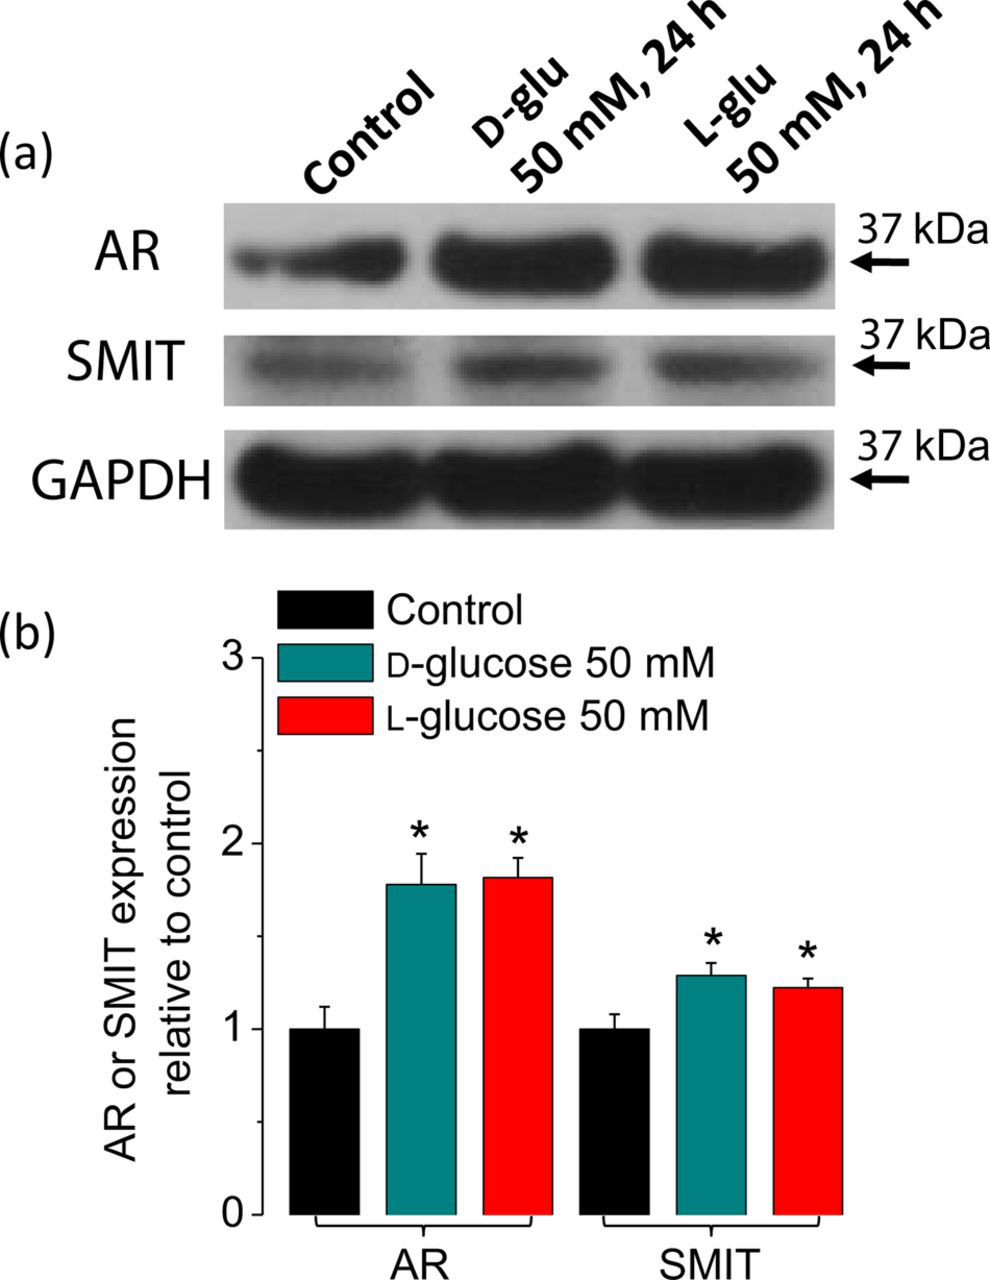
Fibers exposed to elevated glucose do not exhibit major changes in gross morphology
The preceding section demonstrating NFAT-transcriptional activation, NFAT5 protein expression and the increased expression of AR induced by elevated glucose indicates that FDB muscle fibers are endowed with osmoprotective responses. Next, we evaluated the effects of elevated glucose on single muscle fiber gross morphology. Figure 6 shows representative differential interference contrast microscopy images from a 72-hour time-lapse experiment using a microscope-incubator (see Materials and methods). Cultured FDB fibers were maintained at 37°C before and during a control medium change (isotonic control to isotonic control, 5.56 mmol/L Fibers exposed to elevated glucose do not exhibit major changes in gross morphology. Representative differential interference contrast microscopy images from a 72-h time-lapse experiment from a control fiber maintained in isotonic control (5.56 mmol/L 
High-glucose-exposed fibers exhibit a highly disrupted transverse tubular network
The transverse tubular system architecture is essential for muscle contraction. 58–60
Since sustained hyperosmotic stress might be related to changes in transverse tubular morphology, we next sought to evaluate transverse tubular organization in cultured fibers under both control and high-glucose conditions using the lipophilic dye di-8-ANEPPS, which stains both the surface sarcolemma and the tubular system due to their exposure to the extracellular solution. In adult mammalian skeletal muscle, the transverse tubular system displays a highly organized transverse pattern, with a transverse tubular system located at each of the two A/I boundaries in each sarcomere. Figure 7a shows that overall transverse tubular morphology is preserved in five-day cultured fibers maintained in isotonic control (5.56 mmol/L Transverse tubular system disruption accompanying 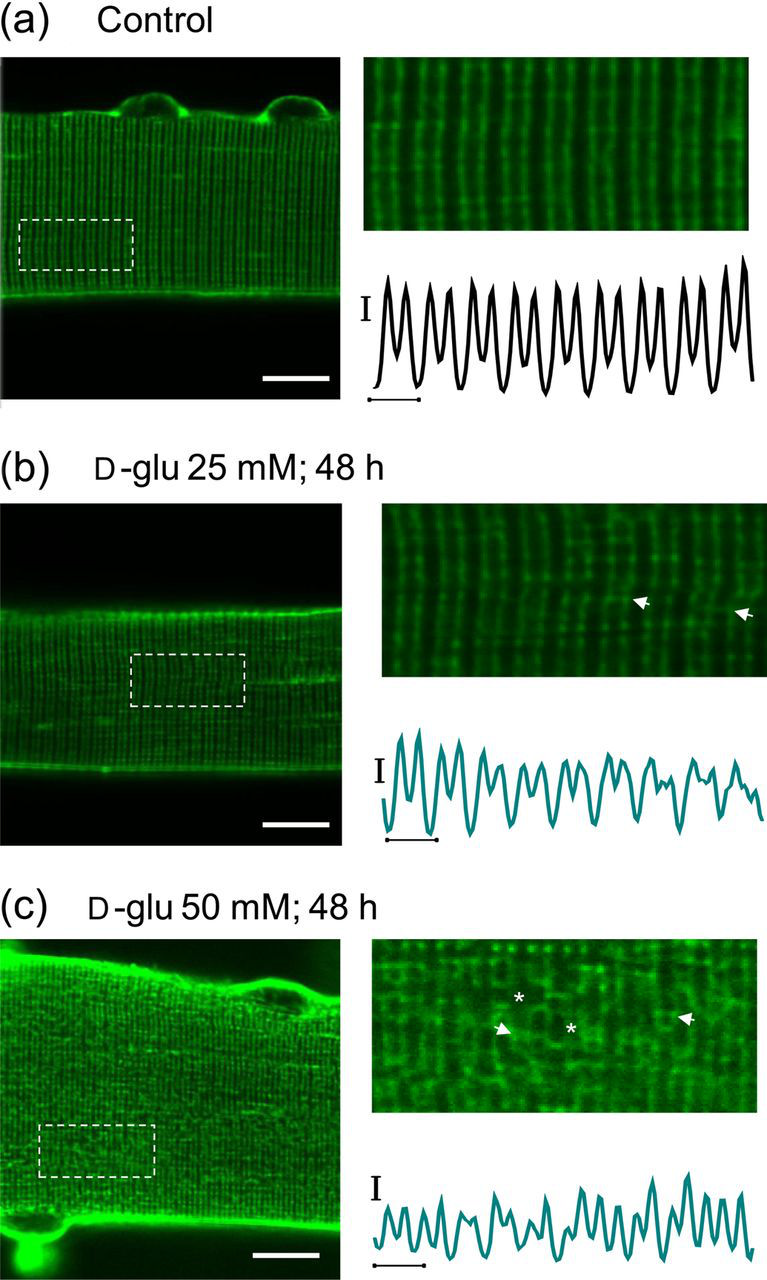
Fibers from diabetic mice exhibit elevated levels of NFAT5 protein expression and disrupted transverse tubular system morphology, but normal Ca2+ homeostasis
The experiments described above examined the effects of elevated extracellular glucose on NFAT transcriptional activity, NFAT5 expression and transverse tubule morphology in cultured FDB fibers isolated from healthy control mice artificially exposed to elevated glucose. Seeking to better understand the pathophysiological effects of sustained glucose elevation in uncontrolled diabetes, we next investigated if NFAT5 expression levels were altered in muscle fibers isolated from a chemically induced mouse model of type 1 diabetes exhibiting hyperglycemia (see Materials and methods). As a control, we used muscle fibers isolated from aged-match sham, citrate-injected, non-diabetic mice. Plasma glucose concentrations immediately after euthanasia procedure were 8.1 ± 0.2 mmol/L (n = 4) in control mice and 22.8 ± 5.0 mmol/L (n = 4) in diabetic mice. Average and peak plasma glucose concentrations sampled from living diabetic mice were 20 ± 6 and 28 ± 3 mmol/L, respectively. These measurements are consistent with previous studies indicating that plasma glucose levels range between 6 and 10 mmol/L in non-diabetic animals and about 20–25 mmol/L in animal models of diabetes.
43–46
Fibers from diabetic mice exhibited elevated NFAT5 protein expression when compared with the sham counterpart (Figure 8a).
Fibers from type 1 diabetic mice display an increase in NFAT5 expression and transverse tubule system disruption but no changes in electrically evoked Ca2+ transients. (a) Left, Western blot analysis of whole cell homogenates prepared from TA muscles from sham, non-diabetic mice or from type 1 diabetic mice. The blot is representative of three independent experiments, three mice per condition. Right, quantification of Western blot data indicates a substantial increase of NFAT5 expression in type 1 diabetic mice. *Indicates P < 0.05 compared with sham, non-diabetic control. Representative confocal images of the transverse tubule morphology of FDB fibers isolated from sham, non-diabetic (b) (n = 30 fibers, four mice) and type 1 diabetic mice (c) (n = 30 fibers, four mice) and stained with di-8-ANEPPS. Scale bar: 20 μm. Bottom images are zoom-in versions of boxed regions indicated in panels (b) and (c). Traces below zoom-in images are averaged fluorescence profiles across the box, vertical scale bar: 500 A.U.; horizontal scale bar: 2 μm. Di-8-ANEPPS staining reveals that transverse tubule morphology is disrupted in fibers from diabetic mice. (d) Time course of electrically evoked Ca2+ transients, using the Ca2+ indicator indo-1, from single muscle fibers from sham, non-diabetic mice (black trace; n = 31 fibers, four mice) and from type 1 diabetic mice (red trace; n = 35 fibers, four mice). Inset, Δ indo-1 ratio (Δ indo-1 ratio = (indo-1 ratio)−(resting indo-1 ratio)), shows negligible differences in the amplitude and kinetics of electrically evoked Ca2+ transients from fibers isolated from type 1 diabetic mice when compared with sham, non-diabetic counterparts. (e) Box-plot summary of indo-1 ratio measurements at rest and peak; median indo-1 ratio values are shown by solid lines within each box on distribution plots. Box upper and lower limits represent the 75th and 25th percentiles, respectively; the extended lines indicate the 10th and 90th percentiles. No significant changes in resting or peak indo-1 ratio values were found in fibers from type 1 diabetic mice when compared with control counterparts. For experiments using FDB fibers from diabetic mice in panels (b)–(e), glucose in media was maintained at the same levels as found in vivo (average plasma glucose in type 1 diabetic mice was 22 mmol/L). One day after plating, FDB fibers from type 1 diabetic mice and sham, non-diabetic mice were stained with Di-8-ANEPPS or loaded with indo-1 AM (see Materials and methods) and then resting ratio and electrically evoked Ca2+ transients were measured. N.S., not significant; A.U., arbitrary units; NFAT5, nuclear factor of activated T-cells 5; FDB, flexor digitorum brevis; TA, tibialis anterior; GAPDH, glyceraldehyde-3-phosphate dehydrogenase. (A color version of this figure is available in the online journal)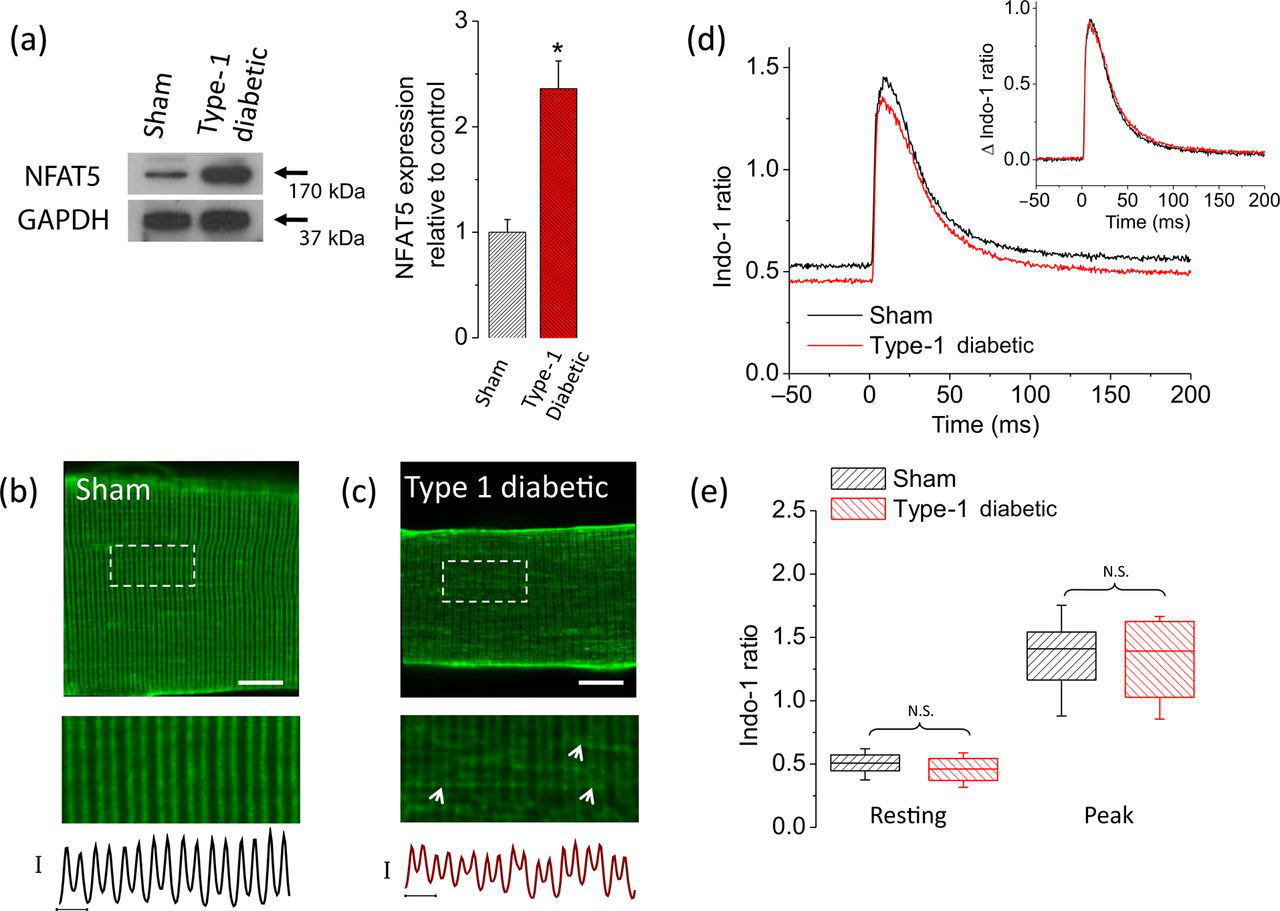
Next, we asked if fibers from diabetic mice exhibit changes in transverse tubular morphology. Figure 8c shows that in one-day-old cultured fibers from diabetic mice, the transverse tubular system was disorganized, and characterized by a disruption of the regular pattern running transversely across the fiber. A larger number of zones of proximity between adjacent transverse tubules were also identified (Figure 8c, arrows). These observations partially recapitulate what we observed in fibers from non-diabetic mice exposed to elevated (25 mmol/L) glucose. In clear contrast, transverse tubule morphology was unaltered in one-day-cultured control fibers from sham, non-diabetic mice (Figure 8b).
Because of the T-system disruption, we also investigated the effects of hyperglycemia on Ca2+ homeostasis and action potential evoked Ca2+ transients in muscle fibers dissociated from diabetic mice and sham non-diabetic mice. Figure 8d illustrates the average time course of indo-1 signals before and after field stimulation for 31 fibers from sham, non-diabetic mice (black trace) and 35 fibers from diabetic mice. Fibers from diabetic mice having a serum glucose value of 22 mmol/L did not exhibit significant changes in resting indo-1 ratio (resting [Ca2+] i was 31 nmol/L in diabetic fibers versus 37 nmol/L in control, non-diabetic fibers, P > 0.05; Figure 8e). A non-statistically significant difference in average peak [Ca2+] i was observed in fibers from diabetic mice (peak [Ca2+] i was 438 nmol/L in diabetic fibers versus 456 nmol/L in control, non-diabetic fibers, P > 0.05; Figures 8d and e). The above results indicate that fibers from diabetic mice exhibit increased NFAT5 expression and alterations in transverse tubular architecture but no changes in Ca2+ homeostasis and electrically evoked Ca2+ transients.
Fibers from control mice experimentally exposed to elevated glucose exhibit increased action potential-induced Ca2+ signals
In order to explore the effects of extremely elevated glucose on resting intracellular Ca2+ concentration ([Ca2+]
i
) and electrically evoked Ca2+ transients, fibers from control mice were experimentally challenged with 25 or 50 mmol/L Sustained elevated 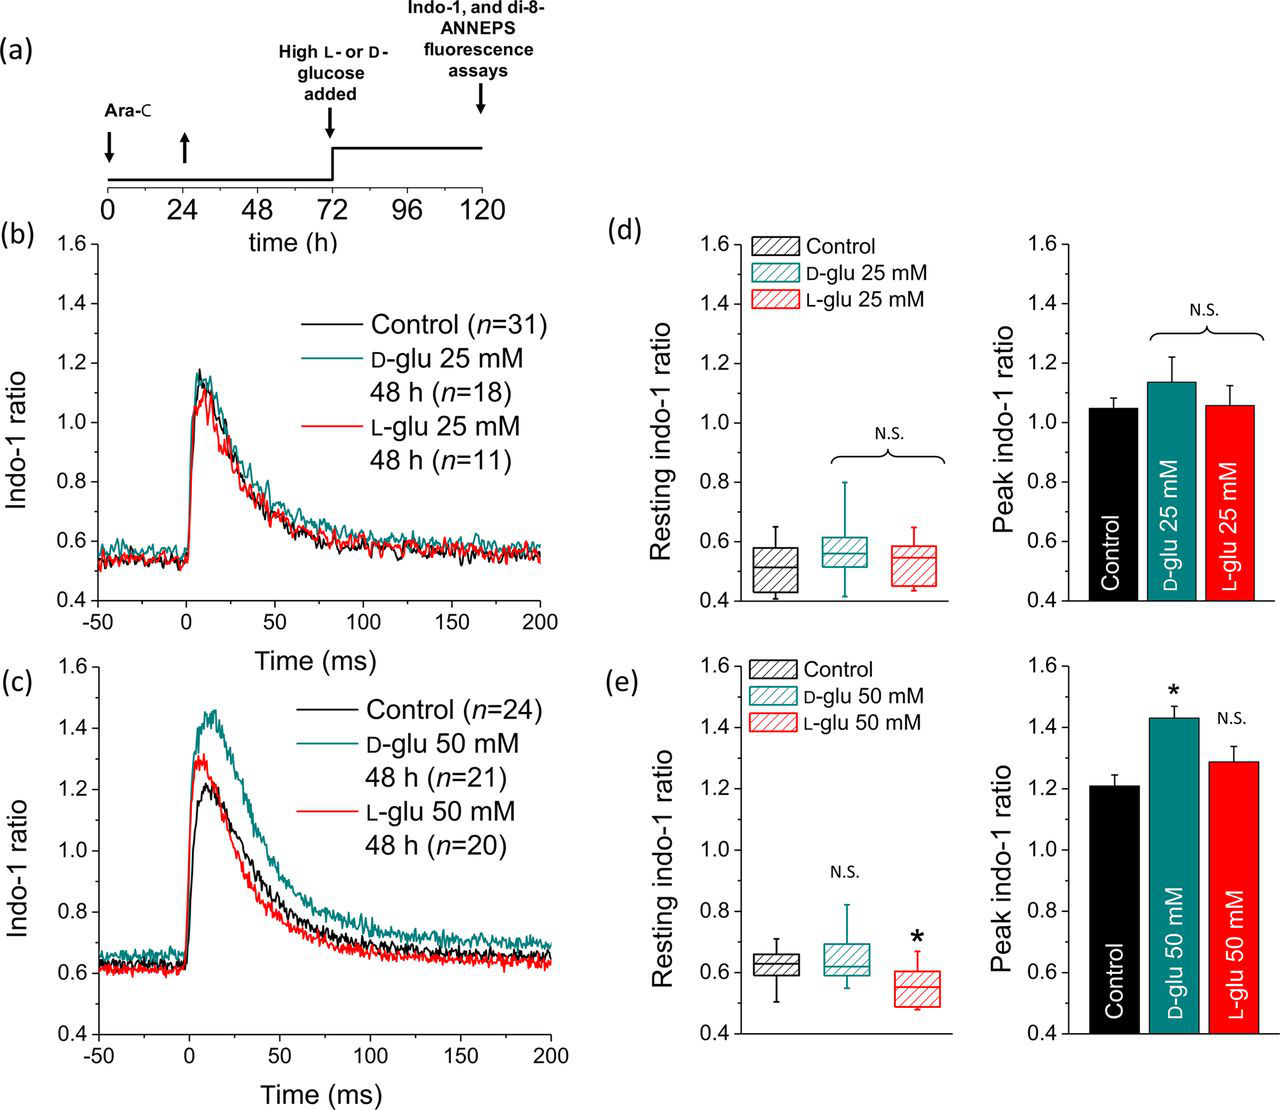
Figure 9c illustrates the average time course of indo-1 signals elicited by the same brief electric field stimulus for 24 fibers in control (black trace), 21 fibers exposed to 50 mmol/L
Fibers exposed to 50 mmol/L
Discussion
Relatively little is known about the behavior of NFAT5 in adult muscle fibers in response to hypertonicity. In particular, the effect of elevated extracellular glucose on single adult fibers has not, to our knowledge, previously been investigated. Our results show that NFAT5 is endogenously expressed in adult murine skeletal muscle fibers, and that elevated extracellular glucose enhances NFAT-dependent transcriptional activity, NFAT5 nuclear translocation and NFAT5 expression levels. Endogenous NFAT5 is present in both cytoplasmic and nuclear compartments in control adult murine skeletal muscle fibers, indicating a small constitutive nuclear presence of NFAT5 in resting cells, as previously reported in other cell types. 3,4,18,20,27 Elevation of extracellular glucose causes a significant increase in NFAT5 nuclear translocation. In both control and high-glucose-exposed fibers, NFAT5 exhibits non-uniform nuclear distribution with intranuclear foci (1–3 foci per nucleus of about 1–3 μm in diameter) of elevated concentration. Our laboratory have previously demonstrated that Ca2+/calcineurin-dependent dephosphorylation of NFATc1 during repetitive skeletal muscle activity causes NFATc1-green fluorescent protein (GFP) nuclear translocation and concentration in subnuclear NFAT foci. 35 Recent data from our laboratory demonstrated that NFATc1-GFP nuclear foci co-localize with heterochromatin regions of intense staining by DAPI that are present in the nucleus prior to NFATc1 nuclear entry and that mutation of the NFATc1 DNA-binding sites prevents entry and localization of NFATc1 in heterochromatin regions, and fluorescence in situ hybridization showed that the NFAT-regulated genes for slow and fast myosin heavy chains are not localized within the heterochromatin regions, indicating that NFATc1 foci may serve as nuclear storage sites for NFATc1. 61 Here, we showed that endogenous NFAT5 nuclear foci do not co-localize with heterochromatin regions of intense staining by DAPI. Further studies are required to test if NFAT5 within the nuclear foci is directly related to activation of its target genes and to analyze the molecular basis underlying the formation of nuclear NFAT5 foci.
NFAT-transcriptional activity was sensitive to pharmacological kinase inhibitors involved in the activation of NFAT5 but was insensitive to the calcineurin A inhibitor, FK506. This indicates a selective activation of the NFAT-luciferase reporter, likely via NFAT5, in response to osmotic stress without the involvement of Ca2+/calcineurin-dependent NFATc1–4 isoforms. NFATc1–4 and NFAT5 differ substantially in their mechanisms of activation and biological function. NFAT5 is activated by osmotic stress, 4,18,20 whereas NFATc isoforms are characteristically activated by the phosphatase calcineurin in response to increases in intracellular calcium concentration. 1,2,35 Our findings support the idea that the specific recruitment of either NFAT5 or NFATc isoforms to DNA binding sites is stimulus-dependent. 11 High glucose-dependent activation of NFAT-luciferase reporter was considerably reduced by LY294002, a PIKK inhibitor and by SB203580, a p38 MAPK inhibitor. These results are in agreement with a previous report using T cells and HEK293 cells. 53 We also found that inhibition of PIKK and p38 reduced the upregulation of NFAT5 expression by high-glucose-dependent osmotic stress. It has been reported that both a dominant negative p38 construct and SB203580 effectively inhibited a luciferase reporter gene under the control of osmotic response element in embryonic fibroblasts. 50 Chen et al. 62 found that NFAT5 associated with tonicity-responsive enhancer in a tonicity-dependent fashion in cultured rat renal medullary cells, and blockade of NFAT5 activity with the p38 inhibitor (SB203580) resulted in suppression of the osmotic induction of the Sgk1 promoter. However, it is important to interpret our results using kinase inhibitors with caution. We cannot conclude that all the observed effects on NFAT-luciferase reporter activity and upregulation of NFAT5 arise exclusively from the regulation of p38 and PIKK kinases. Although SB203580 and LY294002 are very useful, recent studies have indicated that they inhibit other protein kinases with similar or even greater potency. 63 Nevertheless, our characterization of the sensitivity of NFAT-luciferase reporter and NFAT5 protein expression to pharmacological kinase inhibitors in skeletal muscle fibers, together with previous reports, supports the idea that activation of NFAT5 by osmotic stress involves several signaling pathways, with PIKK and p38 as common regulators. 18,50,53,56 Unraveling the exact identity of signaling molecules (kinases and phosphatases), mechanisms and targets of NFAT5-regulatory pathways in skeletal muscle is the subject of ongoing investigations.
Contrary to what is typically found in cells from the renal medulla which are exposed physiologically to a hypertonic environment with osmolality values around 1000 mOsm/kg, 6,20,27 our experiments show that NFAT-dependent transcription and NFAT5 expression in skeletal muscle fibers are sensitive to moderate increases in extracellular osmolality (315–330 mOsm/kg). Importantly, serum osmolality levels >320 mOsm/kg are a common clinical finding in the plasma of patients with acute complications of diabetes. 28,29,64–66 Our findings and previous observations reported in primary cells such as lymphocytes, macrophages, fibroblasts 11 and cardiomyocytes, 17 indicate a lower threshold for NFAT5 activation in cells that are not physiologically exposed to a hypertonic environment. Altogether, these observations and our results indicate that extreme and abnormally sustained elevations of the extracellular glucose activate an osmoprotective and adaptative response in skeletal muscle via the expression and transcriptional activation of NFAT5.
In skeletal muscle fibers, acute osmotic stress affects the transverse tubular system. 30,32,67–70 The transverse tubular system is a continuation of the surface membrane, which invaginates into the muscle fiber at each sarcomeric A–I junction in mammalian muscle, and forms the main interface between the myoplasm and the extracellular environment. 71 The transverse tubules form junctions with the internal Ca2+ storage organelle of the fiber, the sarcoplasmic reticulum (SR). 58,59 These arrangements are essential for the action potential radial propagation, transverse tubular voltage sensor activation, subsequent SR Ca2+ release and muscle contraction in the process known as excitation-contraction (E–C) coupling. 60,72 Longitudinal tubules also form part of the tubular membrane system; they form junctions between adjacent transverse tubules and represent a small fraction of the total membrane area of the tubular system in vertebrates. 58,71,73,74 The role of the longitudinal tubules is to ensure that the transverse tubular system is an internally connected network within the muscle fiber. 74,75 Thus, the tubular system architecture is essential in the normal function of E–C coupling. Our results show dramatic disruption and reorganization of the tubular system after a two-day exposure to 50 mmol/L glucose. These changes are characterized by a substantial dilation of the peripheral transverse tubular system. Our results also show an increased number of junctions between adjacent transverse tubules in fibers challenged with elevated glucose for two days in culture or in fibers from diabetic mice, suggesting an increment of longitudinal tubules. These longitudinal tubular pathways within the fiber could be used as a compensatory or adaptive mechanism in the regions with substantial swelling of the transverse tubules. The transverse system changes seen here in fibers treated with ara-C and exposed to elevated glucose for two days and from untreated type 1 diabetic mice are reminiscent of the transverse tubular system disorganization seen in dedifferentiating fibers cultured for longer times without exposure to ara-C. 33,36
Long-term diabetes affects skeletal muscle function in many ways, commonly including neuropathy and atrophy. Depolarization of resting membrane potential, changes in the action potential properties and reduced force and contractility are commonly found in several muscle types assayed in animal models of type 1 and type 2 diabetes. 43,44,46 It has been shown that enzymatically dissociated muscle fibers exhibit abnormal local Ca2+ signals under relatively brief periods of osmotic stress (ranging from seconds up to 30 min treatments) induced with hypertonic solutions using elevated divalent cations, 30–32 and abnormal global Ca2+ signals have been observed in hypertonic solutions using sucrose or mannitol. 31 In this study, we did not find significant changes in resting Ca2+ levels and electrically evoked Ca2+ signals in fibers isolated from diabetic mice (serum glucose: 20–25 mmol/L). However, our results clearly show alterations in Ca2+ signals from five-day-old cultured fibers challenged with sustained (24–48 h) elevated extracellular glucose (50 mmol/L). This scenario of sustained elevated glucose concentration is likely to occur during hyperglycemic crisis in patients with uncontrolled diabetes, 28,29 particularly during HHS, a life-threatening acute metabolic complication of uncontrolled type 2 diabetes mellitus. The classical clinical picture of HHS includes history of polyuria, polydipsia, weight loss, vomiting, dehydration, weakness and mental status changes. During episodes of HHS, which is a common condition in elderly patients and is being diagnosed with increasing frequency in obese children, plasma glucose reach levels as high as 600–1300 mg/dL (33–72 mmol/L) and an increase in serum osmolality (320–380 mOsm/kg) is typically observed. HHS usually develops over days to weeks and the duration of these symptoms is generally for several days, with a prognosis of 10–20% mortality. 28,29
It is important to consider that the abnormalities observed in the present report in fibers exposed to elevated glucose may be influenced by the effects of fiber denervation as may occur in our isolated cultured muscle fibers. For example, muscles fibers from murine models of denervation, and long-term isolated muscle fiber culturing (>5 day), exhibit changes in T-tubular morphology, such as increased number of longitudinal T-tubules, 76 abnormal Ca2+ signals, 33 decreased NFATc1 nuclear localization, 77 reduced NFATc1 transcriptional activity 78 and abnormal insulin signaling and glucose transporter type 4 translocation. 79 We hypothesize that hyperexcitability typical of denervated mammalian skeletal muscle, 80–82 due in part to the expression of persistent Na+ channel currents (Nav1.5), could account for the abnormal Ca2+ signals observed in our results using five-day-old cultured fibers. In addition, there is evidence that denervation generally leads to altered contractile properties in both fast and slow muscles, and the re-expression of many embryonic/fetal genes. 81,83 It might be possible that elevated glucose amplifies the denervation process. Thus, further work exploring the relationship between diabetes and denervation/physical inactivity would be of interest.
Several mechanisms have been proposed as the primary event leading to abnormal Ca2+ signals induced by osmotic stress (i.e. tonicity-dependent dihydropteridine reductase activation, activation of mechano-sensitive channels and increased production of reactive oxygen species). 31,84,85 Regardless of the mechanism, it is clear that acute exposure to extremely elevated glucose disrupts the skeletal muscle's tubular system and triggers Ca2+ signals. Interestingly, it has been reported that in cerebral arterial myocytes isolated from type 2 diabetic mice, hyperglycemia increases Ca2+ influx and may contribute to vascular dysfunction during diabetes. 45 The above evidence and our results suggest that abnormal Ca2+ signals in muscle fibers under a variety of different conditions (i.e. type 1 versus type 2 diabetes; extreme versus moderate hyperglycemia; smooth versus skeletal myocytes) may represent a common feature of the pathophysiology of diabetes and warrants further research.
There are reports that diabetic patients admitted to the emergency room with glucose levels >1000 mg/dL and diagnosed with an episode of HHS have developed rhabdomyolysis, a potentially life-threatening syndrome characterized by the breakdown of skeletal muscle, resulting in the subsequent release of intracellular contents into the circulatory system potentially leading to renal failure. 64–66 We hypothesize that tubular system fragility and abnormal Ca2+ signals may be an important trigger of muscle damage in diabetic individuals undergoing an episode of HHS.
One goal of future research is to investigate the gene expression programs regulated by increasing levels of extracellular glucose in skeletal muscle and its potential relationship with Ca2+ signals and changes in tubular system morphology observed here. In particular, the use of animal models of long-term diabetes or animals displaying extreme hyperglycemia will be useful, since this might provide clues about the physiopathology of acute metabolic complications of diabetes. Overall, while the osmoprotective function of NFAT5 is best studied for its critical role in the physiologically hypertonic renal medulla, the NFAT5 pathway operates in skeletal muscle and other cell types in response to osmotic stress under certain pathologic conditions.
Footnotes
ACKNOWLEDGMENTS
This work was supported by NIH-NIAMS Grants R01-AR055099 and R01-AR056477 to MFS. PR was supported by the Interdisciplinary Training Program Muscle Biology T32-AR007592. The authors thank Dr Jeffery D Molkentin (Division of Molecular Cardiovascular Biology, Children's Hospital Medical Center) for providing the reporter 9X-NFAT-luc, and Dr William R Randall (Department of Pharmacology and Experimental Therapeutics, University of Maryland, School of Medicine) for providing the recombinant adenovirus of CMV/β-galactosidase.