
Abstract
Alpha-1-antitrypsin deficiency is a genetic disorder resulting in the expression of misfolded mutant protein that can polymerize and accumulate in hepatocytes, leading to liver disease in some individuals. Transgenic PiZ mice are a well-characterized model, which express human alpha-1-antitrypsin mutant Z protein (ATZ protein) and faithfully recapitulate the human liver disease. Liver tissue expressing alpha-1-antitrypsin mutant Z protein exhibits inflammation, injury and replacement of damaged cells. Fibrosis and hepatocellular carcinoma (HCC) develop in aging PiZ mice. In this study, microarray analysis was performed comparing young PiZ (ZY) mice to wild-type (WY), and indicated that there were alterations in gene expression levels that could influence a number of pathways leading to liver disease. Redox-regulating genes were up-regulated in ZY tissue, including carbonyl reductase 3 (CBR3), glutathione S-transferase alpha 1 + 2 (GSTA(1 + 2)) and glutathione S-transferase mu 3 (GSTM3). We hypothesized that oxidative stress could develop in Z mouse liver, contributing to tissue damage and disease progression with age. The results of biochemical analysis of PiZ mouse liver revealed that higher levels of reactive oxygen species (ROS) and a more oxidized, cellular redox state occurred in liver tissue from ZY mice than WY. ZY mice showed little evidence of oxidative cellular damage as assessed by protein carbonylation levels, malondialdehyde levels and 8-oxo-7,8-dihydro-2′-deoxyguanosine (8oxodG) staining. Aging liver tissue from PiZ older mice (ZO) had elevated ROS, generally lower levels of antioxidant enzymes than younger mice and evidence of cellular damage. These data indicate that oxidative stress is a contributing factor in the development of liver disease in this model of alpha-1-antitrypsin deficiency.
Introduction
Alpha-1-antitrypsin is a serine protease inhibitor, synthesized and secreted predominantly by the liver, which inhibits extracellular protease activity, protecting tissues such as the lung from damage. 1 Individuals homozygous for a genetic mutation (PiZZ) produce misfolded alpha-1-antitrypsin mutant Z protein (ATZ protein) that is only secreted at very low levels. Mutant protein accumulates in hepatocytes as polymers and as globular intracellular inclusions (‘globules’) or is degraded via proteasomal or autophagic pathways. 2,3 A subset of individuals expressing this protein develop liver disease including cirrhosis and hepatocellular carcinoma (HCC). 4,5 Transgenic mice that express human alpha-1-antitrypsin mutant Z protein, PiZ (Z) mice, recapitulate the human liver disease and exhibit inflammation, increased levels of apoptosis and autophagy, accelerated proliferation and enhanced development of hepatic progenitor cells. 3,6,7 In addition, transgenic PiZ (Z) mice are susceptible to fibrosis and develop HCC with age. 8,9
Quality control mechanisms in the endoplasmic reticulum (ER) elicit a number of cellular stress responses to protein misfolding. In one system, misfolded coagulation factor VIII protein induced the unfolded protein response (UPR) and oxidative stress, which could be ameliorated by antioxidant treatment. 10 Alpha-1-antitrypsin mutant Z protein expression activated nuclear factor kB, which is characteristic of the ER overload response, but did not trigger the well-known UPR. 11,12 Transgenic mice expressing alpha-1-antitrypsin mutant Z protein showed an increase in levels of the cytoplasmic antioxidant protein, thioredoxin, and an alteration in the redox state of the ER in liver tissue. 13 Examples of damaged and depolarized mitochondria were present in liver tissue from Z mice and could be sources of reactive oxygen species (ROS) eliciting oxidative signaling pathways. 3
Damage to macromolecules can occur with elevated levels of oxidation. ROS can react with polyunsaturated lipids resulting in the oxidation of plasma and mitochondrial membranes. A number of potentially toxic aldehydes such as malondialdehyde (MDA), 4 hydroxynonenal and 4-oxo-nonenal may form from the breakdown of polyunsaturated lipids. 14 Reactive aldehydes can form adducts with macromolecules such as proteins and DNA. 14 Some amino acid side chains in proteins may become carbonylated by reactive oxidation intermediates. Oxidation of DNA can result in the formation of a number of DNA adducts such as 8-oxo-7,8-dihydro-2′-deoxyguanosine (8oxodG). 15
Total concentrations and catalytic capacities of the glutathione S-transferases (GSTs) in the liver are high and important in antioxidant defenses and detoxification. 16,17 Reactive aldehydes, such as those formed from peroxidation of polyunsaturated fatty acids, can be conjugated to reduced glutathione (GSH) by GST enzymes and transported out of the cell. In rodent liver tissue, the A1, A2 and A3 GSTs may also act as glutathione peroxidases, catalyzing the glutathione-dependent reduction of lipid hydroperoxides generated under elevated ROS levels. 18 Elevation of cytosolic GSTs helps detoxify a number of reactive compounds including expoxides derived from environmental pollutants, aryl halides and α,β unsaturated carbonyls such as those generated from oxidation. 17,19 Mouse carbonyl reductase 3 (CBR3) has been shown to be up-regulated in oxidative stress. 20 Few studies have been done on mouse CBR3, although human CBR1 can catalyze the reduction of some reactive ketones and aldehydes formed as a result of lipid peroxidation. 21
A decline in GST activity with aging tissues in rodents has been noted by some, but not all researchers. 22–24 Lower up-regulation of GST activities in response to xenobiotics and reactive metabolites such as those generated by oxidative stress can increase the susceptibility of aging organisms to tissue damage. 22,23 Several studies have shown that the carbonylation of proteins increases with age and that DNA in aging liver tissue may be at increased risk of oxidative damage. 15,25,26
In this study, we show that gene expression levels in young PiZ (ZY) liver tissue are altered in a number of pathways involved in disease development, including pathways involved in redox regulation. A comparison of antioxidant activities, redox state and oxidative damage in ZY mice to young wild-type (WY) and older PiZ (ZO) mice indicated that oxidative stress could develop in this transgenic model of alpha-1-antitrypsin mutant Z protein misfolding and likely contributes to disease progression. The new data may suggest mechanistic links between previous studies in this model showing mitochondrial injury and the known propensity of these mice, and of humans affected with this disease, to develop HCC with age.
Materials and methods
Antibodies to the following were used: GSTμ, GSTα (Detroit R&D, Detroit, MI, USA); CBR3 (Santa Cruz Biotechnology, Santa Cruz, CA, USA); glyceraldehyde-3-phosphate dehydrogenase (GAPDH); actin (Sigma-Aldrich, St Louis, MO, USA); 8oxodG, Oxyblot kit (Millipore Corp., Temecula, CA, USA). The chemicals used were: 4-chloro-7-nitrobenzofurazane (NBDCl) (Fluka/Sigma-Aldrich); vinyl pyridine; 5–5′-dithiobis(2-nitrobenzoic acid [DTNB]); 1-chloro-2,4-dinitrobenzene (CDNB); 1,1,3,3-tetramethoxypropane; glutathione reductase (GR); oxidized glutathione (GSSG); reduced glutathione (GSH); nicotinamide adenine dinucleotide phosphate (NADPH); 1-methyl-2-phenylindole; 3,5-di-tert-butyl-4-hydroxytoluene (BHT); dihydroethidium (DHE; Sigma-Aldrich). ECL Plus was obtained from GE Health Sciences (Piscataway, NJ, USA) and primers were obtained from Sigma-Genosys (St Louis, MO, USA). Primer sequences were from Primer Bank (
Animals
Instructions in (NIH, 86–23) ‘Guide for Care and Use of Laboratory Animals’ were followed. Protocols were approved by the animal studies committees of St Louis and Washington Universities. Mice were housed with 12-h dark–light cycles and food + water ad libitum in a barrier facility. PiZ mice, described previously, were maintained on a C57Bl/6 background. 6 Wild-type mice were C57Bl/6 or 6J. Ages of mice were 3–5 months of age, young adult (Y) or 15–24 months of age, older (O). Male mice were used in all assays. Separate categories of female mice were included in the microarrays, as listed. Numbers of mice that were used included 14 WY, 14 ZY, 7 WO and 16 ZO, including the cyclosporine A (CSA)-treated. Although ZO mice can develop HCC, older mice with no evidence of HCC were used in this study. These mice were chosen as similar in overall gene expression levels, so the effects of aging could be studied on a relatively homogenous population. Mice with HCC display genetic heterogeneity in tumor regions and adjacent areas.
Histology and immunohistochemistry
Hematoxylin and eosin (H&E) staining was done on formalin-fixed, embedded liver tissues. For 8oxodG immunohistochemical staining, the protocol was as recommended (Millipore). The tissue was incubated in primary antibody (diluted 1:40) overnight at 4°C. Biotinylated (rabbit anti-goat, 1:150) and (strepavidin-HRP, 1:125) were used sequentially and slides developed with diaminobenzidine tetrahydrochloride hydrate. The percent of positive hepatocyte nuclei was determined in five microscope fields at ×400, four mouse livers/category. For DHE fluorescence, sectioned, unfixed, frozen liver tissue was incubated on a covered slide in 10 μmol/L DHE at 37°C for 30 min, and signals were obtained with a Zeiss Axioplan fluorescent microscope (Carl Zeiss Microscopy LLC, Thornwood, NY, USA), 546 and 590 nm. All microscope figures were collated in Adobe Photoshop (Adobe Systems, Inc., San Jose, CA, USA) and uniformly adjusted for signal levels, brightness, contrast or color, if necessary.
Immunoblots and carbonylation
Proteins were separated by sodium dodecyl sulfate polyacrylamide gel electrophoresis (SDS-PAGE), immunoblotted and developed using chemiluminescence. Protein carbonylation was measured in liver lysates with the OxyBlot Protein Oxidation Detection Kit, as recommended (Millipore). Protein carbonyl groups were derivatized by reaction with 2,4-dinitrophenylhydrazine and analyzed by SDS-PAGE followed by immunoblotting for DNP groups.
GST activities and glutathione assays
Total GST activities in liver homogenates were estimated from the increase in absorbance at 340 nm using 1 mmol/L GSH, 1 mmol/L CDNB, in 100 mm PO4 buffer, pH 6.5 with 1 mmol/L ethylenediaminetetraacetic acid. 28 NBDCl was also tested as a substrate. Increase in absorbance at 419 nm was measured using 0.2 mmol/L NBDCl, 0.5 mmol/L GSH in 0.1 mol/L sodium acetate buffer, pH 5. 29 Standard curves were run using equine GST. Values were calculated as U/mg protein, U = μmoles converted/min/mL.
(A) Total glutathione was measured using DTNB (Ellman's reagent) in an enzymatic recycling scheme. 30 (B) Oxidized glutathione: endogenous GSH in samples was derivatized by incubation with vinylpyridine (20 mmol/L)/reaction for 60 min at room temperature before performing the assay described in (A). 31 Standards were treated with the same protocol. CSA was supplied in the drinking water from three to 15 months of age; estimated dosage: 15 mg/kg/day.
MDA
Colorimetric determinations of MDA used 1-methyl-2-phenylindole in an HCl-based assay and values were calculated from a standard curve using 1,1,3,3-tetramethoxypropane. 32
Microarrays and quantitative realtime polymerase chain reactions
Affymetrix microarrays MOE430A + MOE430B (Affymetrix, Santa Clara, CA, USA) were processed in the Multiplexed Gene Analysis Core of the Siteman Cancer Center of Washington University Medical School (St Louis, MO, USA). Liver RNA was isolated from three-month-old mice, in the following categories: male Z, female Z, male W and female W. RNA was pooled for each category of mice (n = 4 mice per category) and reverse-transcribed into cDNA. Biotin-labeled cRNA was made, hybridized to the expression arrays that were subsequently stained, scanned and quantified using the gene chip-operating software. Microarray Suite 5 algorithms were used to generate absent/present calls and arrays were scaled to 1500. Analysis was also performed with the GeneSpring software (Agilent Technologies, Santa Clara, CA, USA), normalized to the 75th percentile and baseline adjusted to the median of all samples. Gender-matched ZY mice were compared with WY mice and genes were selected for changes that were 2.5-fold or greater in both genders (positive for up-regulated and negative for down-regulated) and for at least one present call among the four categories of mice. Quantitative realtime polymerase chain reaction (qRT-PCR) was performed using RNA that was prepared and processed as published. 9 β2 microglobulin was the reference gene. Values of Z relative to W were calculated using the Pfaffl or Livak method, expressed as 2–ΔΔCt mean + SE. Values indicate the fold increase in Z over W.
Data analyses
Densitometry was performed on the films using ImageJ (NIH//rsb.info.nih.gov/nih-image). Sigma Plot Software (SPSS, Chicago, IL, USA) was used to calculate statistical significance using unpaired t-tests to compare age-matched Z to W, ZY to ZO and WY to WO.
Results
Redox-regulating enzymes are elevated in PiZ model liver
Fold changes in expression levels of young adult Z mice compared with W mice were determined for each gender, using Affymetrix gene chip arrays MOE430A and MOE430B. Tables 1 and 2 list selected genes that were altered by 2.5-fold or greater. Several redox-regulating genes (R) were selected for an in-depth study, while other gene expression changes are discussed in a subsequent section. Up-regulated expression levels of mRNA included CBR3, glutathione S-transferase alpha 1 + 2 (GSTA(1 + 2)) and glutathione S-transferase mu 3 (GSTM3) that code for enzymes lowering cellular oxidative damage. The results from qRT-PCR assays confirmed that the relative mRNA expression levels of these enzymes were higher in ZY mice compared with WY mice. Figure 1a displays the average fold increase in mRNA levels in ZY liver tissue relative to WY liver tissue, and shows significant increases in mRNA levels for CBR3, GSTA(1 + 2) and GSTM3 that are consistent with increases seen in the microarrays. qRT-PCR assays were also performed on RNA from livers of older mice and showed that expression levels in ZO relative to WO were not significantly different for these redox-regulating genes.
Elevation of mRNA for redox-regulating enzymes in ZY mice. (a) Summary of quantitative realtime polymerase chain reactions. ZY values, shown as black bars, represent relative increases in mRNA values for ZY liver tissue above the levels for WY mice. These are means + SE of calculated fold differences in levels relative to WY. *P ≤ 0.015 CBR3, GSTA(1 + 2), GSTM3 mRNA in ZY relative to WY. (b) Fold difference in levels of mRNA in ZO mice (ZO shown as dark gray bars) relative to levels in WO mice. Differences were not significant. Number of mice: n = 4 per WY, ZY, WO and ZO. GSTA(1 + 2), glutathione S-transferase alpha 1 + 2; CBR3, carbonyl reductase 3; GSTM3, glutathione S-transferase mu 3 Gene expression up-regulated in Z mice by 2.5-fold or greater *Positive values refer to up-regulation of Z compared with W. Numbers are fold change
†Pathway: initials in this column refer to possible modulation of designated pathways: R, redox-regulation; F, fibrosis; S, Au, Ap, stress, autophagy, apoptosis; P, D, T, proliferation, progenitor-cell/development, tumor modulation; I, immune function; Tr, V, transport, vesicular transport, endosomal transport, amino acid transport, efflux; C, cytoskeletal, actin binding; M, L, B, metabolism, lipid-binding, biosynthesis Gene expression down-regulated in Z mice by 2.5 fold or greater *Negative values refer to down-regulation of Z compared with W. Numbers are fold change
†Pathway: see Table 1 legend
Protein levels of CBR3 were measured in liver homogenates, to determine if the increased mRNA levels resulted in corresponding increases in protein concentrations. ZY mice showed a significant increase in CBR3 compared with the other categories of mice, as shown in the immunoblot of Figure 2a. A plot of the density measurements of the bands in Figure 2a versus category of mice indicates approximately 2.5-fold higher levels of protein in ZY mice over WY (Figure 2b). CBR3 levels were lower in both WO and ZO mice than in the younger mice.
Higher CBR3 levels in ZY mice (a). Immunoblot of CBR3 protein levels in liver homogenates from individual animals. ^Cross-reacting protein for comparison of protein loading. (b) Quantification of chemiluminescent signals from immunoblot (unfilled bars: WY; black bars: ZY; light gray: WO; dark gray: ZO). Numbers are mean + SE. *ZY significantly different from WY, ZO, P ≤ 0.002. n = 4 WY, ZY; n = 3 WO, ZO. CBR3, carbonyl reductase 3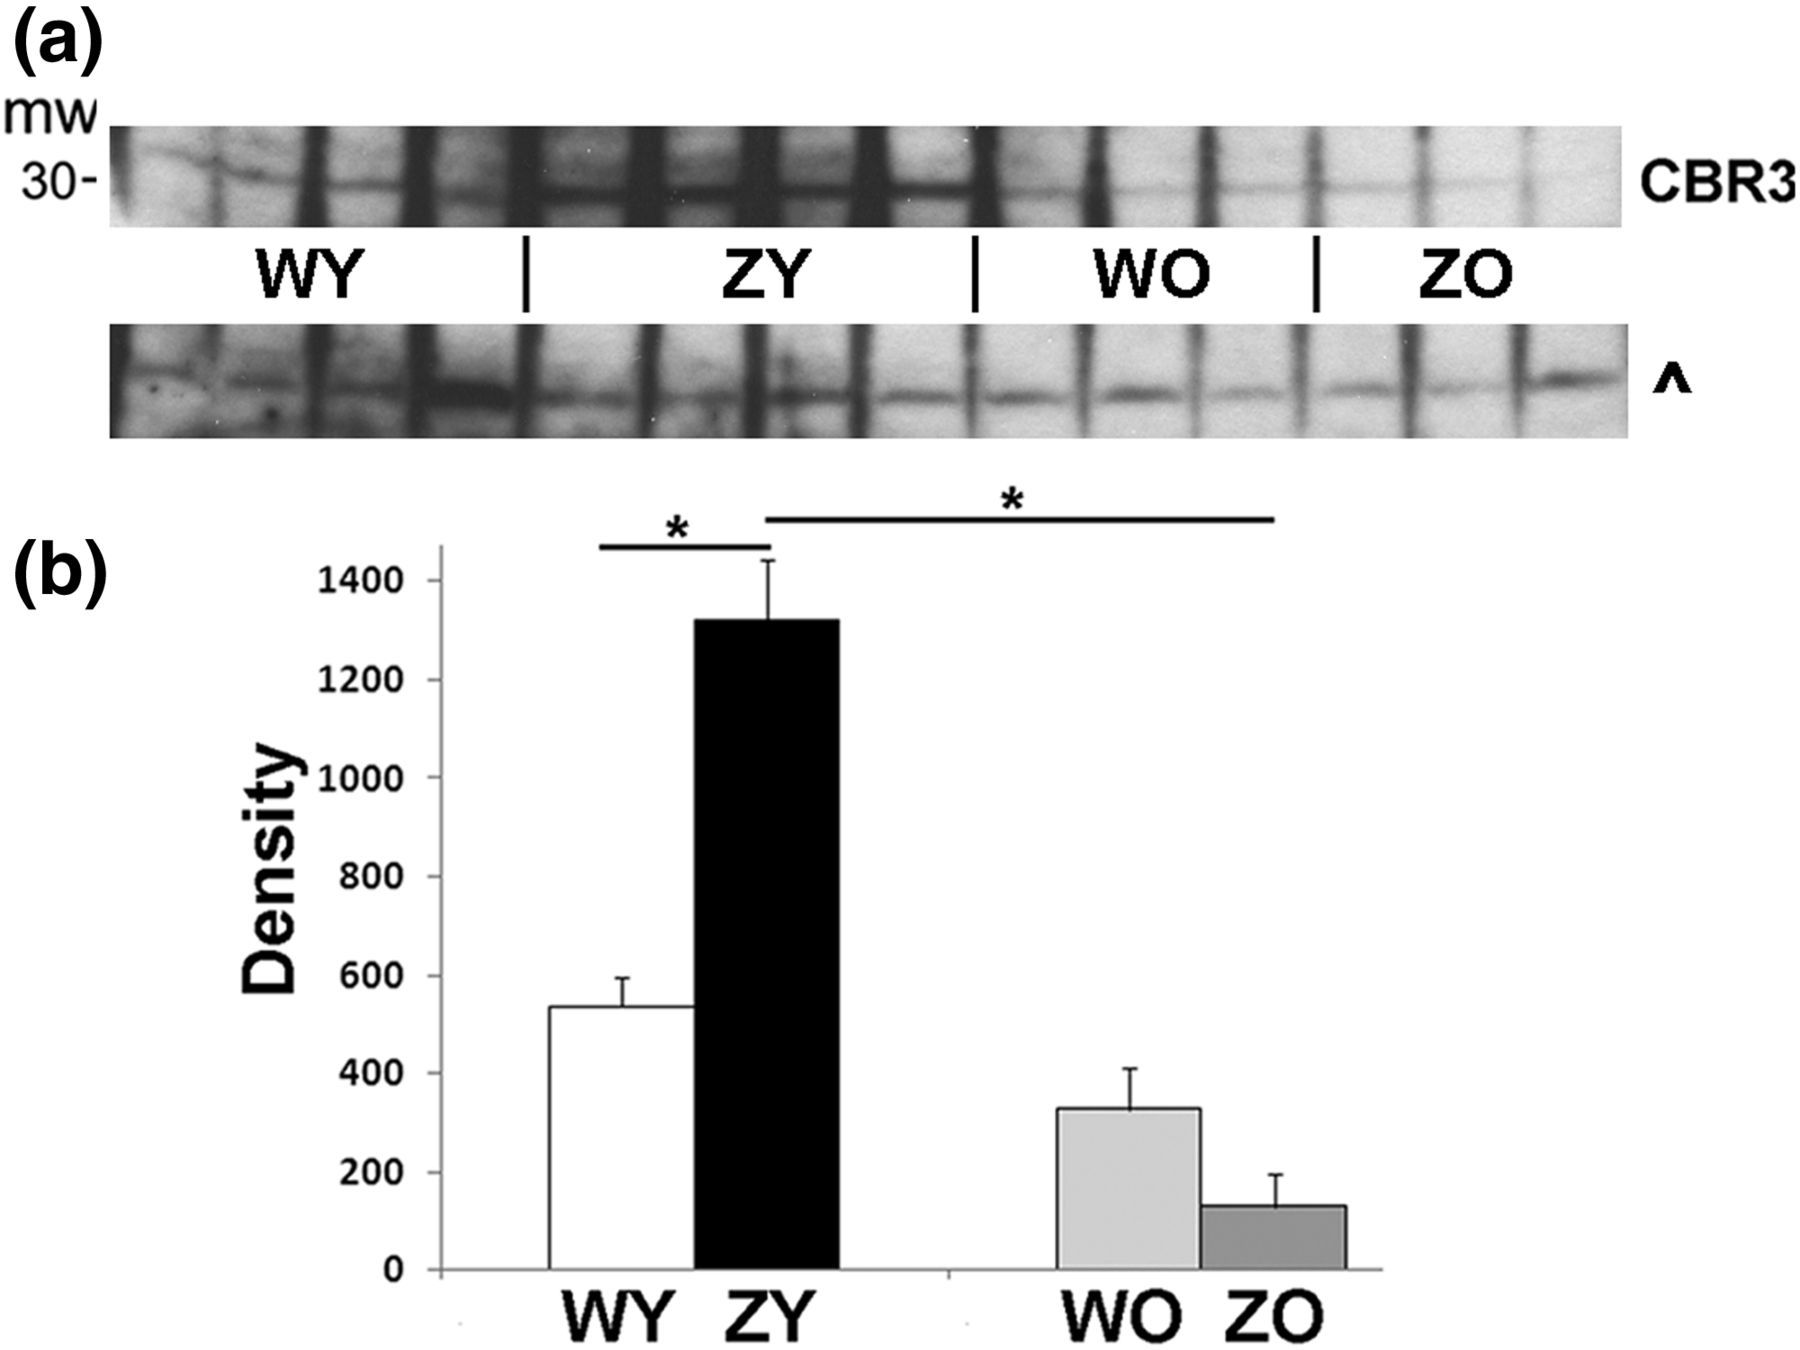
Figure 3a shows an image of an immunoblot depicting the levels of total GSTA protein in young and old mice. Note that the commercial antibody does not distinguish GSTA(1 + 2) isoenzymes from other GSTAs. Quantification of the immunoblot in Figure 3b shows that there is a significant increase in the amount of total GSTA protein in ZY livers compared with WY. (#Marks weak signal for WO sample in this blot that was not quantified.) No significant differences were noted in comparisons of young mice to old mice.
(a) Greater total GSTA concentrations in ZY mice than in WY mice. Immunoblots of total GSTA protein concentrations. Samples from young mice were run on the same immunoblot and are arranged adjacent to each other for display. GAPDH immunoblotting was done to show protein loading levels. #Outlier, not used in calculation. (b) Quantification of immunoblots. Symbols as in Figure 2. *ZY significantly different from WY, P < 0.001. n = 4 WY, ZY; n = 6, WO, ZO. (c) Total GSTM levels similar in ZY and WY mice. Immunoblot of total GSTM protein levels in each category of mice. ^Cross-reacting protein showing equivalent amounts loaded. (d) Quantification of immunoblot bands. *ZY significantly higher than ZO, P ≤ 0.05. n = 6 WY, ZY, WO, ZO. GSTA, glutathione S-transferase alpha; GAPDH, glyceraldehyde-3-phosphate dehydrogenase; GSTM, glutathione S-transferase mu
Immunoblots performed on total GSTM protein (Figure 3c) and the quantification in Figure 3d show no significant differences in the amount of total GSTM protein between ZY and WY mice. However, ZY mice appear to have a significantly higher level of GSTM protein than ZO (Figure 3c and d). GSTM3, measured at the mRNA level, may comprise a small fraction of the total pool of GSTM isozymes in representative species of mice. 33 Although the mRNA for GSTM3 is up-regulated in ZY mice compared with WY mice, this increase is not detected at the protein level by using the antibody to total GSTM.
Enzymatic activities consistent with response to elevated oxidative state in PiZ model liver
Enzymatic activities of GST were measured in liver homogenates from the young and old mice to determine if the changes in levels of some isozymes would potentially affect cellular antioxidant activity. CDNB was used as a substrate to assay the overall activity of soluble, cytosolic GSTs (Figure 4a).
28,29,34,35
This assay showed an increase in total GST activity in ZY animals over both WY and ZO mice. Differences in activity were also compared using the substrate NBD-Cl which is converted by most GSTA classes but shows less reactivity with GSTM classes (Figure 4b).
29,36
A significantly higher level of activity was seen in ZY over WY mice. WY had higher activity than the older counterpart WO and similarly, ZY was higher than ZO.
Greater GST enzymatic activity in ZY mice. (a) Estimate of total GST enzymatic activity with the substrate CDNB. *ZY significantly different from WY, ZO, P ≤ 0.01. (b) Estimate of GST activity with NBDCl as the substrate. *ZY significantly different from WY, ZO, P ≤ 0.01; *WY significantly different from WO, P ≤ 0.05. n = 6 WY, ZY, WO, ZO. GST, glutathione S-transferase; NBDCl, 4-chloro-7-nitrobenzofurazane; CDNB, 1-chloro-2,4-dinitrobenzene
Glutathione levels in PiZ model liver
Glutathione is very abundant in liver tissue and the levels of GSH and GSSG, the reduced and oxidized form of glutathione, are often used as a measure of the cellular oxidative state.
37,38
Total glutathione levels (nmol/mg tissue) were measured in livers from all the categories of mice and no significant differences were seen (Figure 5a). As depicted in Figure 5b, WY mice showed significantly lower levels of GSSG (nmol/mg tissue) compared with ZY and WO categories of mice, indicating that both protein misfolding and aging can increase oxidative parameters. Liver tissue from PiZ mice treated with CSA was also analyzed. It has been previously shown that mitochondrial injury and depolarization are part of the spectrum of liver injury in this disease and CSA treatment of Z mice reduced this injury.
3
CSA treatment did not significantly alter the redox state of liver tissue from Z mice compared with the control (Cntrl). Neither the Cntrl nor the CSA-treated groups were significantly different from the ZO category, P = 0.067 and 0.61, respectively. The Cntrl group showed a significantly higher mean value of GSSG than WY with P = 0.021.
Low levels of GSSG in WY mice. (a) Levels of total glutathione. Additional symbols: Cntrl, control Z mice 15 months: dark gray bars with solid black outline; CSA, age-matched, cyclosporine A treated Z mice: dark gray bars with dashed black outline. CSA was supplied in the drinking water from three to 15 months of age; estimated dosage:15 mg/kg/day. (b) Levels of GSSG were significantly lower in *WY mice than ZY or WO, with P ≤ 0.05. n = (5–6) WY, ZY, WO, ZO, Cntrl, CSA for both (a) and (b). GSSG, oxidized glutathione; CSA, cyclosporine A
ROS are detectable in livers from PiZ mice
To assess the general level of ROS, the fluorescent dye, DHE, was used on freshly frozen liver sections from young and old mice. This dye intercalates into DNA and shows a red fluorescence when oxidized. Red fluorescent signals were noticeably higher in ZY than in WY and high in ZO as well as WO, as shown in Figure 6, indicating an increased oxidative state in ZY and in the aging liver tissues.
ROS levels are lowest in WY mice. Estimate of ROS levels from red fluorescence observed in liver tissue treated with DHE. n = 2 WY, ZY, WO, ZO. ROS, reactive oxygen species; DHE, dihydroethidium. (A color version of this figure is available in the online journal)
Hepatocytes producing alpha-1-antitrypsin mutant Z protein can accumulate polymerized protein in globules. Generally, globules are more abundant in ZY than ZO tissues (see Figure 8c and d for examples). As shown in Supplementary Figure 1 (please see
Protein carbonylation in the PiZ liver
Protein carbonylation, resulting from the oxidation of amino acid side chains, was detected in the immunoblots in Figure 7a. Quantification of the immunoblots (Figure 7b) indicated that there were no significant differences in carbonylation levels between WY and ZY categories of mice while older mice showed greater levels of carbonylation. ZY mice were significantly lower in carbonylation than ZO mice. WY showed a trend towards lower carbonylation concentrations than WO but was not significantly different. Similar signal intensity and range of molecular weights were seen for ZO and WO carbonylated proteins.
(a) Increase in protein carbonylation with age. Immunoblots to detect proteins modified by carbonyl groups. Negative control reactions, included in each immunoblot, did not show any signals (data not shown). ^Equivalent amounts of protein were loaded per lane, shown in this separate immunoblot for actin. (b) Quantification: total density of proteins per vertical lane was estimated in ImageJ. Values are plotted as mean + SE. *ZO significantly different from ZY, P ≤ 0.04. n = 3 WY, ZY, WO, ZO. (c) Malondialdehyde levels highest in ZO mice. Free malondialdehyde levels were measured colorimetrically in liver tissue by reaction with 1-methyl-2-phenylindole. *ZO levels significantly higher than ZY and WO levels. P ≤ 0.05. n = 4 WY, ZY, WO, ZO
MDA in the PiZ liver
Free MDA is often used as a marker of lipid peroxidation levels. 14 Figure 7c shows the levels of free MDA present in the livers. In general, similar to other studies, this assay gave relatively low levels of free MDA for the young mice. 32 MDA levels in ZO mice were significantly higher (approximately 1.7–1.8 fold) than levels in WO and ZY mice.
DNA damage in the PiZ liver
Immunohistochemistry was used to determine if 8oxodG was present in hepatocyte nuclei from young or old mice, as seen in Figure 8. Photomicrographs of liver tissue stained with H&E are shown in Figure 8a–d to clearly demonstrate the unusual cytoarchitecture of liver from the transgenic mice compared with the wild type. In the ZY liver, a number of globules are seen on the left side of the boundary line in Figure 8c. In Figure 8d, arrows point to several globules in ZO tissue. Because the antibody to 8oxodG detects 8-hydroxyguanosine as well as 8oxodG in DNA, staining can sometimes be seen in the cytoplasm but is most prominent in hepatocyte nuclei (Figure 8e–h). Staining rarely occurred in WY liver, was low in ZY tissue and was considerably variable in older tissue. Quantification of nuclear staining in individual tissues showed that levels were below 7% for young tissue whereas some older mice showed higher levels, up to 29% for ZO tissue.
Photomicrographs showing hepatic cytoarchitecture/H&E staining (a–d) and 8oxodG staining (e–h). (a) WY. (b) WO. (c) ZY, globular-rich area to left of black outline. (d) ZO, arrows show several examples of globules. Examples of staining for 8oxodG: (e) no clear nuclear stain, WY. (f) WO, staining of several nuclei, counterstain hematoxylin. (g) ZY with light differential nuclear stain in lower middle. (h) ZO with strongly stained nuclei, hematoxylin counterstain. (i) Quantification of the nuclear staining for 8oxodG. x-axis numbers refer to individual animals in each category. H&E, hematoxylin and eosin; 8oxodG, 8-oxo-7,8-dihydro-2′-deoxyguanosine. (A color version of this figure is avilable in the online journal)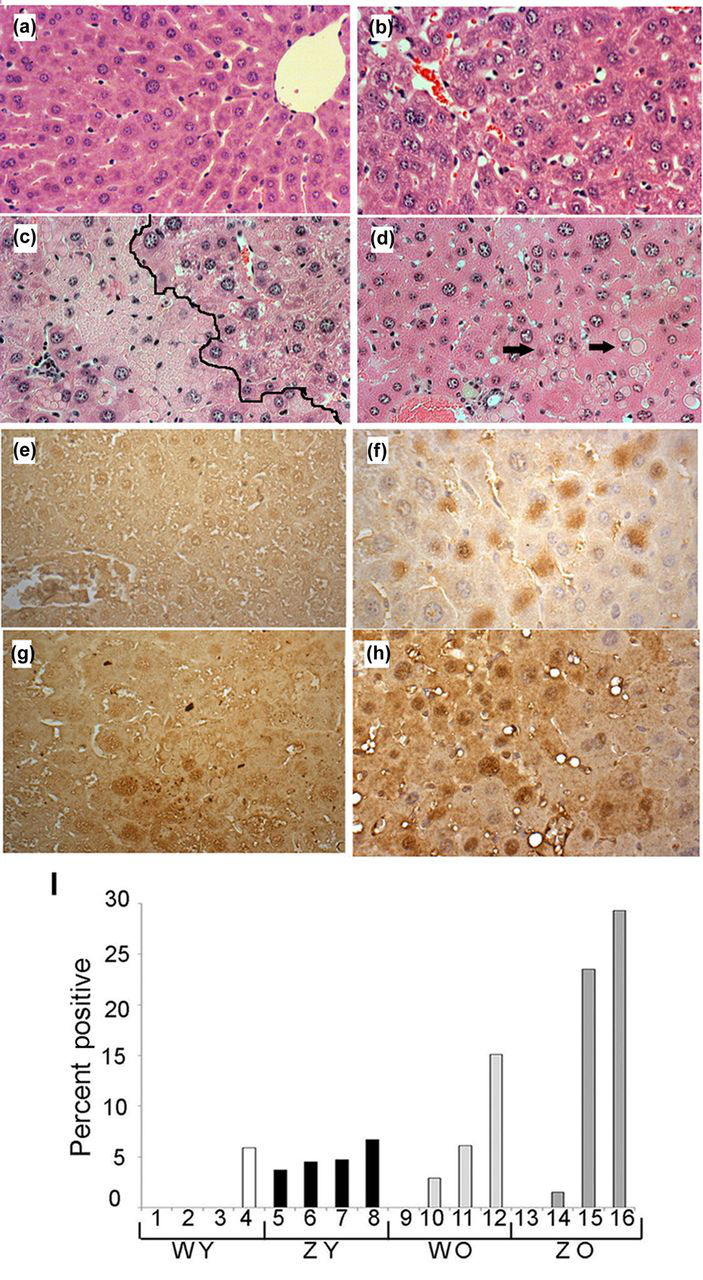
Selected microarray data on PiZ liver
In this initial survey, genes were selected for gender-independent expression levels, using pooled tissue from age-and sex-matched animals and fold changes of 2.5 or greater (Tables 1 and 2). A number of altered pathways have been identified through Gene Ontology and Entrez Gene data banks. Selected genes have been assigned to one general pathway, although they may play multiple roles and pathways can overlap in disease development. While a few alterations in expression levels in Z liver tissues were high, for example, approximately a 30-fold change for Mmp12 and 14-fold for Mmp13, most changes were more modest. Altered fibrosis-related (F) genes include up-regulated collagens, which can increase the extracellular matrix and the metallopeptidase Mmp13, that may degrade or remodel it. One of the injury response genes, Gpnmb, increased by approximately 20-fold, can co-localize with LC3 and appears to link macroautophagy (Au) to phagocytosis. 39 Several stress response genes (S) are involved in transcription, including Atf3, which may affect proliferation and Nupr1 which may modulate autophagy, programmed cell death or the cell cycle. Changes in cyclin D1, involved in the cell cycle and shown previously to be up-regulated in Z mice, are consistent with known increases in BrdU uptake. 6,9 Alphafetoprotein, Afp, which increased approximately 13-fold, has been found to be elevated in some liver pathologies and can be expressed in oval cells, consistent with research showing increased hepatic progenitor cell production in Z transgenics. 7 Several genes may be involved in regulation of vesicular traffic through the Golgi–endosomal–lysosomal pathways (Tr,V). This includes the phospholipid-binding protein annexin A2 and an interacting partner S100a11, as well as the adaptor family members Ap1s3 and Ap3b2, which show up-regulation and down-regulation, respectively. Pathways involved in cytoskeleton rearrangements (C), immune responses (I) and metabolic demands (M, L, B) are also altered in the transgenic Z mice.
Discussion
Misfolded human alpha-1-antitrypsin mutant Z protein expression in mouse liver leads to elevated expression of mRNAs in certain disease pathways, tissue injury and oxidative stress. The mechanisms that trigger oxidative stress as a result of the expression of mutant Z protein are unknown and the effects of different levels of monomer, non-globular polymer or globular forms on the development of oxidative stress are not clear. Globular content can vary and previous studies have shown that a significant amount of mutant Z protein can accumulate in non-globular forms. 40 In ZO mice, the additional problems of lowered antioxidant protection from oxidative stress and long-term tissue injury must be considered along with the accumulation of different forms of mutant Z protein, when examining the mechanisms that contribute to fibrosis and HCC. The inflammation that also occurs with mutant Z protein expression may contribute to ROS generation.
Although ZY livers have increased levels of antioxidant enzymes, they still have elevated ROS levels and greater levels of GSSG compared with WY mice. In another study (under different conditions), the cytoplasmic GSH/GSSG ratio in PiZ mouse livers shifted to a somewhat more oxidized state, although the change was not significant. 13 Although previous studies showed that CSA treatment inhibited mitochondrial depolarization that could play a role in ROS production and improved resistance to environmental stressors, in our study CSA did not lower GSSG levels in Z tissue. This suggested that the CSA effects are not related to inhibition of oxidative stress. 3 In some systems, CSA treatment itself may affect a number of cellular functions and contribute to oxidative stress. 41
An increase in GSSG concentrations has been noted in rodent liver with aging and a decrease in the GSH/GSSG ratio. 37,42 Restoration of steady-state GSH levels in liver is impaired in older animals following depletion due to reactive drugs or metabolites. 22 There is some evidence that older animals may have alterations in kinetic properties of GSH synthesizing enzymes. 37,42
Levels of mRNA for CBR3, GSTA(1 + 2) and GSTM3, protein concentrations of CBR3 and GSTA and GST activity levels are higher in ZY than WY mice. Levels of mRNA coding for GSTM3 and GSTA(1 + 2) vary with diet and the environment and can increase with oxidative stress. 33,43 Nrf2, one transcription factor controlling levels of a number of antioxidant and antielectrophilic genes, can regulate expression of these GSTs and may regulate mouse CBR3, as it does for human CBR3. 44,45 Constitutive levels of mRNA for GSTA(1 + 2) and GSTM3 are much lower in Nrf2−/− mice. 44
In comparison with the ZY mice, older mice show, for the most part, lower overall activities of GSTs. In other work, a number of mRNA expression levels for the isoenzymes of the GSTs showed significant decreases in expression with age while others had no change. 43 Nrf2 and expression levels of Nrf2 target genes have been reported to decrease during aging, which would result in reduced antioxidant protection. 43,46
ZO mice show greater levels of carbonylation of proteins, higher levels of MDA and a trend towards higher levels of 8oxodG compared with ZY, likely indicating a greater susceptibility to oxidative stress. Carbonylation increases with age, which may be due to factors such as a lesser capacity of the cell to handle protein degradation or a greater accumulation of reactive intermediates as endogenous antioxidant systems decrease in activity. 26 Several studies show that levels of 8oxodG increase with age in mouse liver, although some do not find an increase. 25,47 An elevated oxidative state can result in a number of different lesions in DNA which could contribute to the risk for tumor development. 15 Although ZO mice showed more oxidative damage than ZY mice, the ZO mice that we used were relatively robust with greater representation in the lower range of the broad 15–24 months age category. Although ZO mice have shown about a 68% incidence of HCC in this approximate age range, ZO mice chosen for this study had not developed HCC. 9 In future work, we will examine dysplastic tissue and HCC in ZO livers to better understand the effects of oxidative stress on the development of HCC in this cohort of older mice.
Taken together, our data indicate that oxidative stress is a contributing factor in the development of liver disease in this model of alpha-1-antitrypsin deficiency. Treatment of ZY mice with antioxidants may ameliorate the oxidative stress and associated tissue injury, as was shown in the Factor VIII, misfolded protein model. 10 Furthermore, the long-term regulation of antioxidant levels, using for example, vitamin E or compounds known to elevate Nrf2, has the potential to lower the rate of progression to HCC in Z livers. In humans, alpha-1-antitrypsin deficiency has a highly variable clinical phenotype, and it has been proposed that disease progression is heavily influenced by as yet undescribed genetic modifiers. 4 Our data suggest that it might be fruitful to examine allelic variations of genes in pathways related to oxidative stress defense, as potential genetic modifiers to be considered in designing therapeutic interventions.
Previously, the Affymetrix MOE430A array was used on a novel transgenic mouse model with inducible hepatocyte expression of alpha-1-antitrypsin mutant Z protein. 12 In our study, we have used both MOE430A and MOE430B arrays on the Z (PiZ) mouse. Alterations in expression have been identified that influence pathways contributing to liver disease such as HCC, which develops with age in both genders. 9 This survey did not focus on expression levels altered by gender, although it has been shown previously that hormonal expression in ZY males influences liver phenotype. 6 The identification of potential changes in gene expression from these arrays should stimulate further analysis of disease development.
Footnotes
ACKNOWLEDGEMENTS
We are indebted to Dr David Rudnick for advice on the microarray design and analysis and for his critique of the data. We appreciate the invaluable mentoring and leadership of Dr David Perlmutter. This work was supported by NIH DK-067489 (JHT), Alpha-1 Foundation, Liver Center at St Louis University, Washington University Digestive Disease Research Core Center, NIH PO3 DK52574, Multiplexed Gene Analysis Core of Siteman Cancer Center at Washington University School of Medicine & Barnes-Jewish Hospital.