
Abstract
We isolated apigenin (5,7,4’-trihydroxy flavone) from ethanolic extract of Lycopodium clavatum (LC) used as a homeopathic mother tincture for treatment of various diseases. We assessed the anticancer potentials of the compound using human malignant melanoma cell line A375 and a lung carcinoma cell line A549 and focussed on its putative molecular mechanism of action on apoptosis induction. We examined the cytotoxicity of apigenin in both cancer cells and normal peripheral blood mononuclear cells (PBMC). A375 cells were more prone to apigenin-induced apoptosis, as compared with A549 cells after 24 h of treatment, while PBMC showed little or no cytotoxicity to apigenin. We also evaluated the effects of apigenin on interaction with DNA by comparative analysis of circular dichroism spectral data and melting temperature profiles (Tm) of calf thymus DNA (CT-DNA) treated with or without apigenin. Reactive oxygen species (ROS) accumulation in mitochondria, super-oxide dismutase and total thiol group (GSH) activities were also analyzed. The apoptotic process involved mitochondrial pathway associated with apigenin-DNA interaction, DNA fragmentation, ROS accumulation, cytochrome c (cyt c) release and mitochondrial transmembrane potential depolarization, Bax, caspase 3, 9, PARP, up-regulation, Bcl-2 down-regulation and down-regulation of cyt c in the mitochondrial fraction. Results of mitochondrial inner membrane swelling measurements, intracellular ADP/ATP ratio and ATPase activity showed that in A549 cells, apigenin did not appear to directly target the mitochondrial oxidative phosphorylation system but rather acted at an upstream step to activate the mitochondrial apoptotic pathway. However, apigenin could directly target and impair mitochondrial function in A375 cells by breaking down their oxidative phosphorylation system. Collectively, these results suggest that apigenin exhibits anticancer potential in A375 and A549 cells that may be mediated through DNA interaction, damage and mitochondrial dysfunction either by direct or indirect action on mitochondrial oxidative phosphorylation system.
Introduction
Cancer is one of the most serious clinical problems worldwide. Most prevalent forms like malignant melanoma, lung carcinoma, breast cancer, etc. are one of the most challenging problems in clinical oncology. In fact, management of melanoma has now become a public health issue for its high metastatic potential and resistance toward chemotherapy and radiotherapy. 1 Lung cancer is one such leading cause of death for adults in the USA 2 and non-small-cell-lung cancer being the most common type, accounts for 70–80% of occurrences. 2 These malignancies, especially in their advanced stages, remain with poor prognosis largely owing to its unresponsiveness to recently available chemotherapeutic reagents which have been attributed to development of resistance to apoptosis. 3 Therefore, novel and effective chemotherapeutic agents are highly desired, particularly those derived from natural products because of their intrinsic advantages. 4
One critical hallmark of cancer cells is their resistance to apoptosis induction. It is characterized by activation of caspase family of cysteine proteases followed by cell morphological changes like cell shrinkage, membrane blebbing, chromatin condensation and breakdown of cells into apoptotic bodies. Apoptosis can be activated either by mitochondrial dependent (intrinsic) pathway or death receptor (extrinsic) pathway, or both. 5 The intrinsic pathway is involved in the alteration of mitochondrial membrane potentials, the release of cytochrome c (cyt c) into the cytosol, and the activation of caspase-9. It also seems that the mitochondrial control mechanisms underlying apoptosis are involved in the disruption of mitochondrial membrane permeabilization, with alteration in their transition pores, leading to the release of protein effectors. 6
Oxidative phosphorylation occurs across the inner mitochondrial membrane, resulting in the synthesis of ATP and maintenance of the mitochondrial transmembrane potential (ΔΨm). One of the earliest events in apoptosis is believed to be the breakdown in oxidative phosphorylation and subsequently a decrease in ATP and loss of ΔΨm. 7 Reactive oxygen species (ROS), which are the by-products of normal cellular oxidative processes, have been suggested as regulating the process involved in the initiation of apop-totic signalling. Tan et al. 8 showed that an increase in generation of ROS in the mitochondria induces cyt c release from mitochondria to the cytosol, mediating the apoptotic process.
Herbal remedies and complementary alternative medicines are increasingly becoming popular in cancer chemo-prevention and are used throughout the world in an effort to discover new therapeutic arsenal that lacks the toxic side-effects associated with current chemotherapeutic agents. 9 Lycopodium clavatum (LC) commonly known as ‘club moss’ is a creeping perennial plant found in almost all parts of the world and is considered a great medicinal plant used in many traditional and alternative medicines including homeopathy. The spores are of major medicinal value and their alcoholic extract is commonly used as homeopathic mother tincture. The crude ethanolic extract of LC was reported to have certain alkaloids, lycopodine being the major active principle. Lycopodine has also been shown to inhibit proliferation of HeLa cells through induction of apoptosis via caspase-3 activation. 10
Flavonoids are a class of polyphenolic compounds which display a variety of biological activities. There has been recent interest in using flavonoid derivatives therapeutically as anticancer drugs. Many such flavones like apigenin, genstein, luteolin, etc. were earlier reported to show antipro-liferative effects through apoptosis induction in various cancers like hepatocellular, breast, colon and cervical cancers.11–13 Recently, flavonoids have also been reported to have antiproliferative action in multiple myeloma cells. 14 Even, combination therapy with two different flavonoids has shown antiproliferative effects by blocking the PI3/AKT pathway in pancreatic cancer cells. 15 Recent reports have also shown that these flavones could be even extracted from edible tropical plants.16,17 Although lycopodine of LC has been assigned as its major alkaloid active component, to our knowledge, no systematic study has been done so far to isolate any flavonoid or its derivatives contained in the ethanolic extract of LC. Even, studies regarding the chemical composition of flavonoids present in LC lack proper authenticity except for only one website 18 that suggested the presence of some flavones like apigenin, saponin, etc. Also, to the best of our knowledge, no systematic study related to the apoptotic signaling pathway in relation to the mitochondrial targeting associated with impairment in the mitochondrial functions during apoptosis induction has so far been explored using specific flavonoid isolated from LC.
So the objectives of our study were (i) to isolate and identify the major flavonoid derivative from crude ethanolic extract of LC (ii) to examine its possible apoptosis-inducing potential in two different types of human cancer cell lines, namely, A375 and A549, keeping normal PBMC as controls; and (iii) to evaluate the direct role of mitochondria in inducing possible mitochondria-mediated apoptotic pathways.
Materials and methods
Chemicals and reagents
Dulbecco's modified Eagle's medium (DMEM), fetal bovine serum, penicillin, streptomycin and neomycin (PSN) antibiotic, trypsin and ethylenediaminetetraaceticacid (EDTA) were purchased from Gibco BRL (Grand Island, NY, USA). Tissue culture plastic wares were obtained from BD Bio-science (San Jose, CA, USA). All organic solvents used were of high-performance liquid chromatography grade. Propidium iodide (PI), DAPI (4’,6’-diamidino-2 phenyl indole), MTT (3-(4,5-dimethyl-thiazol-2-yl)-2,5-diphenyltetrazolium bromide) and all other chemicals used were purchased from Sigma Chemical Co (St Louis, MO, USA). All the chemicals used were of analytical grade and procured from Sigma.
Isolation of bioactive fraction from crude ethanolic extract of LC and identification of 5,7,4’- trihydroxy flavone (apigenin)
The evaporated and dried residue was loaded onto a column packed with silica gel (230–400 μm mesh) and eluted with chloroform, chloroform–methanol and chloro-form–acetonitrile solvent systems. A total of 16 fractions, 200 mL each, were collected. These were pooled, based on similar thin-layer chromatograms, to get four fractions (F1–F4). These fractions were screened for presence of flavones by ES-MS mass spectroscopic analysis.
Isolated F2 bioactive fraction was further subjected to column chromatography over silica gel (230–400 μm mesh). Elution was done with chloroform–methanol to get four F2 subfractions (F2.1–F2.4). These four subfractions were evaluated using thin-layer chromatography (TLC) using mobile phase methanol:chloroform:19:1 and visualized with ultraviolet (UV) (254 and 365 nm) and iodine vapors. Based on TLC profiles, fractions with similar compositions (F2.2 and F2.3 each of which showed 1 clear spot) were pooled together and divided into two parts. The major part was concentrated in vacuum desiccators and the minor part was subjected for ES-MS mass spectroscopic analysis (f). After confirming with results of ES-MS mass spectroscopy, repeated TLC of pooled fraction of F2.2 and F2.3 using above-mentioned solvent ratio yielded pure isolate of yellowish-brown colored 5,7,4’-trihydroxy flavone (apigenin). Total extraction procedure and ES-MS mass spectroscopic images are shown in Figures 1 and Figures 2 respectively. The molecular weight of the bioactive compound was finally confirmed by comparing the data obtained from studies of nuclear magnetic resonance -1H and fourier transform infrared spectroscopy with that of the present study.

Bioactivity-guided isolation of apigenin (5,7,4’-trihydroxy flavone) from crude ethanolic extract of Lycopodium clavatum (LC) by silica gel column chromatography

Mass spectroscopic studies of isolation of apigenin from Lycopodium clavatum (LC) ethanolic extract. (a) Presence of flavonoid in impure form represented by mass spectra through initial screening. (b) Mass spectra and structure of apigenin (5,7,4’-trihydroxy flavone)
Quantitative estimation of total flavone content in LC by aluminum chloride colorimetric method
Ethanolic extract of LC (homeopathic mother tincture) was procured from Boiron laboratory (Lyon, France) and then evaporated to dryness at <50°C to form a thick dry residue. Estimation of total flavone content was done using aluminum chloride colorimetric method according to the standard protocol. 21 Total flavone content was expressed as g% (g quercetin per 100 g of dried plant material).
Apigenin solutions
Apigenin is usually not soluble in aqueous medium. In this study, the desired amount of apigenin was mixed with DMEM and then further diluted (20–250μg/mL) in the same. They were sonicated before use and stored at -20°C. Apigenin solutions were warmed to 25°C before use.
Evaluation of antioxidant activity of apigenin
Different concentrations of apigenin were prepared and added to reaction mixture 2,2-diphenyl-1-picrylhydrazyl (DPPH) according to the procedure described in earlier studies. 22 Percentage of scavenging activity was calculated according to the standard procedure. 23 NO (nitric oxide) scavenging activity of different concentrations of apigenin was measured by the method using Griess reagent. 24
Cell-culture procedure
Human A375 skin malignant melanoma and A549 lung carcinoma cell lines were procured from National Centre for Cell Science (NCCS), Pune, India to determine and grew them at 37°C in 5% carbon dioxide (CO2) atmosphere in DMEM supplemented with 10% fetal bovine serum and 1% antibiotic (PSN). For experimental studies, the cells were grown to 80–90% confluence, harvested with ice-cold buffer saline (PBS) and plated at desired density. Cells were allowed to re-equilibrate for 24 h before any treatment. Normal peripheral blood mononuclear cells (PBMC) were also cultured and exposed to apigenin to test their probable cytotoxic effects.
Cell viability assay and selection of doses
A375 and A549 cells were dispensed in 96-well flat bottom microtiter plates at a density of 106 cells per well. After overnight incubation, cells were treated with various concentrations of apigenin ranging from 20 to 250 μg/mL for 24 and 48 h, respectively.25,26 In order to determine the effects of apigenin in A375, A549 and normal PBMC cells, cell viability test was performed using MTT assay.27,28 The intracellular formazan crystals formed were solubilized with acidic isopropanol and the absorbance of the solution was measured at 595 nm using an enzyme-linked immuno-sorbent assay reader (Multiscan EX, Thermo Electron Corporation, Waltham, MA, USA). Percentage viability was calculated as (OD of drug-treated sample/OD of control sample) × 100.
Three different doses of apigenin were selected for each cell line for further experiments based on their respective IC50 values. For A375, 20, 50 and 80 μg/mL and in case of A549, 30, 60 and 90 μg/mL concentrations were chosen for further experimental procedures. Control groups received only media without any apigenin treatment.
Flow cytometric analysis of early and late apoptosis by Annexin V-FITC and PI staining
In order to evaluate apoptosis and necrosis, externalization of phosphotidylserine (PS) during apoptosis and leakage from necrotic cells were observed by Annexin V-FITC/PI dual staining using standard protocol. 29 Differentiation of cell population was done on flow cytometer (FACS caliber, BD Bioscience) and was assessed as: (a) viable cancer cells (Annexin - ve; PI - ve), (b) early apoptotic cancer cells (Annexin +ve; PI - ve), (c) late apoptotic cancer cells (Annexin +ve; PI +ve) and (d) necrotic cells (PI +ve). Samples were analyzed in Cyflogic v.1.2.1 software (CyFlo Ltd, Turku, Finland) with FL1/FL2 band pass filters for the detection of Annexin V-FITC and PI simultaneously. Each determination is based on mean fluorescence intensity of 10,000 events.
Apigenin-induced morphological changes and determination of apoptosis
Apoptotic cells were visualized by fluorescence microscope. A375 and A549 cells were seeded in six-well plates with the above-indicated concentrations of apigenin at 24 h for both cells and then stained separately with 10 μg/mL of DAPI for 10 min at 37°C. After washing with ice-cold PBS, the stained cells were imaged using fluorescence microscope (Leica, Wetzlar, Germany).
Determination of thermal denaturation
In temperature-scanning spectroscopy, absorbance profiles, which describe the thermal denaturation of DNA, were obtained with a SHIMADZU UV-1700 spectrophotometer (East Lyme, CT, USA) fitted with a temperature program to control the speed of temperature change in the denaturation experiments. The sample cells contained 4 mmol/L calf thymus DNA (CT-DNA) alone, and DNA plus 100 μmol/L apigenin. The recording chart read the temperature and absorbance differences between the reference cuvettes (which were the same as the sample except without CT-DNA) and the sample cuvettes at 260 nm.
Analysis of interaction of apigenin with calf thymus DNA (CT-DNA) by CD spectra
Circular dichroism spectra showing changes in the normal B-form CT-DNA, in the region (200 - 450 nm) were monitored using 1 cm path length rectangular quartz cuvette (Jasco Spectropolarimeter; model PC controlled /-815; Jasco International Co Ltd; equipped with a temperature controller and thermal programmer PFO 425L/15, Tokyo, Japan). The CT-DNA and apigenin concentration used in the experiment were 1 mmol/L and 100 μmol/L, respectively. Experiments were conducted at 37°C. 29
DNA fragmentation assay
DNA of A375 and A549 untreated control cells and apigenin-treated (with indicated concentrations) cells were isolated by standardized phenol–chloroform method and DNA gel electrophoresis was performed in 1% agarose gel. 10
Preparation of cytosolic and mitochondrial fractions
A375 and A549 cells (90% confluent) were collected, washed with ice-cold PBS, re-suspended in buffer A (10 mmol/L Tris-MOPS pH 7.4, 200 mmol/L sucrose, 1 mmol/L EGTA, 1 mg/mL bovine serum albumin [BSA], 1 mmol/L dithiothreitol [DTT]) and lysed by homogenization. The suspension was centrifuged at 1000 g for 10 min at 4°C. The resulting supernatant was centrifuged at 10,000 g for 15 min to pellet mitochondria. Cytosolic fraction (supernatant) was obtained by centrifugation at 12,000 g for one hour at 4°C.
Cell lysis and isolation of mitochondria
Mitochondria were isolated from A375 and A549 cells, respectively. Cells were harvested with trypsin/EDTA, centrifuged at 300 g for five minutes, washed in PBS and re-suspended in buffer A (10 mmol/L Tris-MOPS pH 7.4, 200 mmol/L sucrose, 1 mmol/L EGTA, 1 mg/mL BSA, 1 mmol/L DTT). Cells were lysed with a homogenizer (40 strokes) and suspension was centrifuged at 2500 g for 10 min at 4°C. The supernatant was then centrifuged at 10,000 g for 10 min at 4°C. The resulting pellet was washed and re-suspended in buffer B (10 mmol/L Tris-MOPS pH 7.4, 250 mmol/L sucrose, 1 mmol/L EGTA, 1 mg/mL BSA and 1 mmol/L phenylmethanesulfonyl fluoride).
Measurement of mitochondrial ATPase activity and quantitative estimation of ATP/ADP ratio
The level of ATPase enzyme activity was measured by the standard procedure 30 using Phenol red indicator. Ratio of ATP/ADP was measured using the Enzylight ADP/ATP ratio bioluminiscence assay kit (ELDT 100, Bioassay Systems, Hayward, CA, USA) and assessed in a luminometer (Thermo-Scientific Varier Skan, Thermo Scientific, Waltham, MA, USA). The result obtained was inversed to get the ATP/ADP ratio. 31
Determination of mitochondrial matrix swelling
Mitochondrial suspensions (50 μg protein per well) were incubated in 96-well plates at 25°C in a hypo-osmotic buffer (10 mmol/L Tris-MOPS, pH 7.4, 5 mmol/L succinate, 300 mmol/L sucrose, 1 mmpl/L Pi and 100 μmol/L rote-none) and various doses of apigenin (10–100 μg/mL) were added. Mitochondrial swelling was measured spectro-photometrically and absorbance was recorded at 540 nm as a measure of matrix swelling.
ROS accumulation in mitochondria, measurement of superoxide dismutase and GSH activities
Mitochondrial ROS was detected by an oxidation-sensitive fluorescent probe 2’,7’-dichlorofluorescein diacetate (DCFH-DA). DCFH-DA is cell -permeable and is cleaved by non-specific esterases and oxidized by peroxides produced in the cells to form fluorescent 2’,7’-dichlorofluorescin (DCF). The intensity of DCF fluorescence is proportional to the amount of peroxide produced in the cells. In brief, cells of different treatment groups were isolated and incubated for 30 min with DCFH-DA (5 μg/mL) at 37°C in dark. Samples were then analyzed with Cyflogic v.1.2.1 software using FL-1 band pass filter on flow cytometer (FACS caliber, BD Bioscience). Each determination is based on mean fluorescence intensity of 10,000 events. Superoxide dismutase (SOD) activity was analyzed by a standard protocol. 32 Activity of total sulphydryl group (GSH) was also determined using standard protocol. 33
Immunofluorescence
A375 and A549 cells were plated in six-well culture plates and allowed to adhere for 24 h before treatment. At the end of treatments, cells were washed with PBS and fixed in 3% paraformaldehyde for one hour. Cells were permeabilized with 0.2% CHAPS (3-(3-(cholamidopropyl) dimethylammonio)-1-proane sulfonate) in PBS for two minutes and cells were blocked in 2% BSA with 0.2% Tween-20 for 30 min. Cells were incubated overnight at 4°C with a 1:400 dilution of specific primary antibody (anti-cytochrome c) and further incubated for one hour with a 1:2000 dilution of horse radish peroxidise-conjugated secondary antibody. Immunofluorescence was photographed under fluorescence microscope (Leica).
Analysis of mitochondrial alterations by assessment of mitochondrial membrane potential depolarization
Changes in mitochondrial membrane potential of A375 and A549 cells in response to apigenin treatment were determined using a fluorescent probe, Rhodamine 123 according to the standard protocol. 34 Briefly, cells (2 × 10⁵) after treatment were added 5 μL of Rhodamine 123 (1 mmol/L) and incubated for 15 min. Cells were washed with PBS and observed under a fluorescence microscope (Motic Image, Causeway Bay, Hong Kong) and photographs were taken.
Mitochondrial membrane potential changes were also determined by flow cytometer 34 (FACS caliber, BD Bioscience). Briefly, cells after treatment were washed with ice-cold PBS and then incubated with Rhodamine 123 (5 mmol/L) in darkness for 15 min at room temp. The fluorescence emissions were assessed using a flow cytometer and analyzed using Cyflogic v.1.2.1 software. Each determination is based on mean fluorescence intensity of 10,000 events.
RNA extraction and quantitative reverse transcriptase-polymerase chain reaction analysis
Total RNA from A375 and A549 cells was extracted using Trizol reagent according to the manufacturer's instructions. cDNA was reverse transcribed by reverse transcriptase and cDNA was used as a template for polymerase chain reaction (PCR) amplification with the aid of Taq polymerase as per the standard practice. 22 Synthetic oligo-nucleotide primers for reverse transcriptase (RT)-PCR were procured from Chromus Biotech, Bangalore, India. The sequences (Bioserve Biotech, Hyderabad, India) of the forward and reverse primers used for specific amplifications are as follows: G3PDH (5’ ATGGGGAAGGTGAA-GGTCGG 3’ and 5’ GGATGCTAAGCAGTTGGT 3’) Bax (F: 5’ AGTAACATGGAGCTGCAGAGG 3’ and R: 5’ ATGGTTCTGATCAGTTCCGG 3’) Bcl-2 (F: 5’ GTGACT-TCCGATCAGGAAGG 3’ and R: CTTCCAGACATTCGGA-GACC 3’).
Immunoblot analysis
Immunoblot analysis was conducted using anti-caspase 3, 9, PARP and cyt c antibodies (Santa Cruz Biotechnology, Santa Cruz, CA, USA). Alkaline phosphatase-conjugated secondary antibody (Sigma) was used for the purpose. For quantitative analysis of each band, the band intensity was determined using the Total Lab software (Ultra Lum, USA).
Statistical analysis
Results of all experiments are presented as means (± SD) of values of three independent experiments. Statistical analysis of the data and significance of the differences between the mean values were made using Student's t-test and oneway analysis of variance using SPSS 14 software (SPSS Inc., Chicago, IL, USA). A probability of 0.05 or less was considered statistically significant.
Results
Estimation of total flavone content in LC extract
Total flavone content (% value) determined by the method of Chang et al. 21 was found to be 0.035 ± 0.055 g %. The results ensured the accuracy, less degradation and an optimum percentage of flavonoid value to proceed for further extraction procedures (Figures 1)and Figures 2.
DPPH radical scavenging activity of apigenin and NO measurement
Different concentrations of apigenin put into DPPH reaction mixture/Greiss reagent elicited the free radical scavenging activity in a linear increasing manner from 20 to 150 μg/mL. The treatment with 80 μg/mL apigenin showed highest inhibition (17.92%) of DPPH radical, and 8.21% inhibition of NO scavenging activity (Figure 3a).
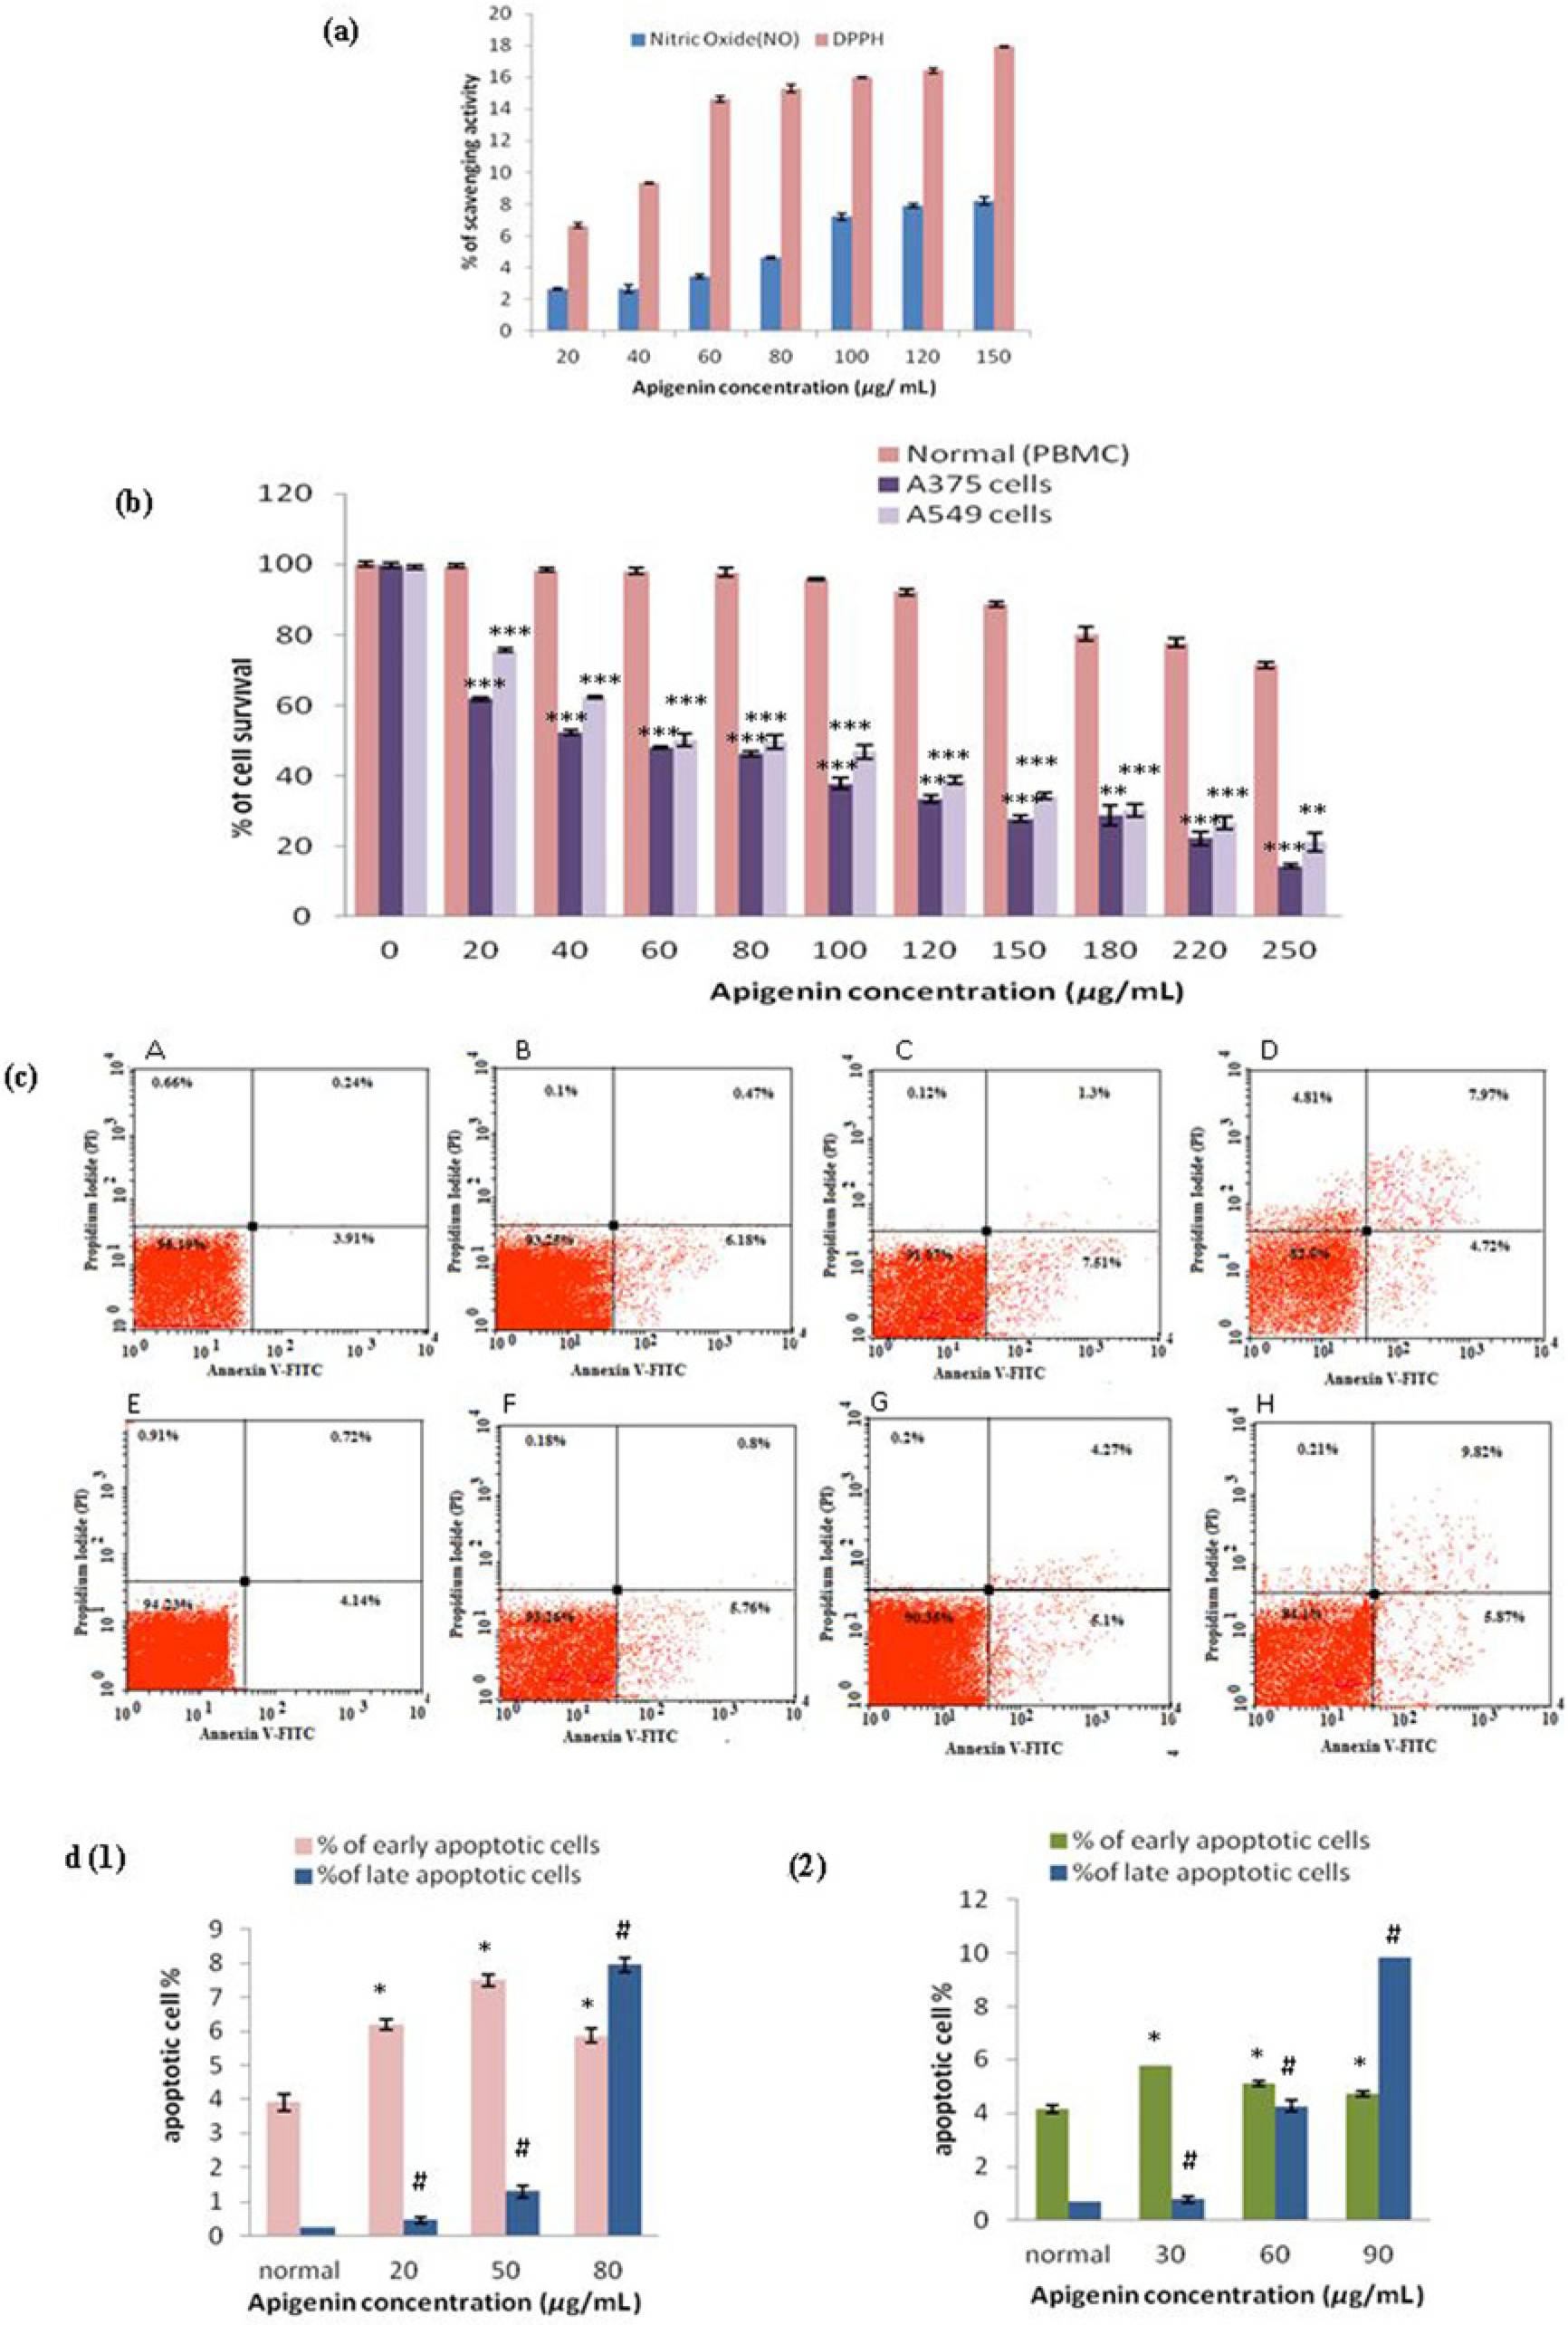
(a) Evaluation of DPPH radical and nitric oxide (NO) scavenging activity of apigenin. Results were observed in terms of percentage in three independent experiments. (b) Antiproliferative and apoptosis inducing effects of apigenin in human melanoma A375 and lung adenocarcinoma A549 cell lines and peripheral blood mononuclear cells (PBMC). Cells were cultured in presence of various concentrations of apigenin (20-250 μg/mL) for 24 h. Cell proliferation was measured by MTT assay with three replicates per apigenin concentration. Values were measured in three independent experiments done in triplicate and were expressed as mean ± standard error of mean.
Assessment of % cell viability after administration of apigenin
The results indicated that apigenin extracted from LC significantly inhibited the proliferation of both the cell lines, A375 and A549, in a dose-dependent manner when incubated for 24 h (Figure 3b). The IC50 values of apigenin in A375 were 50.1 ± 0.4 μg/mL whereas in case of A549 cells it was 60.2 ± 1.8 μg/mL (Figure 3b), from where it could be assumed that apigenin was more effective to A375 at much lower concentration than in A549 cells. On the other hand, viability of normal PBMC was minimally affected following exposure even at highest concentration of apigenin (250 μg/mL) which was highly cytotoxic to the cancer cells. Treatment of cancer cells with apigenin for 48 h showed almost 90–95% decrease in cell viability at lowest doses of 20–40 μg/mL apigenin (data not shown).
Apigenin triggers apoptosis
Flow cytometric analysis of A375 and A549 cells was performed using dual stain Annexin V-FITC/PI. After treatment of apigenin for 24 h, both early and late apoptotic cells significantly increased in a concentration-dependant manner as shown in Figure 3c, d (1, 2). Treatment of A375 and A549 cells with apigenin increased the number of apoptotic cells as compared with their respective controls whereas increase in percentage of necrotic cells was negligible in both cell types.
Morphological analysis after apigenin treatment
Apigenin-induced apoptosis in A375 and A549 cells was further confirmed by DAPI staining (Figure 4a). Control cultures (apigenin-untreated cells) did not show any significant effect, whereas condensed or fragmented nuclei were observed in apigenin-treated cells.
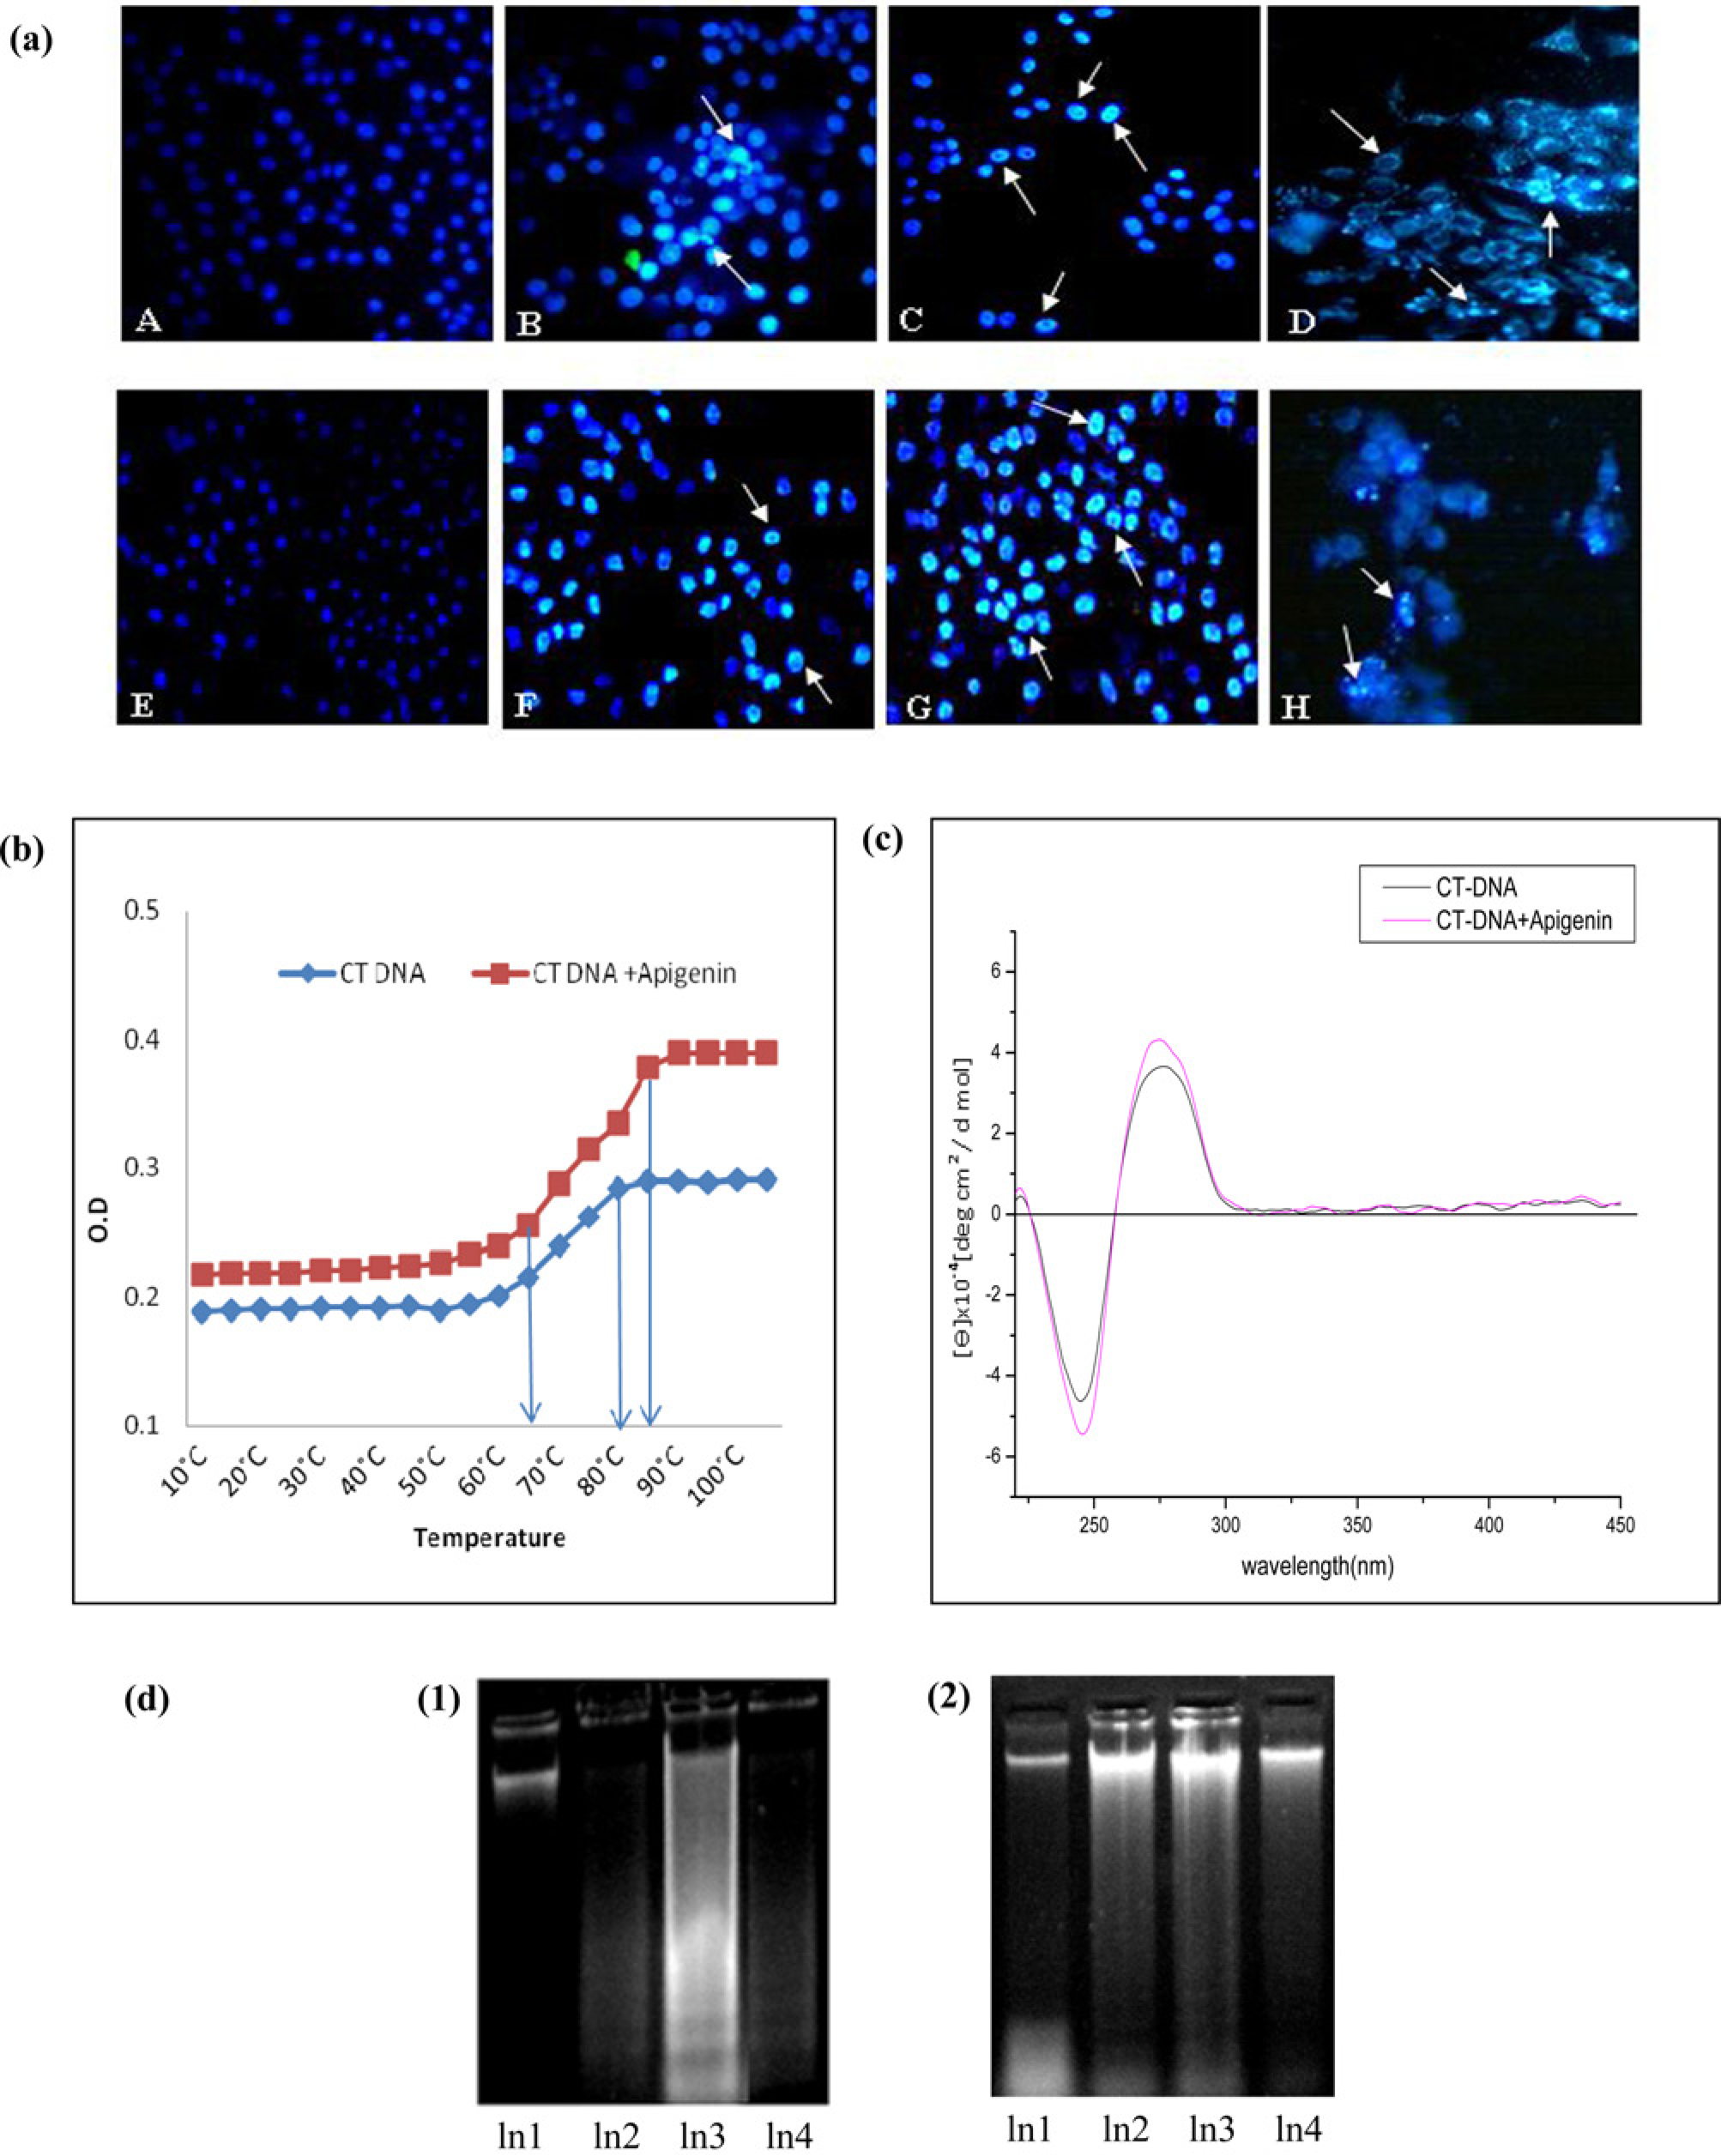
(a) Effect of apigenin on cell morphology of A375 and A549 cells by DAPI staining showing gradual increase in fluorescence intensity with increased nuclear condensation and fragmentation when treated with increasing concentrations of apigenin. (b) Melting curves of calf thymus DNA (CT-DNA) alone and in presence of apigenin. (c) CD spectra of calf thymus DNA (CT-DNA) alone and CT-DNA incubated with apigenin. (d) DNA gel electrophoresis in A375 and A549 cells. DNA damage could be assessed by DNA laddering in (1) apigenin treated A375 (Ln2: 20 μg/mL, Ln3: 50 μg/mL, Ln4: 80 μg/mL) with respect to Ln-1: untreated control cells and in (2) A549 apigenin-treated (Ln2: 30 μg/mL, Ln3: 60 μg/mL, Ln4: 90 μg/mL) with respect to Ln1: untreated A549 cells. DAPI, 4’,6’-diamidino-2 phenyl indole; CD, circular dichroism. (A color version of this figure is available in the online journal)
Interaction of apigenin with DNA
The melting curves of CT-DNA in the absence and presence of the apigenin have been presented in Figure 4b. Here, the thermal denaturation experiment carried out for CT-DNA alone revealed a Tm value of 72.5 ± 0.5°C under experimental conditions, whereas the observed melting temperature of CT-DNA in the presence of apigenin was Tm = 75 ± 0.5°C.
When CD spectra of CT-DNA incubated with apigenin isolated from LC were determined, the observed CD spectrum of DNA consisted of a positive band at 275 nm due to base stacking and a negative band at 246 nm due to change in DNA helicity which are characteristics of typical B-form DNA. Apigenin initially did not show any CD spectrum when free in solution but an induced CD spectrum when interacted with CT-DNA. Apigenin displayed changes of both positive and negative bands thus showing an increase in molar ellipticity as revealed from Figure 4c. This observation is an indicator of a strong binding of api-genin with CT-DNA and bringing about conformational change in it.
Apigenin causes DNA fragmentation
Following treatment of apigenin, dose-dependent DNA damage was observed in A375 cells as well as in A549 cells. As shown in Figure 4d (1) and (2), a significant elevation of DNA strand breaks in both A375 and A549 cells was detectable in a dose-dependant manner in cells exposed to apigenin for 24 h.
Apigenin causes selective mitochondrial swelling
Isolated mitochondria from A375 cells underwent dose-dependent significant matrix swelling with respect to their untreated control cells shown in Figure 5a. However, in A549 cells, no matrix swelling could be observed with increasing concentrations of apigenin treatment with respect to untreated control cells as shown in Figure 5b.

Effect of apigenin on mitochondrial matrix swelling from purified mitochondria of (a) A375 cells and (b) A549 cells. (c) Graphical representation showing measurement of mitochondrial ATP/ADP ratio with apigenin treatment in A375 and (d) A549 cells. A probability of 0.05 or less was considered statistically significant. (A color version of this figure is available in the online journal)
Apigenin modulates ATP/ADP ratio
To investigate whether apigenin could directly target and affect mitochondrial functions, level of ATPase and ATP/ADP ratio were examined. A marked increase in the level of ATPase activity was observed in apigenin-treated A375 cells when compared with apigenin-untreated control cells. However, no significant change could be observed in A549 cells (Table 1). Consequently, ATP/ADP ratio was found to have significantly decreased in A375 cells with increasing dose of apigenin treatment when compared with untreated control as shown in Figure 5c and d. Results of ATP/ADP change in apigenin-treated A549 cells showed no statistically significant difference when compared with control cells which could be correlated with the results of ATPase activity.
Mitochondrial ATPase activity
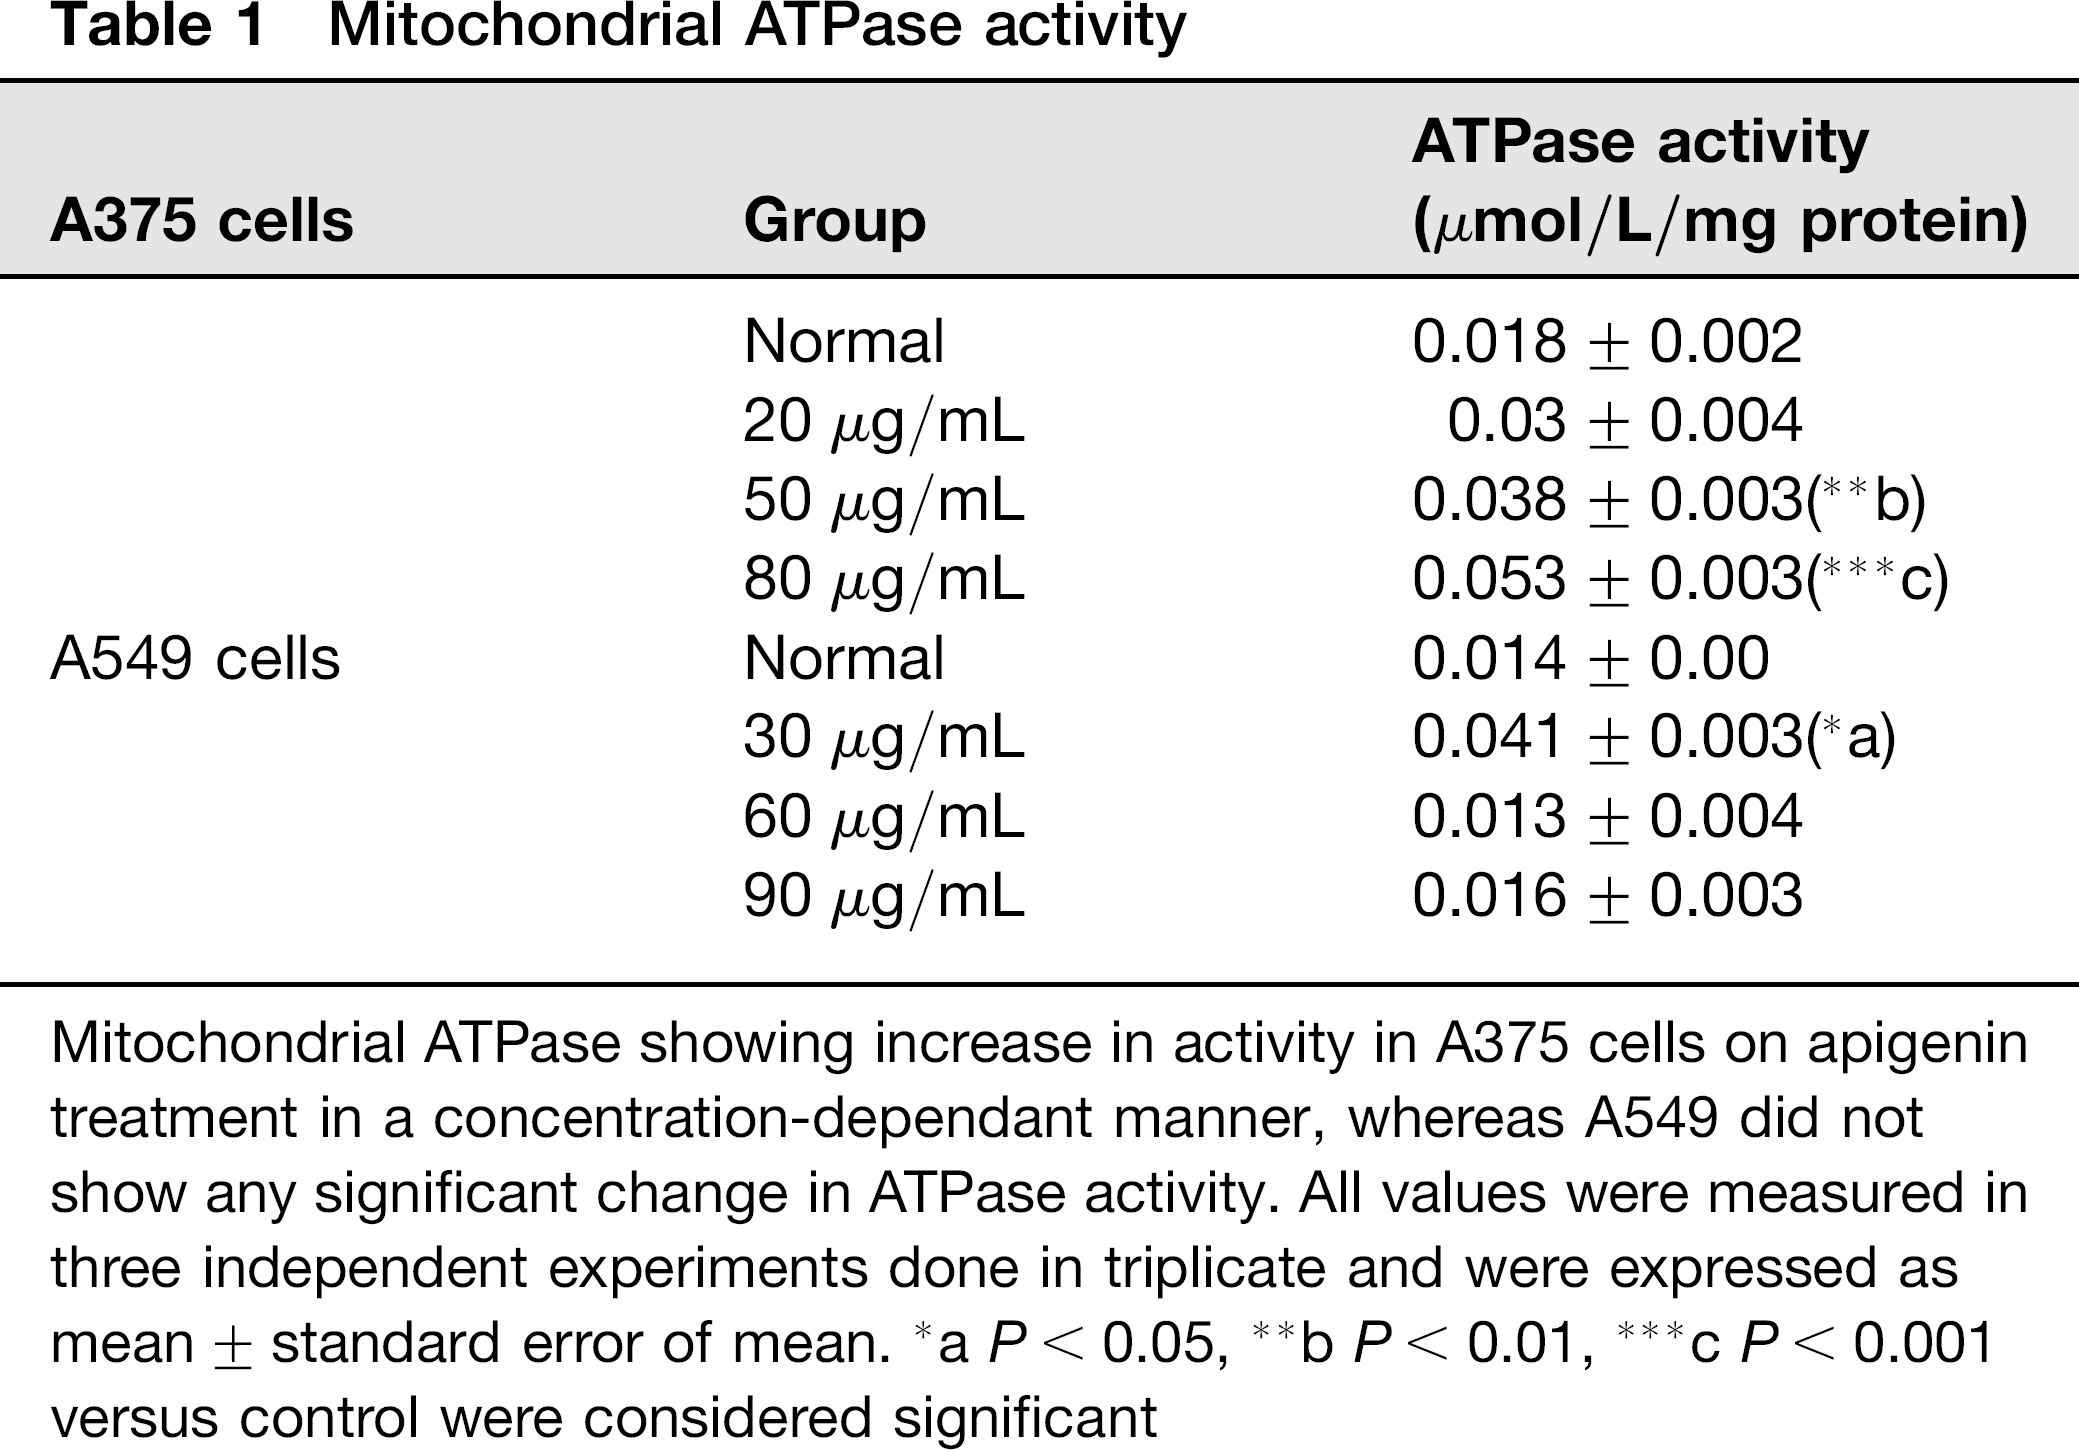
Mitochondrial ATPase showing increase in activity in A375 cells on apigenin treatment in a concentration-dependant manner, whereas A549 did not show any significant change in ATPase activity. All values were measured in three independent experiments done in triplicate and were expressed as mean ± standard error of mean.
aP < 0.05,
bP < 0.01,
c P < 0.001 versus control were considered significant
Increase in ROS accumulation and depletion of SOD and GSH activities after apigenin treatment
Treatment of apigenin in A375 cells caused a significant increase in ROS accumulation in mitochondria with gradual increase in concentration (10.9%, 12.5% and 32%, respectively) as compared with apigenin-untreated control cells (5.4%). Mitochondrial ROS was also found to be elevated in A549 cells in a concentration dependant manner (4.5%, 9.9% and 21.8%, respectively, when compared with untreated control (1.4%) cells as shown in Figure 6a. A marked depletion in SOD and GSH levels was also observed in both cell types (Table 2).
GSH and SOD activities
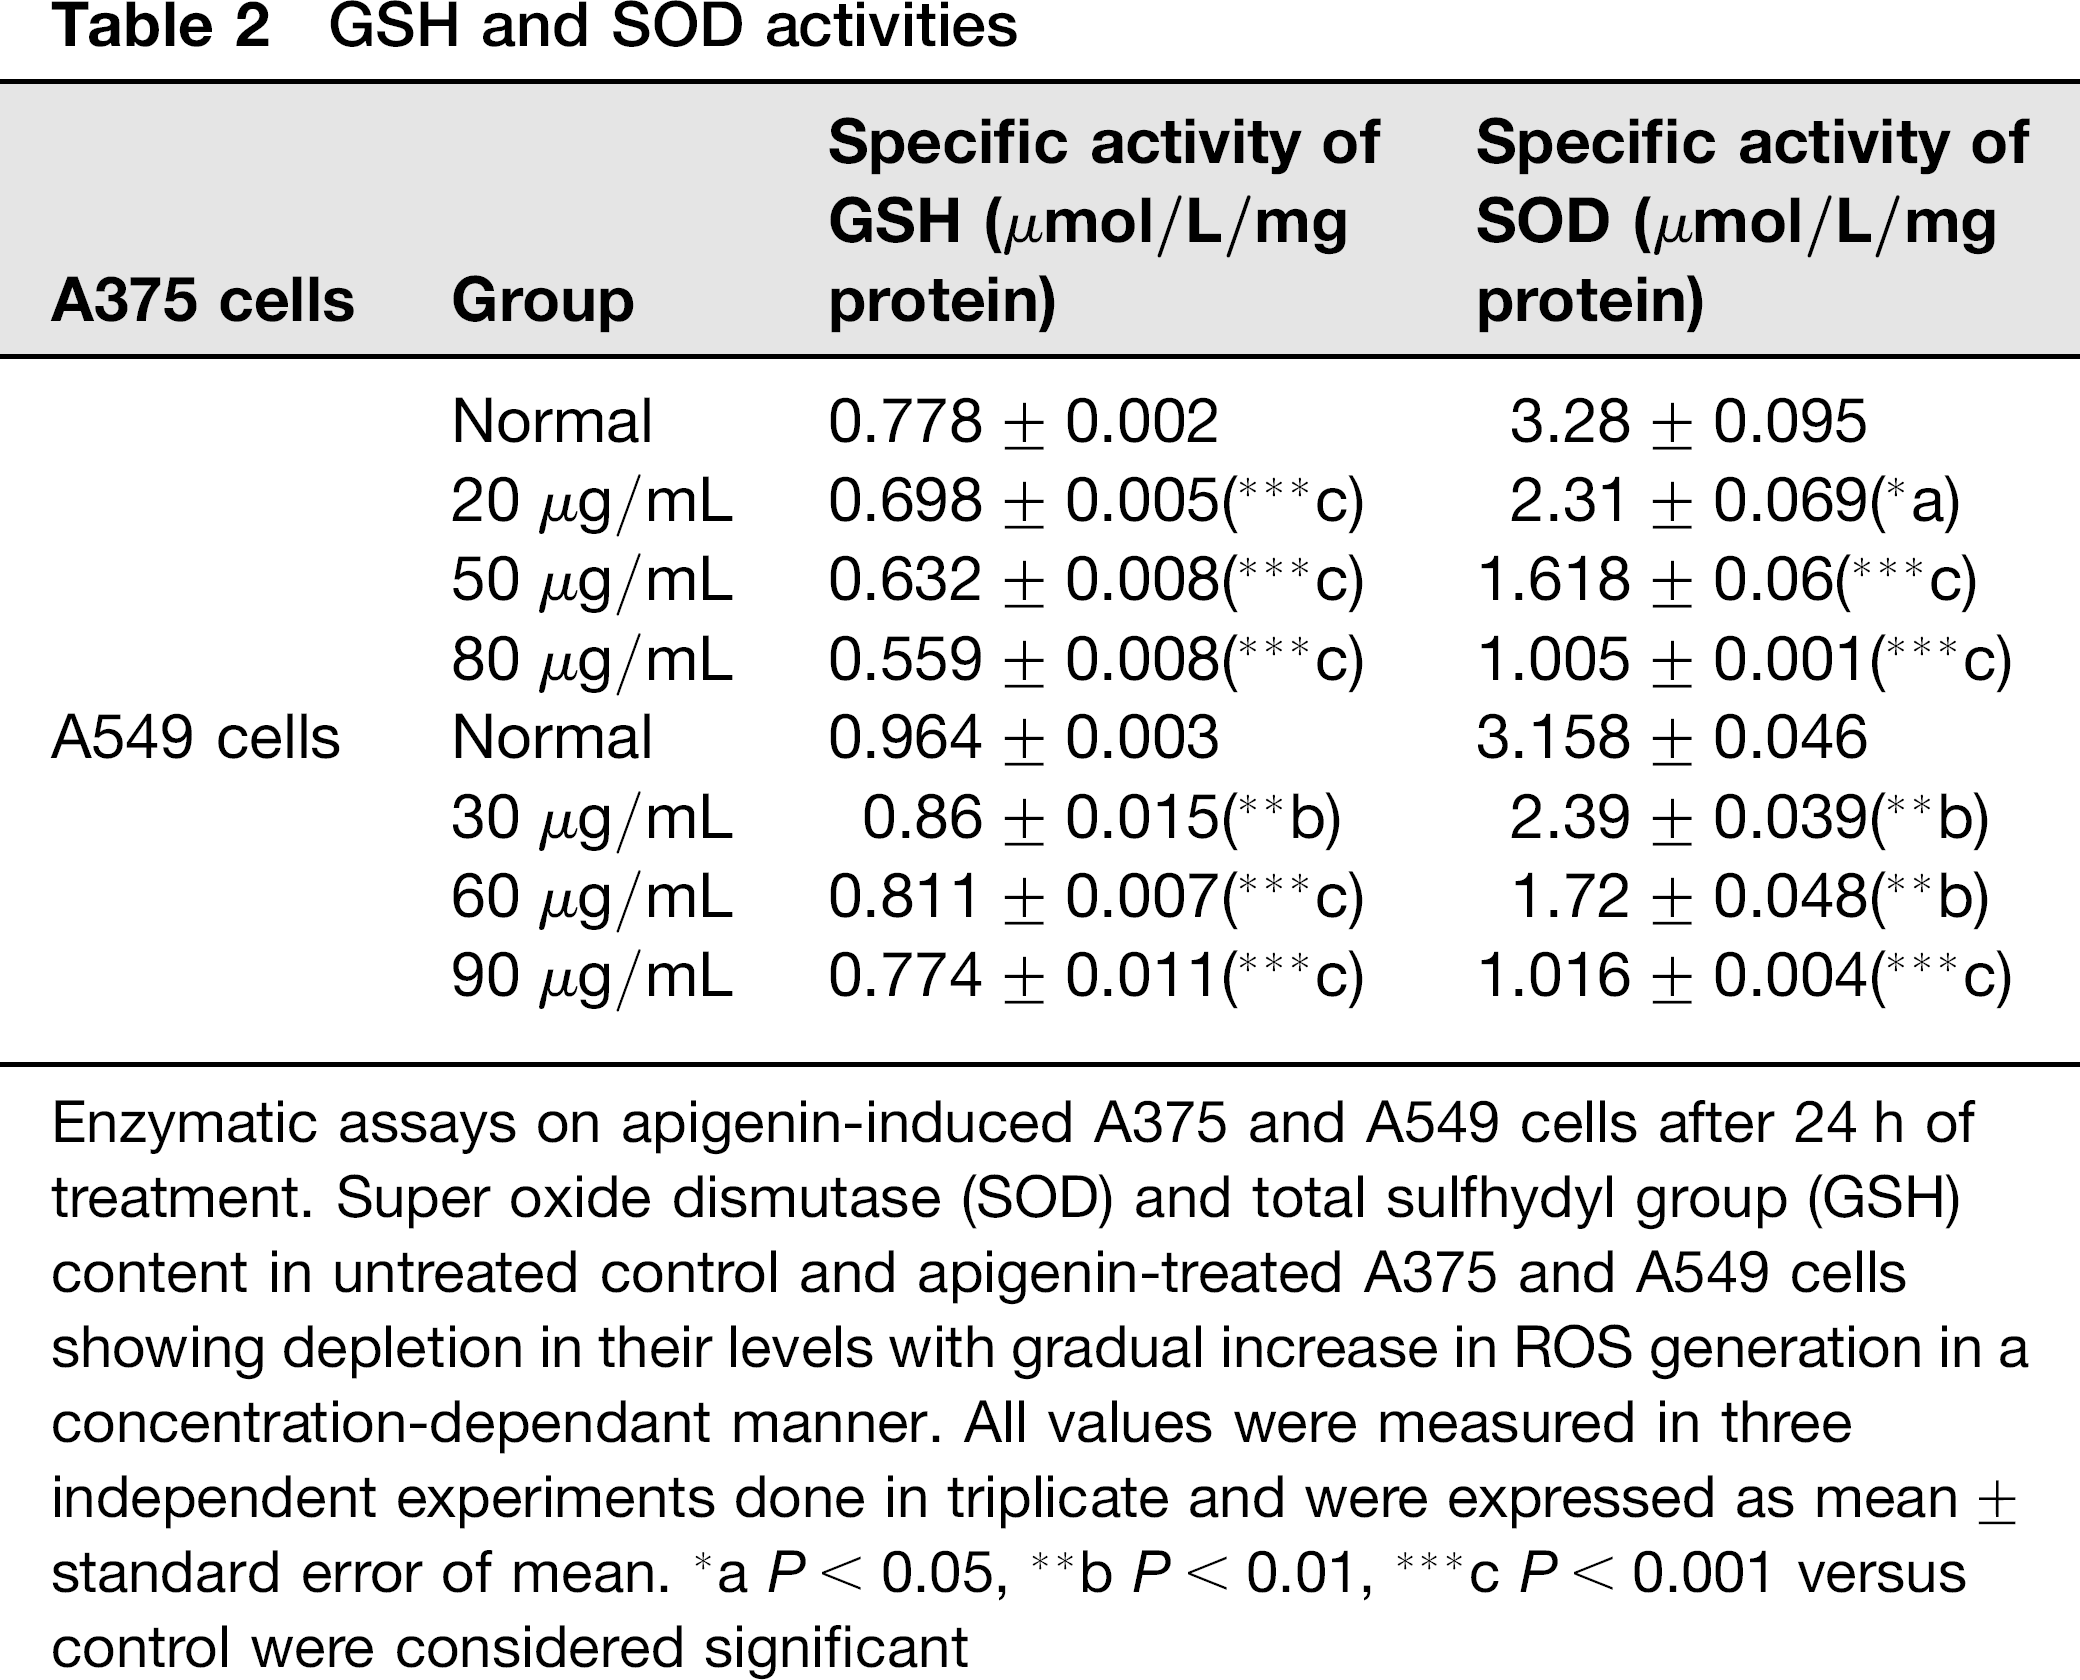
Enzymatic assays on apigenin-induced A375 and A549 cells after 24 h of treatment. Super oxide dismutase (SOD) and total sulfhydyl group (GSH) content in untreated control and apigenin-treated A375 and A549 cells showing depletion in their levels with gradual increase in ROS generation in a concentration-dependant manner. All values were measured in three independent experiments done in triplicate and were expressed as mean ± standard error of mean.
aP< 0.05,
b P < 0.01,
c P < 0.001 versus control were considered significant

(a) Flow cytometric analysis of reactive oxygen species (ROS) generation using DCFH-DA fluoroprobe in apigenin treated for 24 h A375 and A549 cells with respect to their untreated control cells. Apigenin caused a gradual increase in mitochondrial ROS generation (10.9%, 12.5%, and 32%, respectively) as compared with apigenin-untreated control (5.4%) in A375 cells. Mitochondrial ROS also increased gradually in A549 cells with increase in apigenin concentration (4.5%, 9.9% and 21.8%, respectively), when compared with untreated control (1.4%) cells (b) Immunofluorescence staining of A375 and A549 cells. Both in A375 and A549 cells, gradual release of cytochrome c (cyt c) into the cytosol from mitochondrial inter-membrane space could be observed. Increase in diffused green fluorescence could be clearly observed in higher doses of apigenin treatment which indicated that cyt c shifted from punctuate to diffused pattern in apop-totic cells and re-localized from mitochondrial intermembrane space to cytosol. (A color version of this figure is available in the online journal)
Release of cyt c
Release of cyt c from mitochondria to the cytosol was investigated in response to apigenin treatment by immunofluorescence analysis (Figure 6b). Increase in diffused green fluorescence of cyt c was observed and marked increase was found with 80 μg/mL and 90 μg/mL apigenin treatment in A375 and A549 cells, respectively, at 24 h of incubation indicating shifting of cyt c from punctuate to diffuse pattern in apoptotic cells and re-localization from mitochondrial inter-membrane space to cytosol.
Depolarization of mitochondrial membrane potential (ΔΨm) with apigenin treatment
The potential of apigenin to generate stress and collapse of mitochondrial membrane depolarization (ΔΨm) was measured using the mitochondria specific fluoroprobe Rhodamine 123. As compared with the untreated control, both cell lines cells showed decrease in Rhodamine123 fluorescence intensity with gradual increase in apigenin concentration after 24 h incubation (Figure 7a) with relatively more effective mitochondrial membrane depolarization in A375 than A549 cells.

Fluorescence and flow cytometric analyses of mitochondrial membrane potential (ΔΨm) in apigenin-treated A375 and A549 cells with respect to their respective untreated control cells. (a) Images of fluorescence microscopy of A375 and A549 cells showing green fluorescence in untreated control with gradual decrease in fluorescence intensity with increase in apigenin concentration. (A) Untreated control A375 cells, (E) untreated control A549 cells, apigenin-treated groups in A375 (B: 20 μg/mL, C: 50 μg/mL, D: 80 μg/mL) and A549 (F: 30 μg/mL, G: 60 μg/mL, H: 90 μg/mL) cells. (b) Apigenin treated for 24 h and untreated control A375 and A549 cells were incubated with Rhodamine 123 fluorescent probe and analyzed in a single labeling system at 530 nm band pass filter using histogram plot. Increase in mitochondrial depolarization could be observed in a dose-dependant manner. (A) Untreated control A375 cells, (E) untreated control A549 cells, apigenin-treated groups in A375 (B: 20 μg/mL, C: 50 μg/mL, D: 80 μg/mL) and A549 (F: 30 μg/mL, G: 60 μg/mL H: 90 μg/mL) cells. (A color version of this figure is available in the online journal)
Change in mitochondrial membrane potential (MMP) was observed in apigenin-treated cells compared with control cells when analyzed flow-cytometrically. Control cells showed (36.43%) of Rhodamine123-positive cells in A375 and 35.5% positive cells (depolarized mitochondria) in A549, respectively, which increased upto 38%, 41.82% and 45.02%, in A375 and 38.46%, 39.51% and 43.14%, respectively, in A549 in a dose-dependent manner after apigenin induction (Figure 7b).
RT-PCR and immunoblot analysis
Results of RT-PCR confirmed that apigenin caused a significant difference in mRNA expression between A375 and A549 cells and untreated control cells (Figure 8a). Apigenin elevated the expression level of Bax in both cell lines while Bcl-2 expression level was decreased with increasing apigenin concentrations showing higher sensitivity of A375 cells than for A549 cells.

RT (reverse transcriptase)-PCR and immunoblot analysis showing effect of apigenin on A375 and A549 cells. (a) mRNA expression levels of Bax and Bcl-2 from mitochondrial and cytosolic fractions. Band densities were expressed as mean ± SD for three independent experiments and compared with G3PdH (b) immunoblot expression study of caspase 3, 9, PARP and cytochrome c (cyt c). Band intensities were expressed as mean of their relative density normalized to β-actin. The intensity of the control was normalized to 1, and intensity of each band from apigenin treated cells was compared with control. Ln1: untreated control A375 cells, apigenin treated (Ln2: 20 μg/mL, Ln3: 50 μg/mL, Ln4: 80 μg/mL) A375 cells, Ln5: untreated control A549 cells, apigenin treated (Ln6: 30 μg/mL, Ln7: 60 μg/mL, Ln8: 90 μg/mL) A549 cells
Immunoblot studies revealed that in A375 cells, caspase 3, 9, PARP and expression levels were up-regulated with increasing doses of apigenin induction (Figure 8b). Protein expression levels were also found to be up-regulated in A549 cells except for PARP, which showed lesser effect with higher dose of apigenin treatment. Expression level of cyt c in the mitochondrial fraction was found to be down-regulated with increasing doses of apigenin in both cells.
Discussion
The objectives of the present study were to investigate the death inducing potential of the natural compound apigenin, a 5,7,4’ -trihydroxy flavone isolated from LC against human melanoma A375 and lung carcinoma A549 cells. Results of the present study would clearly show that the isolated compound apigenin had antiproliferative effect on the two cancer cell lines, thereby indicating its anti-cancer potential. Flavonoids and their derivatives have earlier been reported to have cytotoxic effects in several human cancer cell lines and most of them were found to exhibit their anticancer activities through interaction with CT-DNA and induction of apoptosis.13,14 This was initially evidenced by nuclear condensation, DNA fragmentation studies and internucleosomal DNA cleavage. Further, it could be demonstrated that apigenin had qualitatively more pronounced cytotoxic effect on human cancer cells A375 than on A549 cells through induction of apoptosis, thus indicating it to be probably more potent and sensitive in killing melanoma cells than lung cancer cells. In our findings, the apoptotic process involved the activation of the mitochondrial pathway in both types of cancer cells, and was sequentially associated with increase in ATPase activity with concomitant decrease in ATP/ADP ratio, mitochondrial inner membrane swelling, ROS accumulation, GSH and SOD depletion, loss of ΔΨm, cyt c release into the cytosol, elevation in Bax, PARP cleavage and caspase 3, 9 activation as well as Bcl-2 down-regulation.
A hallmark of programmed cell death is the redistribution of phosphatidyl serine (PS) to the outer side of the plasma membrane. On viable cells it is confined to the inner side and is used as a marker. The relocation of PS to the cell membrane was detected by Annexin V-FITC/PI dual staining and according to our findings, significant increase in percentage of apoptotic cells, including early (Annexin V-FITC+/PI-) and late (Annexin V+/PI+) in both cell types was consistent with the earlier studies showing that flavonoids induced apoptosis in both lung cancer and skin melanoma35,36 cells.
ROS are constantly produced in the mitochondria causing oxidative stress from where they are released mainly into the mitochondrial matrix where their targets of their action are membrane proteins and lipids. Therefore, the oxido-reduction potential of cells remains under strict control of antioxidant enzymes like SOD and GSH. ROS generation in mitochondria causes a decrease in ΔΨm, and this depolarization of mitochondrial membrane potential results in the release of apoptogenic factors like cyt c from the intermembrane space to the cytosol. 37 The results of the present study showing marked increase in intracellular ROS production with concomitant depletion in GSH and SOD activities are in agreement with previous studies that documented apigenin treatment to have induced intra-cellular GSH and SOD depletion and ROS accumulation in pancreatic cancer. 15
A possible explanation for the elevation in ROS generation is that loss of anti oxidant defence causes an oxidant–antioxidant imbalance making membrane protein and lipids vulnerable to oxidative damage. Another possibility is that any compound may directly act on the mitochondria through elevation in ATPase activity and decrease in ATP/ADP ratio as an early event of apoptosis causing mitochondrial inner membrane swelling and membrane depolarization. In such cases, the early apoptotic event is associated with condensation of the mitochondrial matrix and a reduction in total mitochondrial volume. The degree of mitochondrial condensation subsequently increases in concert with the appearance of chromatin and cytoplasmic condensation. At later time points, signs of mitochondrial degeneration are apparent, characterized initially by dilation of the intracristal space and then by progressive swelling of the mitochondria, with interruption of the outer membrane and loss of matrix density. 38 Therefore, we questioned whether apigenin had any direct role on mitochondrial dysfunction and apoptosis, as impaired mitochondrial function is largely thought to be a core abnormality responsible for cellular damage in lung and skin.39,40 Our results indicated that apigenin could directly target mitochondria and cause its breakdown of the oxidative phosphorylation system by ATP/ADP ratio depletion with subsequent swelling and membrane depolarization. Interestingly, there was no significant change in ATPase activity, ATP/ADP ratio as well as mitochondrial membrane swelling in A549 cells on apigenin treatment. Thus it may be possible that apigenin could not cause mitochondrial dysfunction by directly targeting the oxidative phosphorylation system but could act as an upstream event to elevate ROS generation, mitochondrial membrane depolarization and thus induce mitochondrial apoptosis.

Schematic representation of effects of apigenin in A375 and A549 cells. (A color version of this figure is available in the online journal)
Upon apigenin treatment, A375 cells presented a decrease in Rhodamine123 fluorescence, demonstrating a loss of ΔΨm in a dose-dependant manner in both cell lines. Results of immnuofluorescence and RT-PCR studies also suggested a correlation between sensitivity of both cancer cells in increased accumulation of ROS in mitochondria and loss in ΔΨm along with cyt c release from mitochondria to cytosol.
Mitochondrial apoptotic pathway is regulated by members of the Bcl-2 family of pro-apoptotic and anti-apoptotic proteins and it is the balance between these proteins that determines whether the cell survives or undergoes apoptosis. The caspase family plays a key role in driving apoptosis, which requires the activation of initiator and executioner caspases like caspase 9 and 3 respectively, in response to pro-apoptotic signals.39,40 In our present study, apigenin treatment induced a significant up-regulation in Bax and down-regulation in Bcl-2 in both cells in a dose-dependent manner. Also, immunoblot analysis revealed significant decrease in cyt c levels in mitochondrial fraction following increase in caspase 3, 9 and PARP levels. Thus these results suggest the activation of intrinsic apoptosis pathway which is consistent with the earlier findings of researchers.41,42
In conclusion, we demonstrated that low doses of apigenin extracted from LC induce apoptosis of human melanoma as well as adenocarcinoma cells, mainly by triggering ROS production, mitochondrial dysfunction and caspase activation, though both cell lines displayed different susceptibilities towards apigenin. Interestingly, A375 appeared qualitatively more sensitive to apigenin-induced apoptosis where they could directly target and alter mitochondrial functions by impairing the oxidative phosphorylation system whereas in A549 it rather acted as an upstream event and thus mediated mitochondrial apoptosis. These findings suggested that it may be a possible reason for A375 being more sensitive to apigenin-induced apoptosis than A549 cells. However, further studies are required to validate our findings on apigenin and its direct action on mitochondrial oxidative phorphorylation, and to assess the therapeutic strategy to utilize this knowledge in effective drug design. But till then, it could be safely said that the homeopathic mother tincture of LC contains apigenin with strong anticancer potentials.
Footnotes
Acknowledgements
This work was financially supported by a grant sanctioned to Prof ARK-B, Department of Zoology, University of Kalyani, Kalyani 741235, India by Boiron Laboratory, Lyon, France. We are also thankful to Dr Gopinatha Suresh Kumar, Indian Institute of Chemical Biology, Mr Tanmoy Sarkar, Department of Chemistry, and Dr. Kakali Bhadra, Dept. of Zoology, University of Kalyani, India, for their kind help in conducting a part of the work.