
Abstract
Organophosphates (OPs) are toxic chemicals commonly used as pesticides and herbicides. Some OPs are highly toxic to humans and have been used in warfare and terrorist attacks. In order to elucidate the molecular mechanisms of injury caused by OPs, the differentially expressed genes were analyzed in human SK-N-SH neuroblastoma cells induced by three OPs. The SK-N-SH cells were treated with one of the three OPs, chlorpyrifos, dichlorvos or methamidophos at LC20 (high-dose), the concentration causing 20% cell death, as well as 1/20 of LC20 (low-dose), a sub-lethal concentration with no detectable cell death, for 24 h. The genome-wide gene changes were identified by Agilent Microarray System, and analyzed by microarray analysis tools. The analysis revealed neuroblastoma cells treated with the high doses of all three OPs markedly activated cell apoptosis and inhibited cell growth and proliferation genes, which would most likely lead to the process of cell death. Interestingly, the analysis also revealed significant decrease in expressions of many genes in a specific spliceosome pathway in cells treated with the low doses of all three different OPs. The change of spliceosome pathway may represent an important mechanism of injury in neuronal cells exposed to low doses of various OPs. In addition to unraveling a potentially different form of OP pathogenesis, this finding could provide a new diagnostic marker in assessing OP-associated injury in cells or tissues. In addition, these results could also contribute to the development of new prevention and/or therapeutic regimens against OP toxicity.
Introduction
Organophosphates (OPs), toxic chemicals that exist in many pesticides, can cause severe chronic and acute illnesses or even death in humans. 1 In the USA, approximately half a million tons of pesticides are used in agriculture and households annually, and thousands of people were admitted to hospital because of OP poisoning, and children are the most common victims.2,3 Therefore, OPs are a significant environmental threat to human health.
OPs are known to act through their inhibitory effects on the acetylcholineseterase enzyme (AChE) at nerve endings. 4 The AChE enzyme is critical to normal control of nerve impulse transmission from nerve fibers to smooth and skeletal muscle cells, glandular cells, autonomic ganglia and in the central nervous system (CNS). The loss of AChE function allows accumulation of excess acetylcholine and results in over-stimulation of the effector organs. 4 High acetylcholine concentrations accumulated in the CNS cause sensory and behavioral disturbances, incoordination, depressed normal motor function and respiratory depression. Increased pulmonary secretions coupled with bronchoconstriction are the usual causes of death from OP poisoning. 5 On the other hand, it is evidently more difficult to document the damage of peripheral or central nervous system caused by chronic exposure to low doses of OPs. 2
There have been many studies using biochemical, physiological, behavioral and histopathological approaches in animal models to search for cell injury mechanisms by organophosphorous agents.6–9 Most of these studies have looked at specific aspects on OP poisoning, such as changes in phospholipase C activities in rat brain, cholin-esterase inhibition in whole blood and changes in the expression of synaptobrevin/vesicle-associated membrane protein in hippocampal neurons. Despite the general consensus of the disease progression of OP poisoning, few studies have been conducted using a systematic approach to research the detailed molecular mechanisms of injury by organophosphorous agents. Recently, with the development of microarray technology, it has become possible to study the global changes of gene expression profiles before and after exposures to toxic substances in biological systems. 10 However, the few microarray studies that reported changes of the gene expression profiles associated with OP damage in cells11–14 either focused on examining only a subset of gene expression profiles or examined the effect of one particular OP.
In addition to the common mechanism of inhibiting AChE, OPs could also be affecting many non-cholinergic neurochemical processes as well as non-neurochemical pro-cesses. 1 To develop effective diagnostic means, preventive measures and treatments against OP-associated toxicities and injury, it is critically important to better understand the molecular mechanisms of injury caused by various OPs. In the beginning, we examined genome-wide gene expression profiles in three different human cell lines exposed to two (high and low) doses of three different OPs. The alteration of gene expressions following exposure to all three different OPs for both doses were found to be much more prominent in the human neuronal cell line, SK-N-SH neuroblastoma cells, than in A549 lung alveolar epithelial cells and HepG2 hepatocellular cells. In the present study, we focused on analyzing the differentially expressed genes identified in human SK-N-SH neuroblastoma cells treated with three different OPs at high and low concentrations. The significant genes commonly expressed in the cells treated with all three different OPs may be used as potential candidates for biomarkers in the evaluation of the degree of OP injury.
Materials and methods
Cell culture
Human neuroblastoma SK-N-SH cell line, A549 lung alveolar epithelial cells and HepG2 hepatocellular cells were purchased from the American Type Culture Collection (ATCC, Manassas, VA, USA). The cells were grown in usually Dulbecco's modified Eagle's medium medium with 10% fetal bovine serum (FBS), 2 mmol/L L-glutamine, 500 μmol/L sodium pyruvate, 50 U/mL penicillin and 50 μg/mL streptomycin. Cells were maintained at 37°C in a humidified atmosphere with 5% CO2. The culture medium was changed every three days.
Measurement of cell viability and determination of LC20
SK-N-SH cells were seeded on 96-well plates at a density of 2 × 10⁴ cells/well and treated with three OPs: chlorpyrifos, dichlorvos or methamidophos for 24 h. The OPs were dissolved in 2% dimethyl sulfoxide (DMSO) (the final concentration of DMSO in medium is 2%, v/v) and 2% DMSO was used as the control. The LC80 (the concentration causing 80% cell death), starting concentrations of three organophosphorus agents were approximately determined as following: chlorpyrifos 800 μg/mL (2.28 mmol/L), dichlorvos 400 μg/mL (1.81 mmol/L) and methamidophos 4000 μg/mL (28.3 mmol/L). Serial two-fold dilutions were used to determine the LC20 (the concentration causing 20% cell death). Each condition was assessed in triplicate. Cell viability was determined by 3-(4,5-dimethylthiazol-2-yl)-2,5-diphenyl-2H-tetrazolium bromide-based In Vitro Toxicology Assay Kit (Sigma, St. Louis, MO, USA). The samples were measured at the absorbance wavelength of 540 nm using a microplate reader (PerkinElmer, Waltham, MA, USA). Cell viability was expressed as a percentage of the control viability. The LC20 of each OP reagent was designed as the high-dose, and the 1/20 of the LC20 for each OP as low-dose for the cell treatment.
Treatment of SK-N-SH cells with OPs
Human neuroblastoma SK-N-SH cells were grown in DMEM medium with 10% FBS, and maintained at 37°C in a humidified atmosphere with 5% CO2. The culture medium was changed every three days. When the cells were reaching 80% confluence, the media were changed to include various concentrations of OPs. For high-dose treatments, LC20 of each OP was determined as following: chlorpyrifos 100 μg/mL (0.29 mmol/L), dichlorvos 25 μg/mL (0.11 mmol/L) and methamidophos 500 μg/mL (3.54 mmol/L)). For low-dose treatments, the 1/20 of the LC20 for each OP was used to treat the cells. Control and treated SK-N-SH cells were incubated for 24 h before processing total RNA isolation.
Total RNA isolation and microarray experiments
Total RNAs from the treated and control cells were isolated by using Trizol (Invitrogen Valenica, CA, USA), and purified by RNeasy kit (Qiagen Valenica, CA, USA) following the manufacturers’ protocols. The quality of isolated RNA was evaluated by Agilent Bioanalyzer 2100 (Clara, CA, USA). RNA samples with the highest integrity and purity were further processed for microarray experiments.
Agilent human whole genomic 4 × 44K arrays were used in this study. Duplicates of the microarray experiments were performed with each dosage treatment of three OPs. The detailed information regarding target preparation, microarray hybridization and image quantification was described in the product protocol (Agilent Technologies). In brief, 200 ng of total RNA was used for complementary RNA (cRNA) amplification following Agilent two-color protocol. Cy3 dye was used to label the cRNA from a control sample, and Cy5 dye was used to label the cRNA from the samples treated with organophosphorus reagents. The final mixture of 825 ng amplified labeled cRNAs in the hybridization cocktail (Agilent) was placed onto the Agilent microarray slide, and hybridized at 42°C in Agilent hybridization oven for 14 h. After washing and spinning dry, all microarray slides were scanned by Agilent G2565CA Microarray Scanner with 2 μm resolution. Scanned raw images were analyzed and data files were generated with Agilent Feature Extraction Software (v10.1).
Data analysis and statistics
Data files were uploaded into the mAdb (a microarray database developed by National Cancer Institute 15 ) and ArrayTrack system (a microarray analytic tool developed by Food and Drug Adminstration 16 ). The advanced filters, minimum fluorescent intensity of 100 in both Cy3 and Cy5 channels, were applied before data analysis. All of the extracted data were normalized using a Lowess normalization method, analyzed by the software tools available through the database.
Statistic analyses were performed, and t-test and analysis of variance were used to compare the differences of gene expression levels between the cells treated with different organophosphorus reagents. Differentially expressed genes were selected based on P value and fold changes with the following criteria: P < 0.05 and fold change ≥2.
Significance Analysis of Microarray (SAM) provided by mAdb was applied to identify commonly differentially expressed genes induced by various OPs. Genes with missing values were removed from the SAM analysis. The number of permutations was set to be 100, and the maximum value of false discovery rate (FDR) was set to be < 0.025 as threshold criteria for counting the numbers of significant genes. Gene ontology (GO) and pathway analysis on differentially expressed genes identified by SAM were performed using the mAdb.
Differentially expressed genes induced by various OP reagents were exported into the Ingenuity Pathway Analysis (IPA) System (www.ingenuity.com). Biological functions and relevant pathways were constructed by the web software provided by IPA. The relationships between genes in the networks were examined with GO analysis to find the related functions. Functional analysis and canonical pathway analysis identified the functions and the pathways from the Ingenuity database that were most significant to the data sets.
Gene-specific reverse-transcription polymerase chain reaction and realtime quantitative PCR
Reverse-transcription polymerase chain reaction (RT-PCR) was performed using gene-specific primer pairs to verify the changes of expression in genes identified by microarray technology. The primers used in this study were shown inTable 1. Briefly, the first-strand cDNA was synthesized by using Superscript II Reverse Transcriptase (Invitrogen) in a 20 μL final volume reaction with 1 μg of total RNA and an oligo-dT primer. For PCR reactions, the resulting first-strand cDNA was amplified by using gene specific primers with AmpliTaq Gold (Applied Biosystems, Roche, Foster City, CA, USA). The RT-PCR reactions were carried out by initial activation at 94°C for five minutes; followed by 35 cycles of the three-step cycling at 94°C denaturation for 45 s, at 55°C annealing for 30 s and at 72°C extension for 45 s. The PCR products were detected by 2.0% agarose gels and visualized by ethidium bromide gel staining. A realtime quantitative PCR (qPCR) was used to confirm the expression level changes of the target significant genes by quantitatively assessing the amounts of the specific mRNA produced in the cells treated with OPs. The mRNA examined was similarly converted into cDNA templates and primer pairs used in RT-PCR were applied to conduct qPCR. The qPCR reactions were carried out by initial activation at 95°C for 10 min; followed by 40 cycles of two-step cycling at 95°C for 30 s and at 60°C for 60 s. The changes of cDNA level were expressed as log2 ratios in cells with high-dose OP treatments relative to the non-treated control.
Primers used in reverse transcription polymerase chain reaction
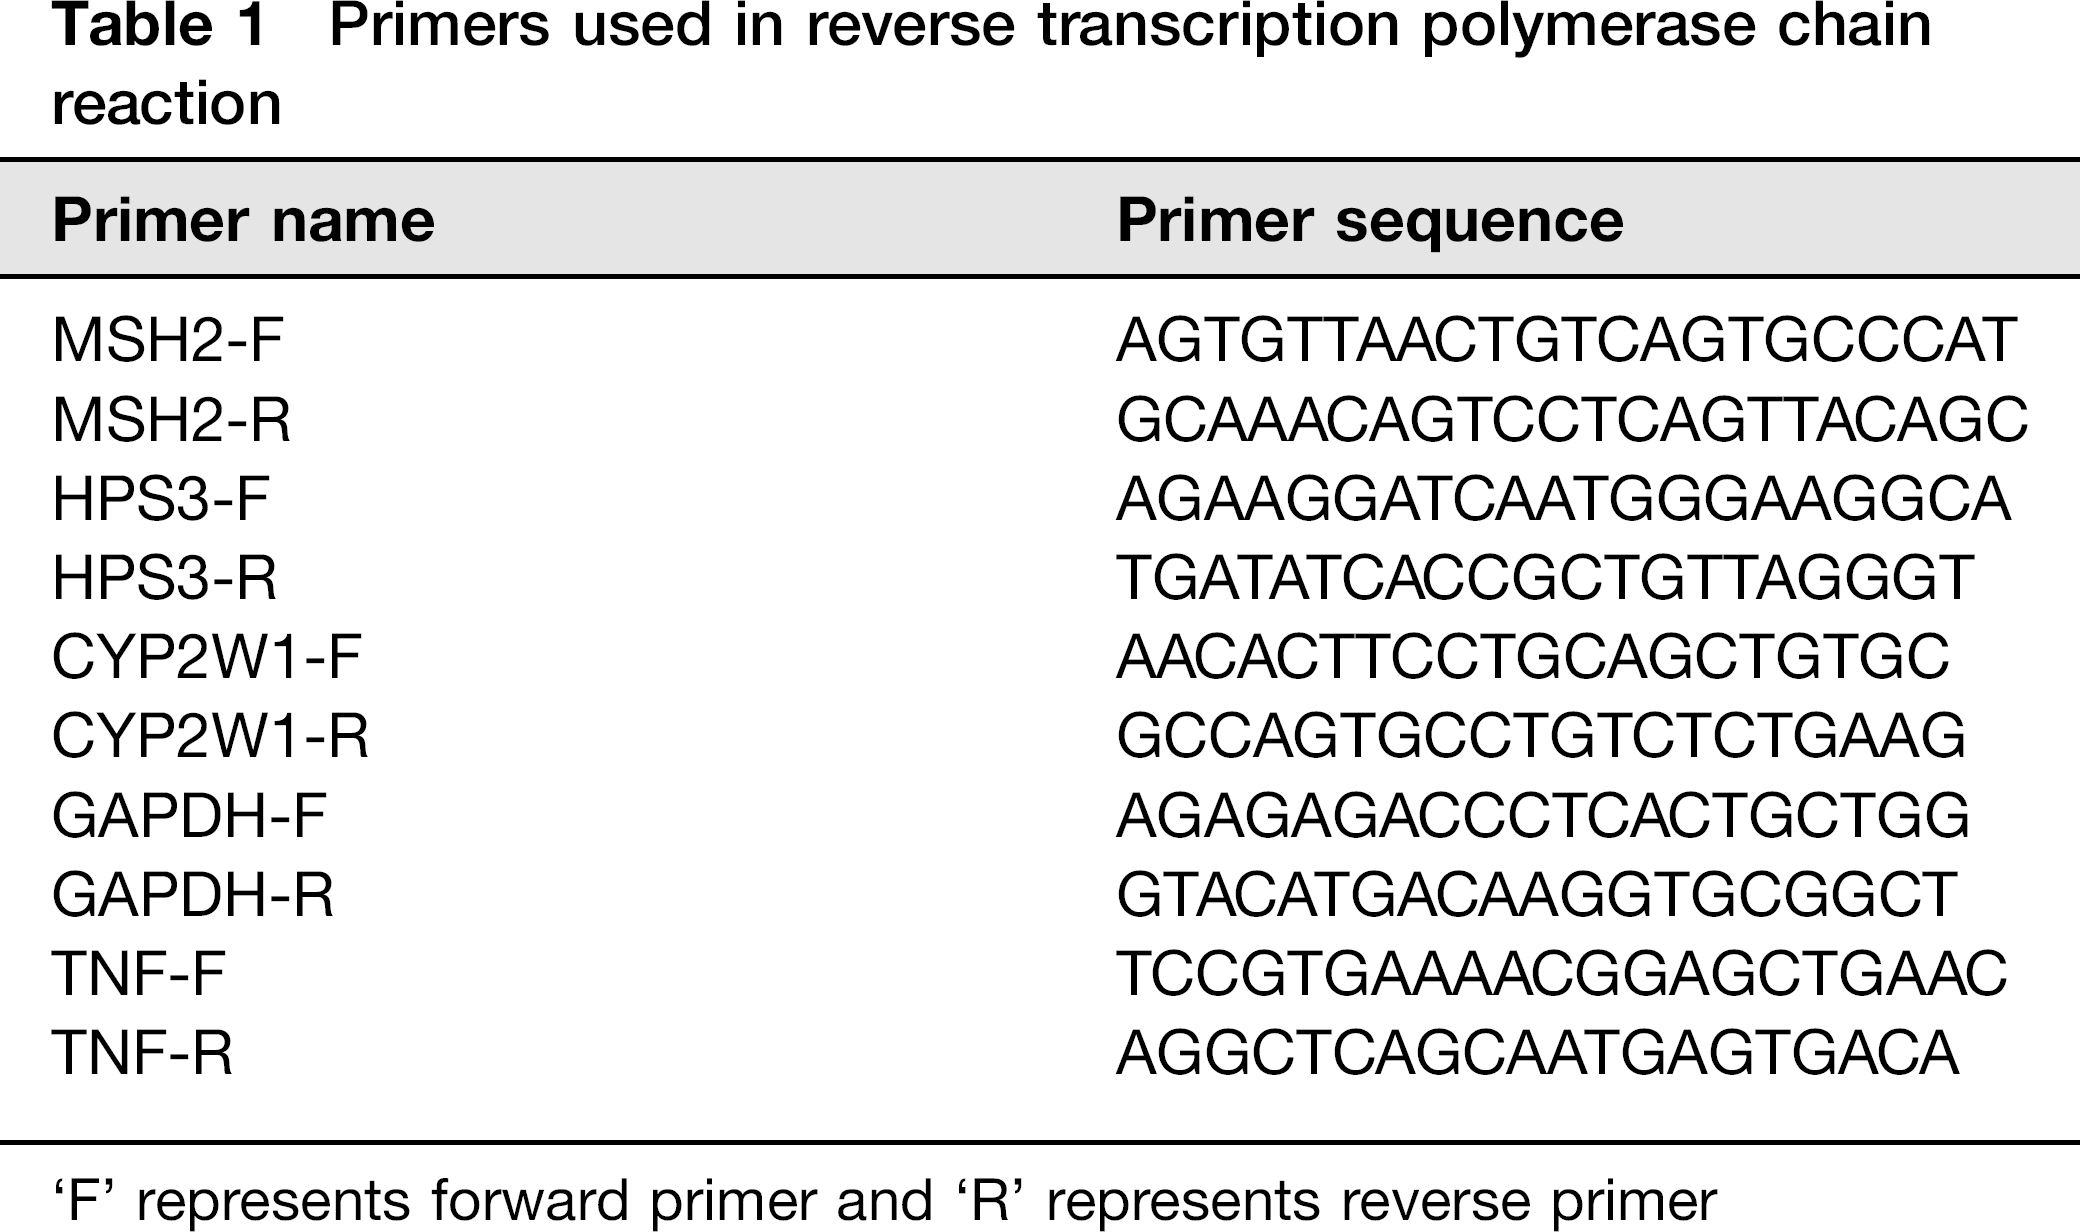
‘F’ represents forward primer and ‘R’ represents reverse primer
Terminal deoxynucleotidyl transferase-mediated dUTP nick-end labeling assay
The terminal deoxynucleotidyl transferase-mediated dUTP nick-end labeling (TUNEL) method was performed to label 3’-end of fragmented DNA of the apoptotic SK-N-SH cells in cultures treated with three different OPs at the high-dose for 24 h. The assay was conducted using Deadend Fluorometric TUNEL system (Promega, Madison, WI, USA). The cell staining procedure was performed following the product instruction. The images of stained cells were captured on a Zeiss LSM-5 (Cambridge, UK) confocal microscope. Furthermore, 100 cells for each sample were examined to determine the percentage of apoptotic cells, where green fluorescent cells were counted as the cells that were undergoing apoptosis.
Results
Cell viability and determination of LC20 and sublethal concentration
The pilot experiments were performed to determine the approximate concentrations causing 80% cell death (LC80) for three OPs: chlorpyrifos, dichlorvos and methamidophos. The LC80 were used as the starting concentrations for determining the LC20 (the concentration causing 20% cell death) for three OPs. Two-fold serial dilutions of three OPs were made from the starting concentrations (LC80), and were used to treat the cells. The survival curves for SK-N-SH neuroblastoma cells treated with three different OPs in serial dilutions were shown in Figure 1. The survival curves for the three OPs not only indicate the toxicity differences among three OPs, but also reflect a dose-dependent variation of the toxicity for each OP. The LC20 for the three OPs was determined as: chlorpyrifos 100 μg/mL (0.29 mmol/L), dichlorvos 25 μg/mL (0.11 mmol/L) and methamidophos 500 μg/mL (3.54 mmol/L), respectively. Subsequently, 1/20 of LC20 was designed as the sublethal concentration at which no obvious cell death was detected in the culture (data not shown). The LC20 so determined was used in the high-dose treatments, and the sublethal concentration was used in low-dose treatments in the present OP injury study.
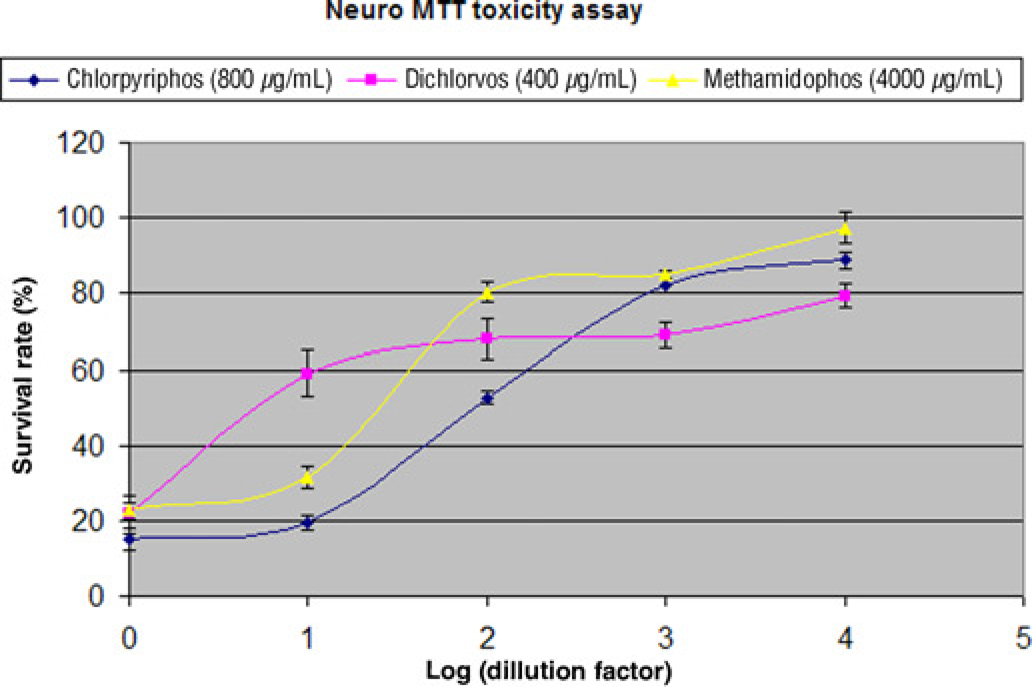
The survival curve for neuronal cells treated with three different OPs. SK-N-SH cells were treated with three OPs: chlorpyrifos, dichlorvos and methamidophos, respectively. The starting concentrations were the approximate LC80 and two-fold serial dilutions were used to determine the LC20. The average and standard deviation for triplicate sample treatments are shown on each spot. OP, organophosphate. (A color version of this figure is available in the online journal)
Identification of common significant genes and pathways induced by high-dose OPs in neuroblastoma cells
The gene expression profiles of SK-N-SH neuroblastoma cells treated with high-dose (LC20) OPs were analyzed by microarray technology. Duplicate microarray experiments were performed for each OP treatment. In the beginning, we analyzed the gene expression profiles with ArrayTrack. The significant genes were identified by the cut-offs of P < 0.05 and fold change >1.5 (the mean intensity is greater than 100). The identification of significant genes was based on Welch's t-test. As shown in Figure 2, 1342 genes were identified significantly expressed in SK-N-SH cells treated with chlorpyrifos; 1768 genes for dichlorvos and 1033 genes for methamidophos. However, only 72 genes (less than 10%) were found common to all the three high-dose OP treatments. The small number of common significant genes limited the pathway analysis and function study. As our focus was on the identification of the common significant genes induced by high-dose treatments with the three different OPs, we put all six high-dose data-sets together and analyzed with mAdb using SAM with FDR <0.025. A total of 496 common significant genes were differentially expressed in response to treatments of three OPs: 175 upregulated genes and 321 downregulated genes (Figure 3). The selected gene list (Table 2) shows all the common significant genes induced by high-dose treatments which were discussed in this article. Many of the upregulated genes play important roles in cell apoptotic process and cell cycle arrest, such as ERN1 (endoplasmic reticulum to nucleus signaling 1), PRNP (prion protein), NET1 (neuro-epithelial cell transforming 1), CLN3 (ceroid-lipofuscinosis, neuronal 3), and MT1A and MT3 (metallothionein 1A and 3).
Selected common significant genes in SK-N-SH cells treated with three high-dose organophosphates identified by ArrayTrack and mAdb analysis
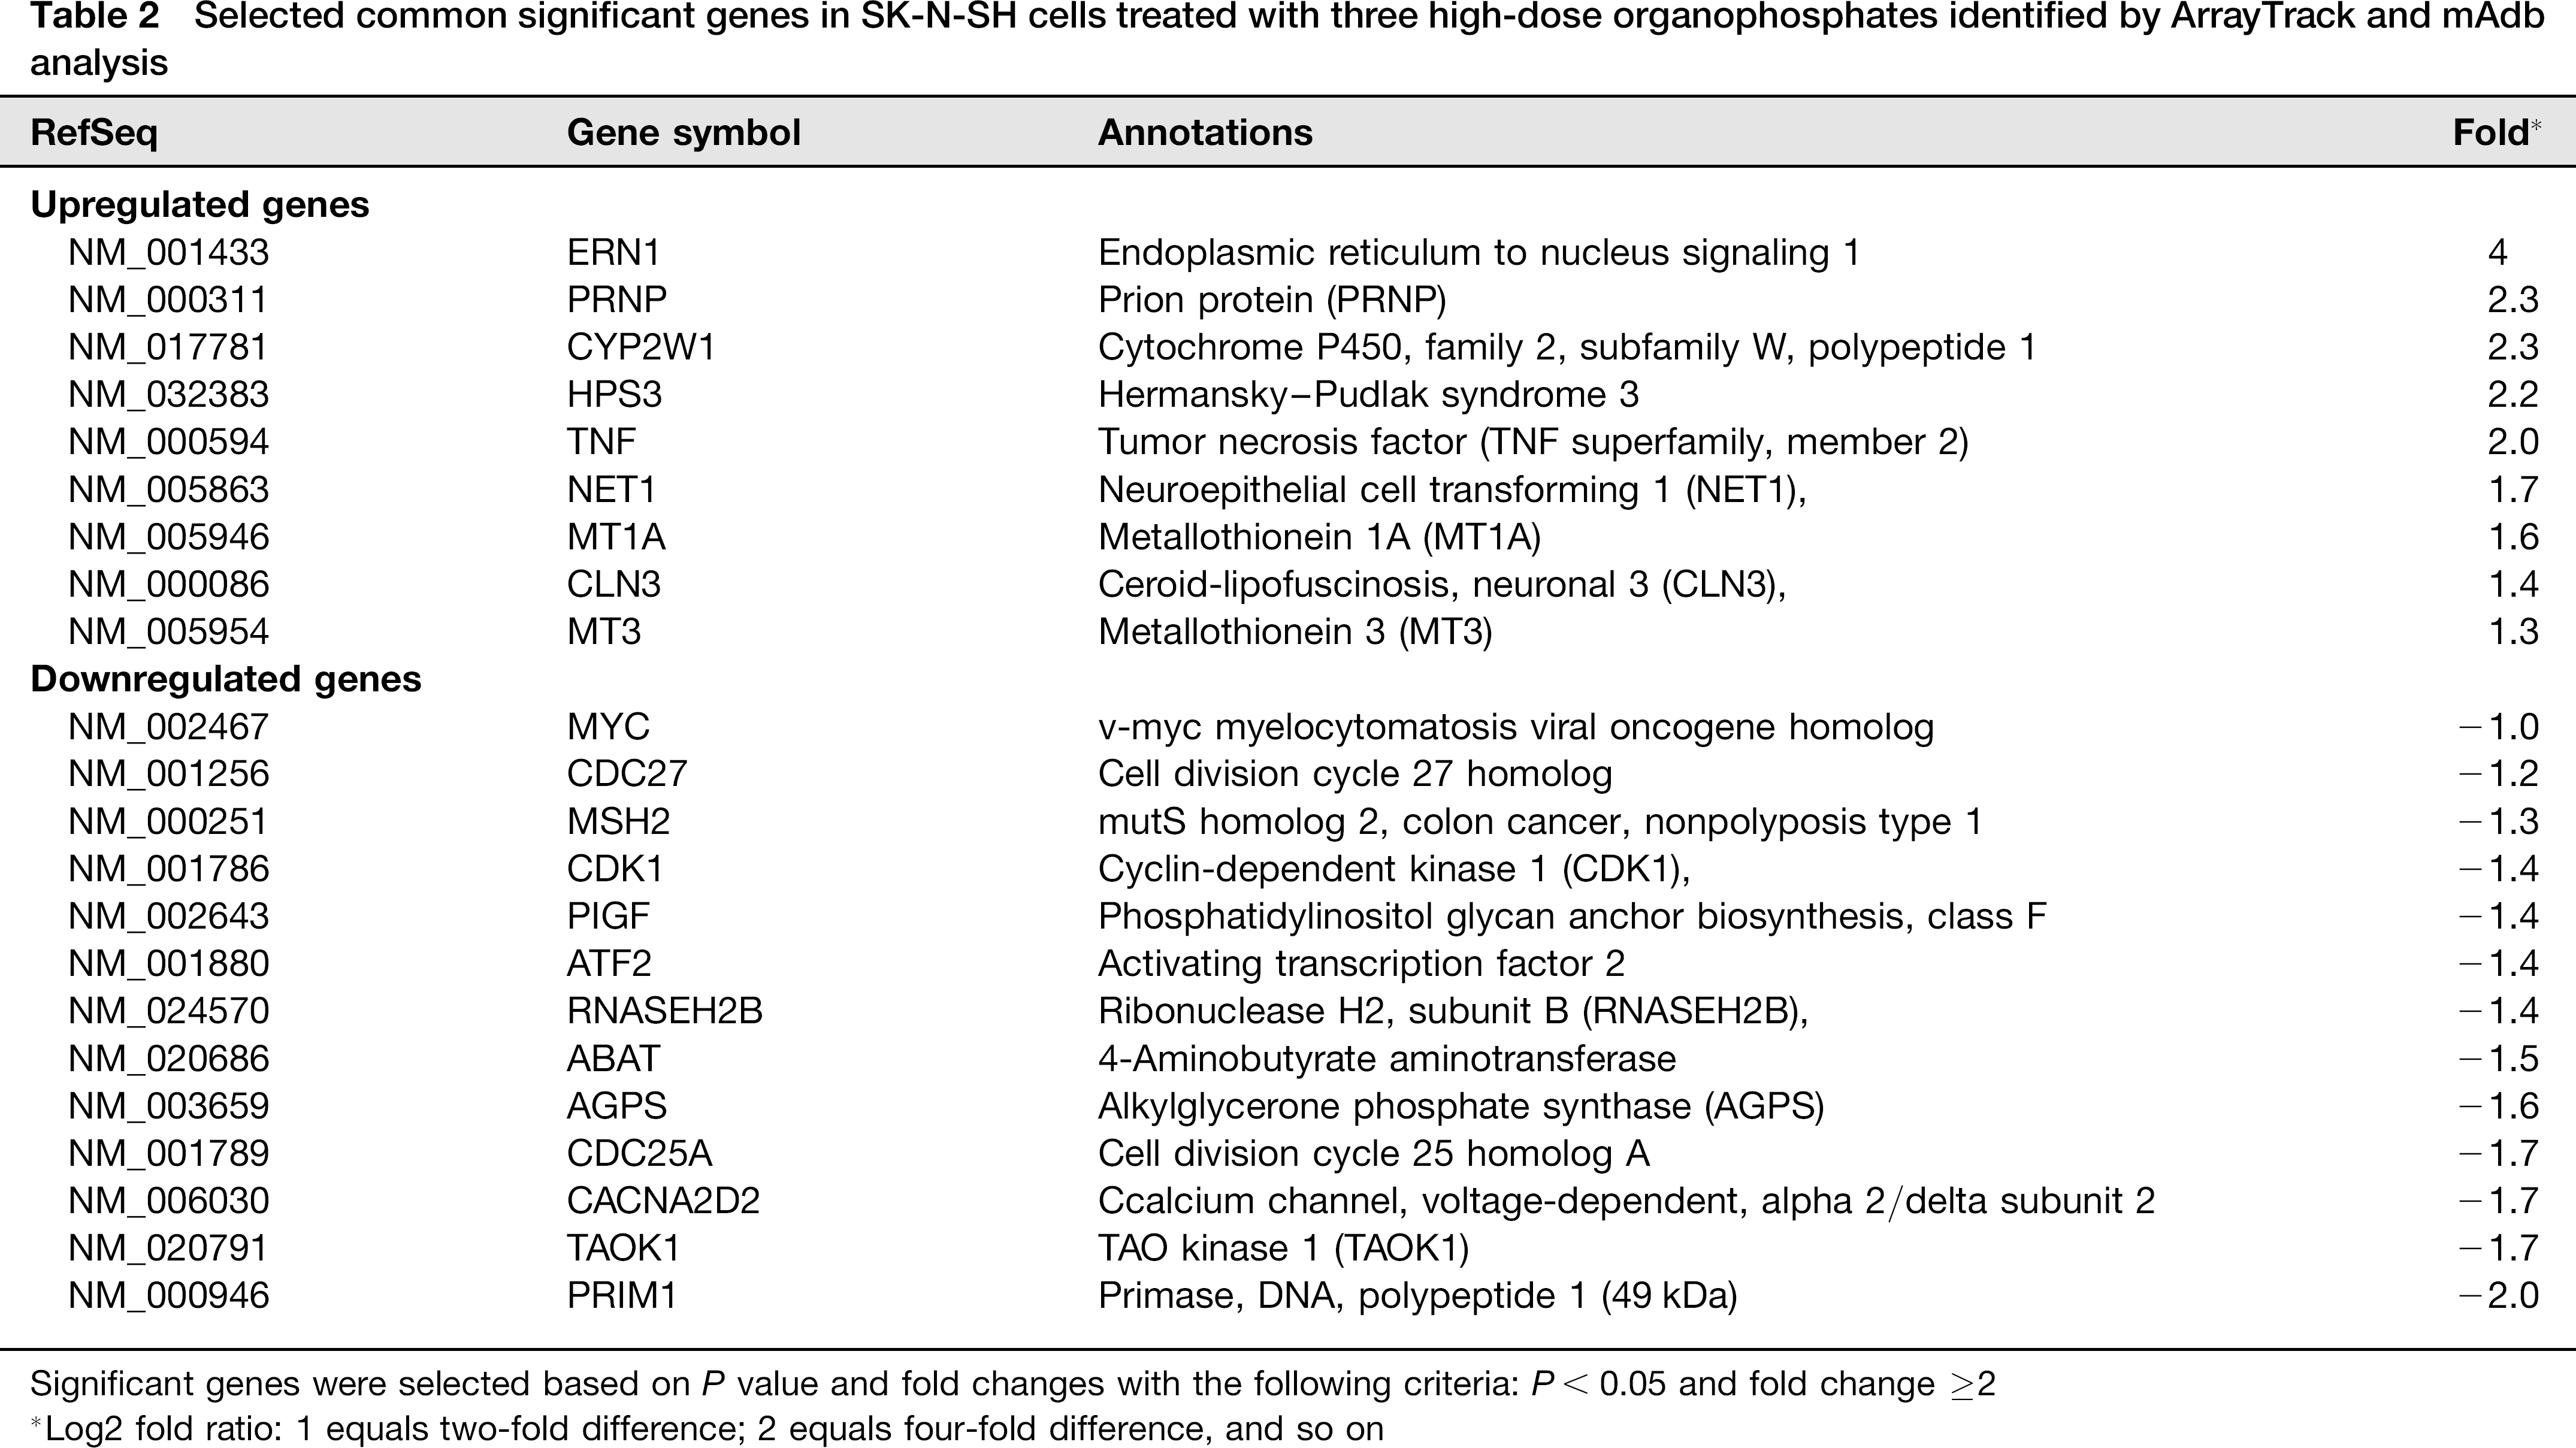
Significant genes were selected based on P value and fold changes with the following criteria: P < 0.05 and fold change ≥2
Log2 fold ratio: 1 equals two-fold difference; 2 equals four-fold difference, and so on
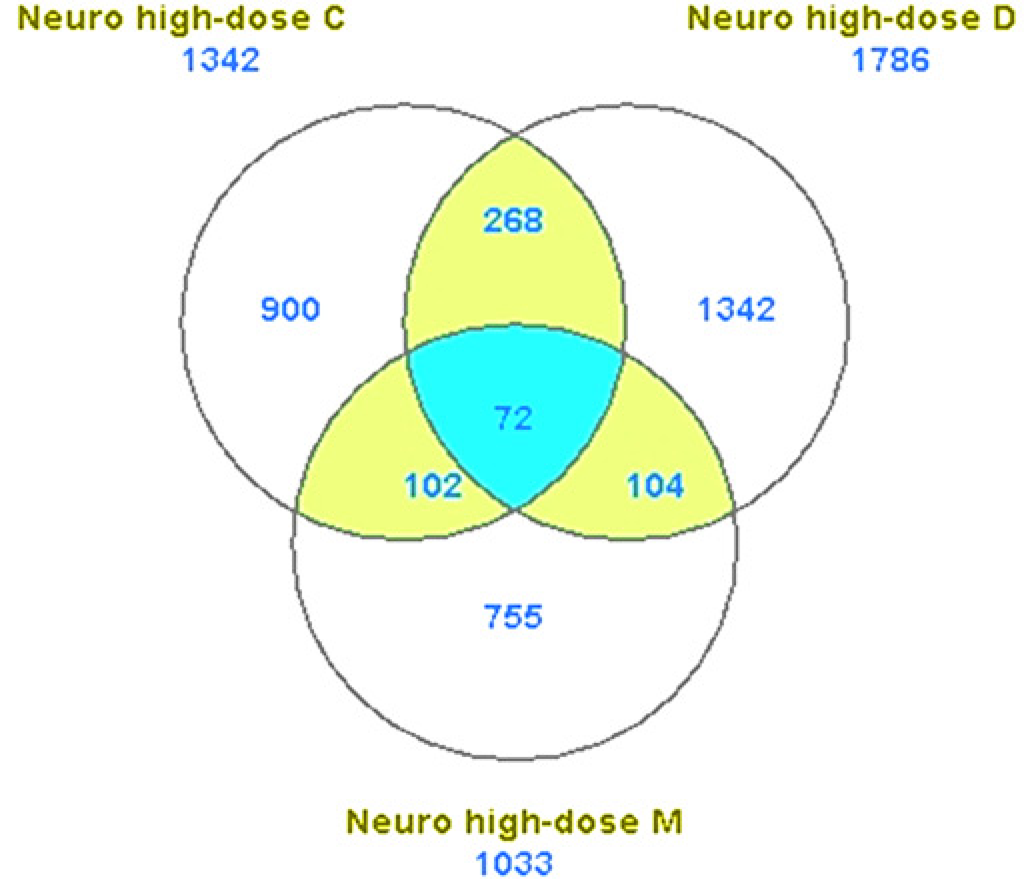
Common significant genes identified in SK-N-SH cells using ArrayTrack. Cells were treated with high-dose of three OPs (Chlorpyrifos, Dichlorvos and Methamidophos) and the significant genes were extracted by ArrayTrack. The common significant genes for high-dose (72) were the overlap among all the three different OP treatments. (A color version of this figure is available in the online journal)
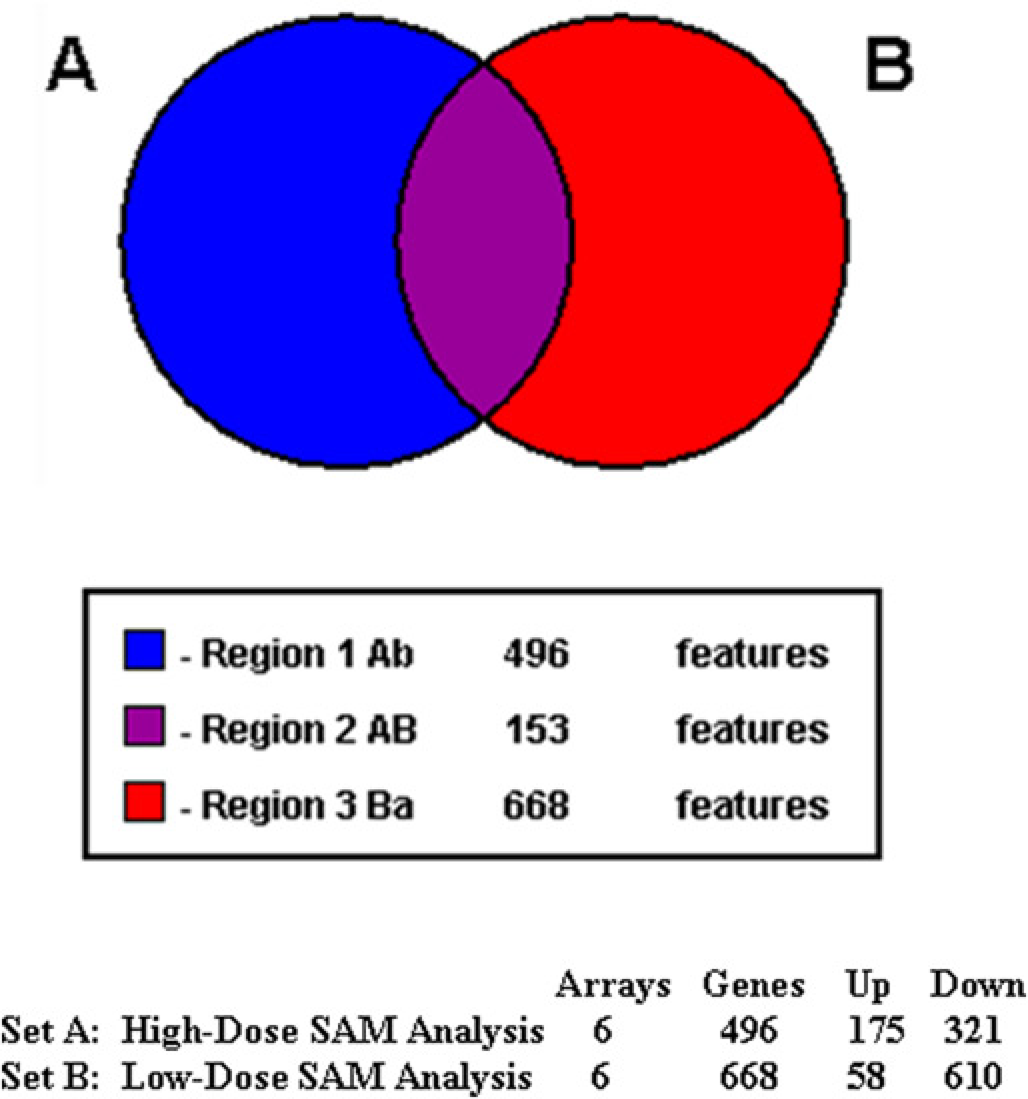
Common significant genes identified in SK-N-SH cells using mAdb. Cells were treated with high or low dose of three different OPs (duplicate for each OP) and the significant genes were extracted by mAdb. Six arrays for high-dose treatments and six arrays for low-dose treatments were used for the analysis. The common significant genes for both high-dose (496) and low-dose (668) treatments were further analyzed to find the overlapping common significant genes (153). The upregulated (Up) and downregulated (Down) genes were also shown for high- and low-dose treatments. OP, organophosphate. (A color version of this figure is available in the online journal)
In addition to upregulated genes, many genes implicated in cell cycle pathway, DNA replication and metabolism were downregulated.Table 3 shows the major pathways obtained by KEGG pathway analysis performed on the common differentially expressed genes induced by high-dose OPs. KEGG pathway analysis indicated inhibitory effects of OP treatments on many pathways, including metabolic pathway (AGPS, ABAT, PIGF, etc), cell cycle pathway (CDC25A, CDK1, CDC27, PRIM1, RNASEH2B, MYC, etc) and MAPK (mitogen-activated protein kinase) signaling pathway (TAOK1, CACNA2D2, ATF2, etc), as shown in Tables 3–5.
Major pathways obtained from KEGG analysis of significant genes induced by high- or low-dose OP treatments

OP, organophosphate; MAPK, mitogen-activated protein kinase
Significant genes in cell cycle pathway induced by high- or low-dose organophosphate treatments obtained from KEGG analysis
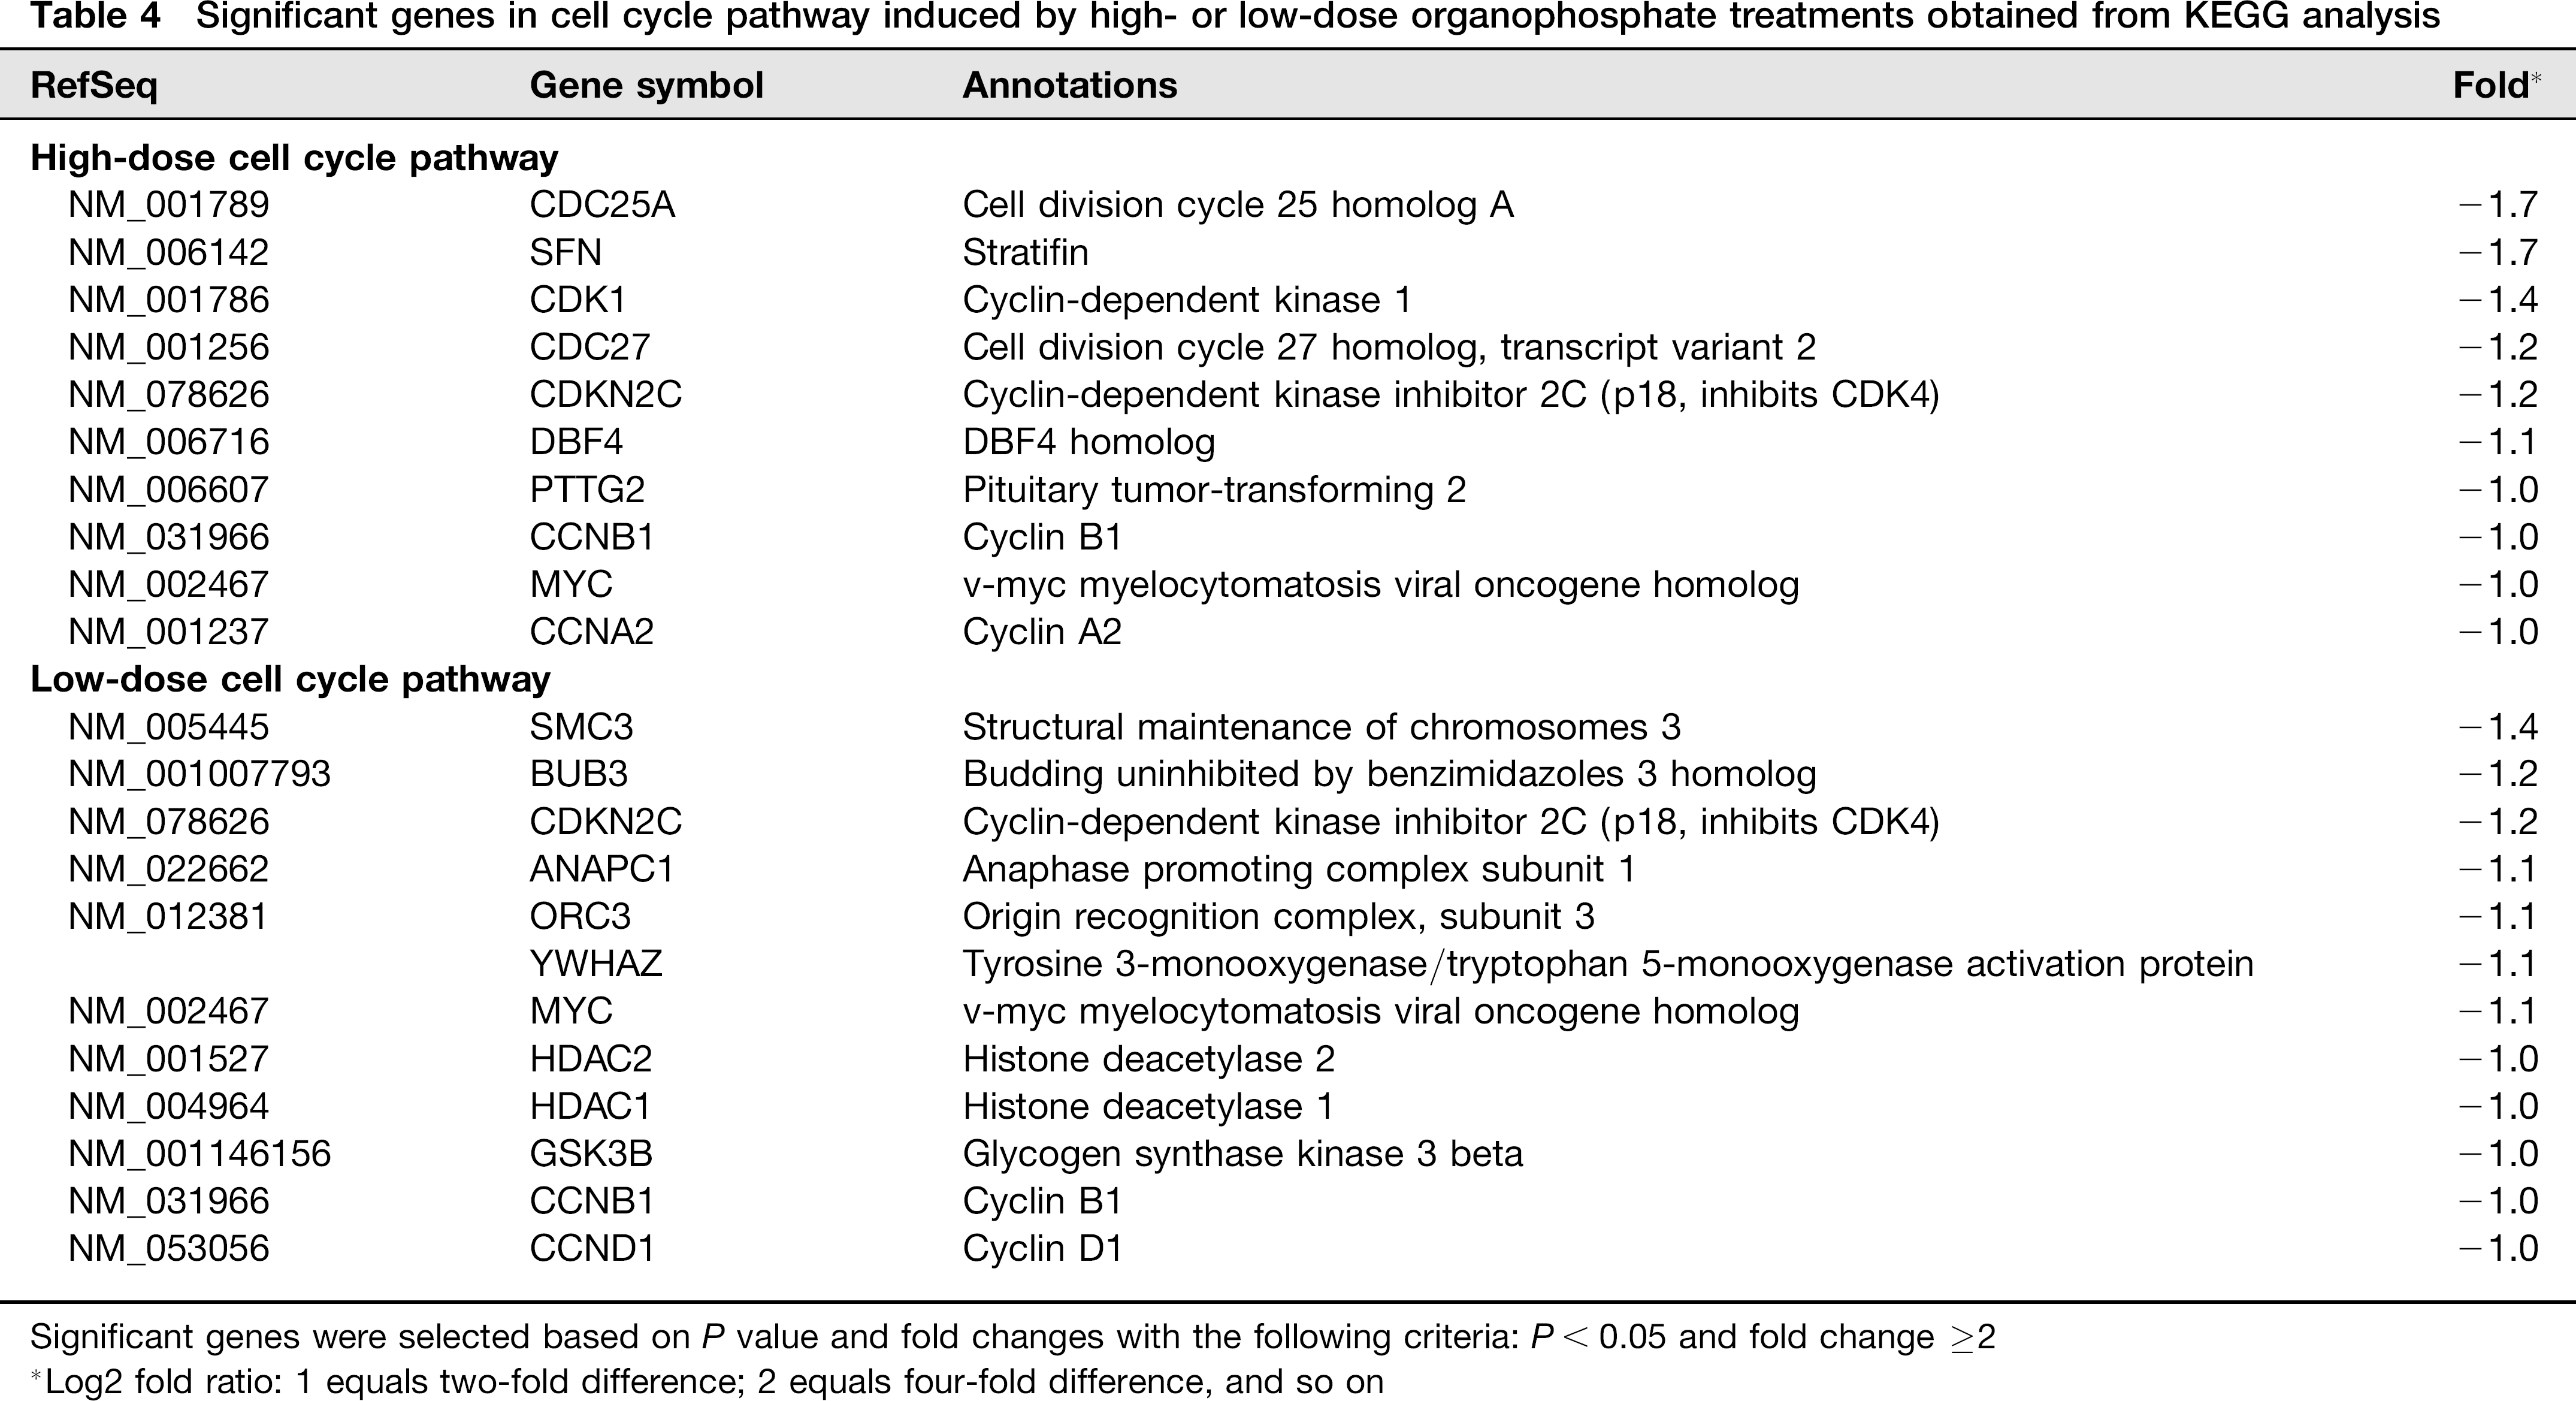
Significant genes were selected based on P value and fold changes with the following criteria: P < 0.05 and fold change ≥2
Log2 fold ratio: 1 equals two-fold difference; 2 equals four-fold difference, and so on
Significant genes in MAPK pathway induced by high- or low-dose OP treatments obtained from KEGG analysis
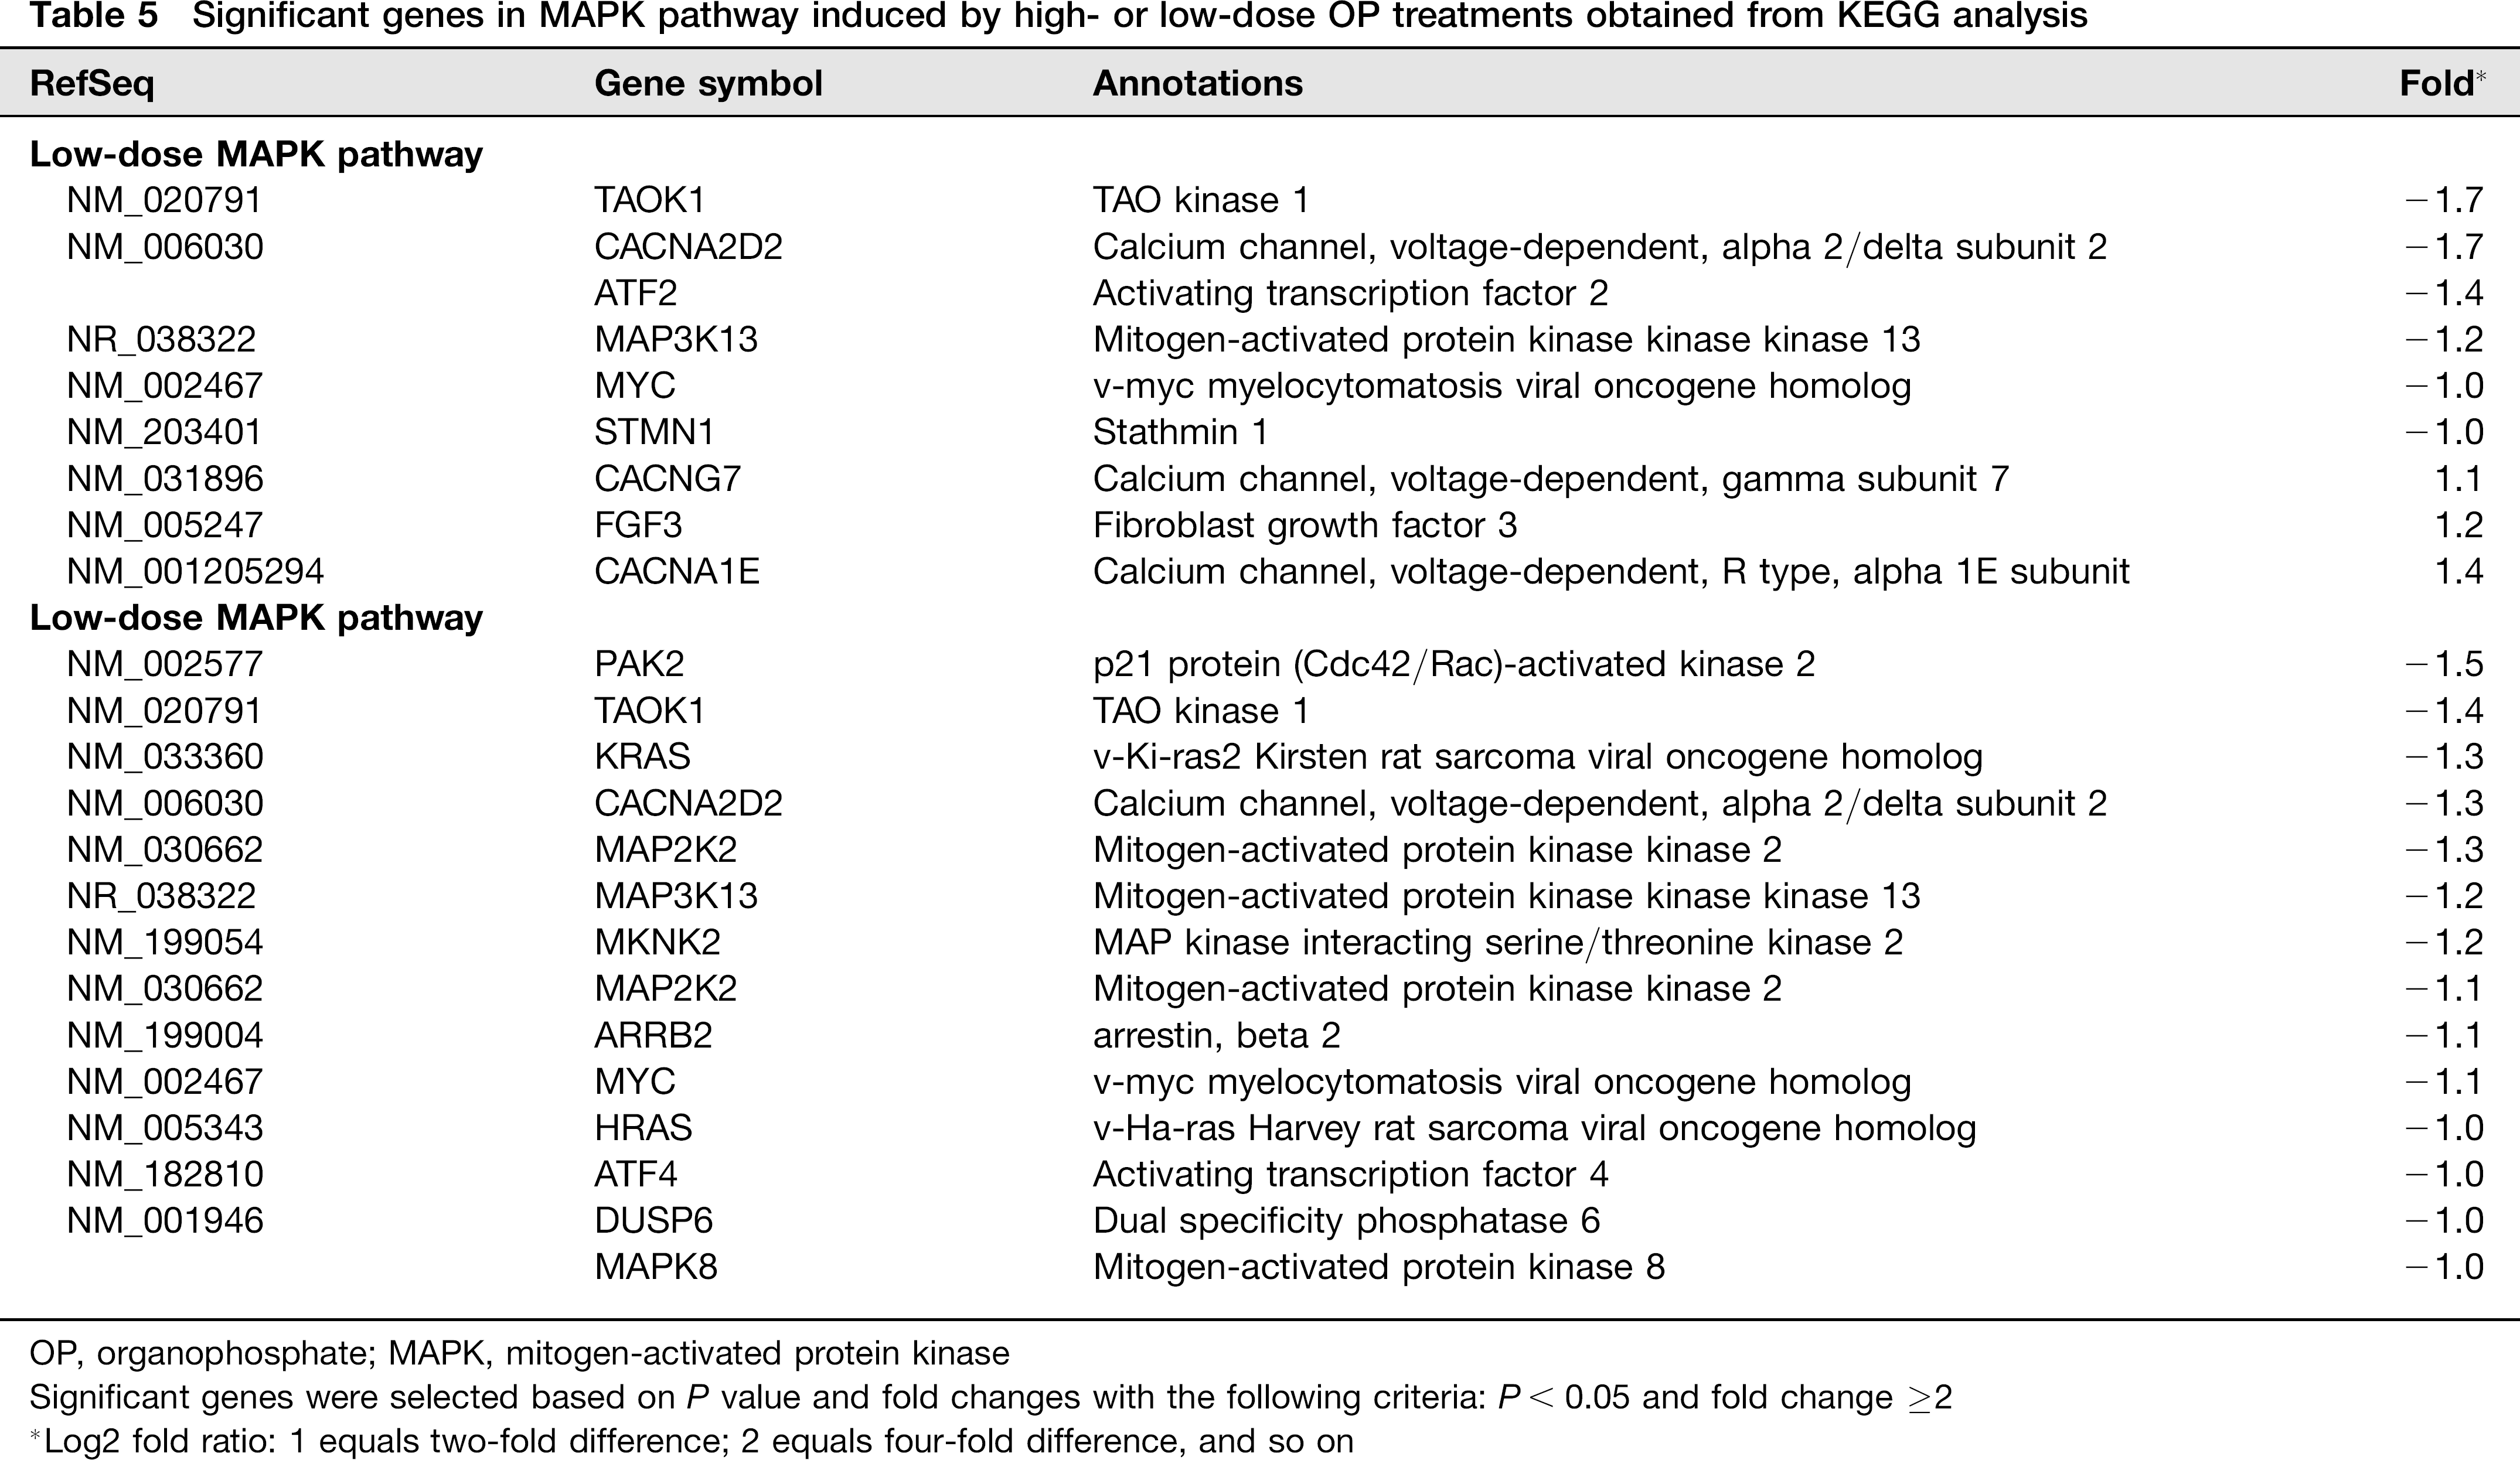
OP, organophosphate; MAPK, mitogen-activated protein kinase
Significant genes were selected based on P value and fold changes with the following criteria: P < 0.05 and fold change ≥2
Log2 fold ratio: 1 equals two-fold difference; 2 equals four-fold difference, and so on
Identification of common significant genes and pathways induced by low-dose OPs in neuroblastoma cells
We also identified the common significant genes induced by low-dose treatments with three different OPs, using SAM with FDR <0.025. A total of 668 common significant genes were differentially expressed in response to low-dose treatments: 58 upregulated genes and 610 downregulated genes (Figure 3). As shown in Figure 3, there were 153 common significant genes between high- and low-dose treatments.Table 3 shows the major pathways induced by the low-dose treatments with three different OPs. Three of the four major pathways were common between high- and low-dose treatments: metabolic pathway; cell cycle pathway and MAPK signaling pathway. Interestingly, in addition to the common pathways induced by both high- and low-dose treatments of OPs, the low-dose treatments of OPs induced strong inhibitory effects on the genes involved in spliceosome pathway. A total of 18 genes involved in the spliceosome pathway was downregulated by low-dose OPs (Table 6). Figure 4 shows the standard spliceosome pathway, which is made up of five small nuclear ribonucleoproteins (snRNPs), U1,U2, U4, U5 and U6 snRNPs, and several spliceosome-associated proteins. SNRNP70 encoded U1 snRNP, SF3A3 encoded U2 snRNP, LSM encoded U4/U6 snRNP and PRPF8 encoded U5 snRNP were down-regulated by low-dose treatments. Other snRNP-associated proteins, such as HNRNPK, HNRNPA1, NCBP2, CWC15, SRSF1, RBM8A, SART1, etc, were also downregulated (Table 6).
Genes involved in spliceosome pathway obtained from KEGG analysis of significant genes induced by low-dose treatments with three different organophosphates

Significant genes were selected based on P value and fold changes with the following criteria: P< 0.05 and fold change ≥2
Log2 fold ratio: 1 equals two-fold difference; 2 equals four-fold difference, and so on
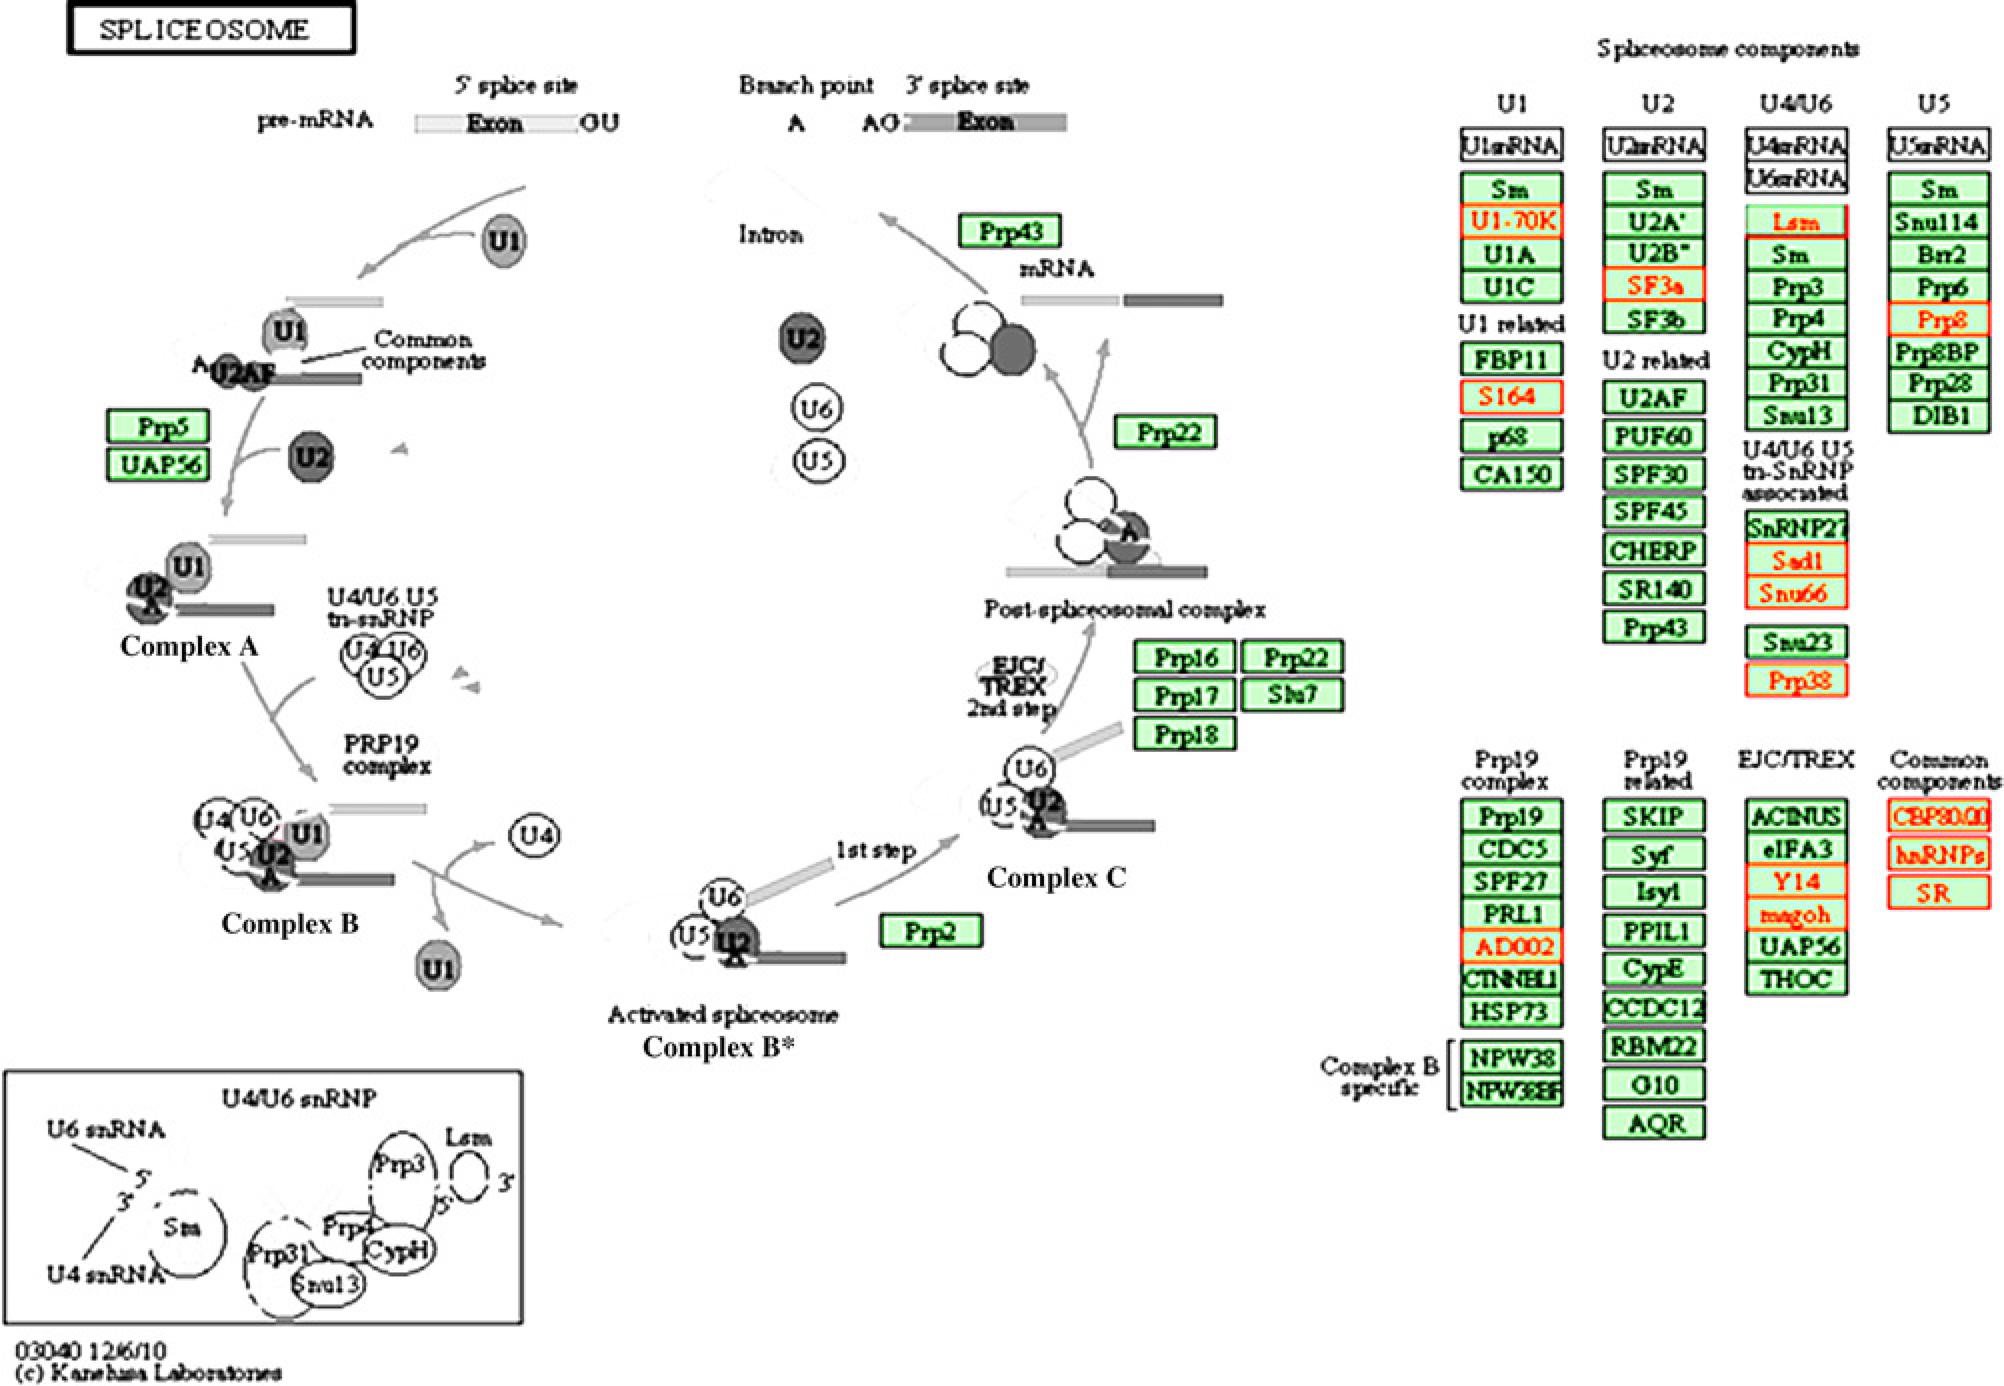
Representative spliceosome pathway. One of the most significant pathways identified by KEGG analysis of significant genes induced by low-dose treatments was shown here. (A color version of this figure is available in the online journal)
Verification of gene changes by RT-PCR and qPCR
In order to verify the microarray results, we selected three upregulated and three downregulated genes induced by high-dose treatments for RT-PCR assay. The results (Figure 5a) showed that all the three upregulated genes (CYP2W1, HPS3 and TNF-α) and one downregulated gene (MSH2) identified by our microarray analysis could be confirmed by semi-quantitative assessment of the amounts of mRNA/cDNA for these genes using RT-PCR. There were no obvious RT-PCR bands detected with the other two downregulated genes (data not shown). Using a more quantitative measurement of the changes in expression of these genes, we compared mRNA/cDNA levels for these genes in cells treated with high-dose OPs and in cells of the non-treated control culture by qPCR. The changes of expression of these genes in OP-treated cells, both upregulation and downregulation identified by the microarray analysis, could similarly be verified by examining the amounts of their mRNAs using qPCR (Figure 5b). However, the degree of changes in expression of these genes varied somewhat in cells treated with the three different OPs.
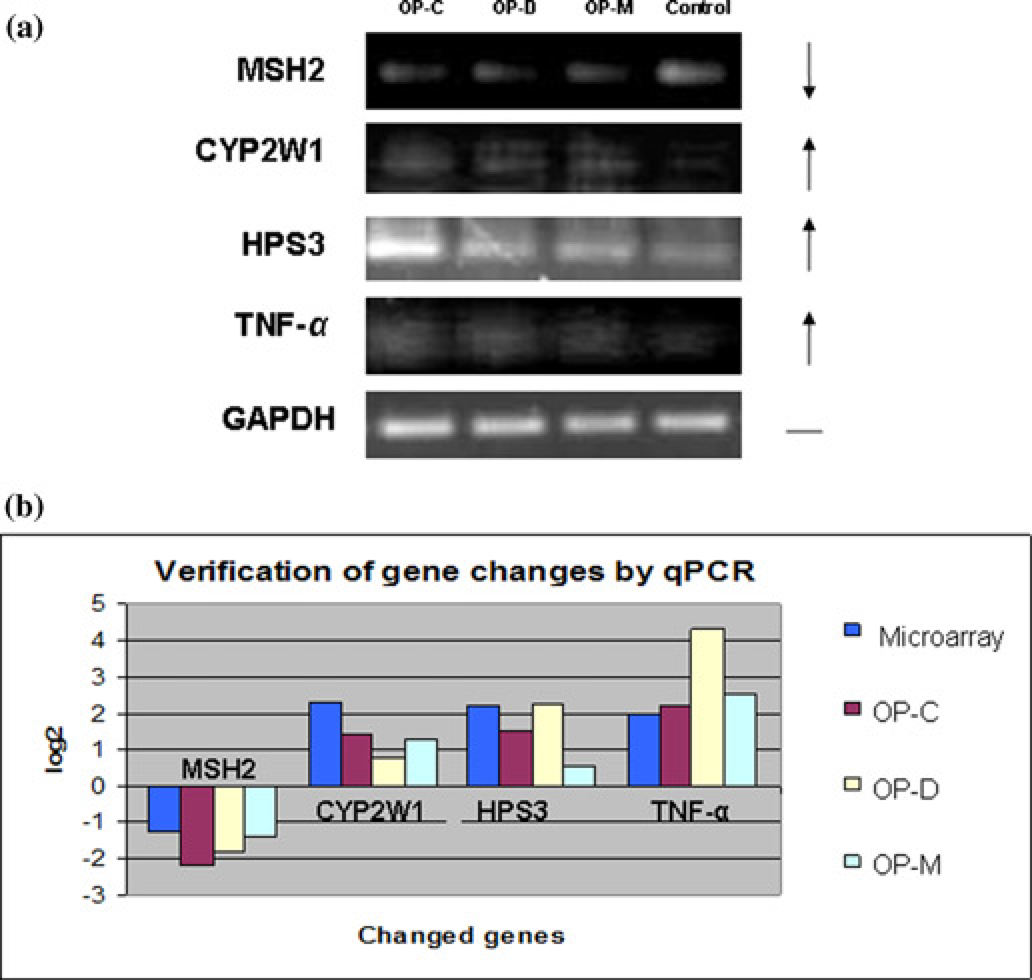
Verification of gene changes by RT-PCR and qPCR. The first-strand cDNA was synthesized using Superscript II Reverse Transcriptase from 1 μg of total RNA with an oligo-dT primer and used as a template for PCR. OP-C, OP-D and OP-M represent neuroblastoma cells treated with high-dose chlorpyrifos, dichlorvos and methamidophos, respectively. (a) The RT-PCR results are shown: Control represents neuroblastoma cells treated with 2% DMSO. Upregulated genes are marked with ↑; downregulated with ↓
Detection of cell apoptosis by TUNEL assay
Our microarray analysis revealed that many pathways associated with cell apoptosis and/or cell death had been activated in the neuroblastoma cells treated with high-dose OPs. The neuroblastoma cells in cultures treated with the OPs were examined using TUNEL assay for evidence of an increase of apoptosis. All three high-dose OP treatments evidently induced many of the neuroblastoma cells to undergo apoptosis, seen with positive green fluorescent staining in the assay, less found in the non-treated controls (Figure 6a). All three different OP treatments induced many folds increase of cell apoptosis in the cultures in comparison with those in the control cultures (Figure 6b). OP-D and OP-M appeared to be more toxic than OP-C in terms of the effectiveness of inducing apoptosis in neuroblastoma cells.
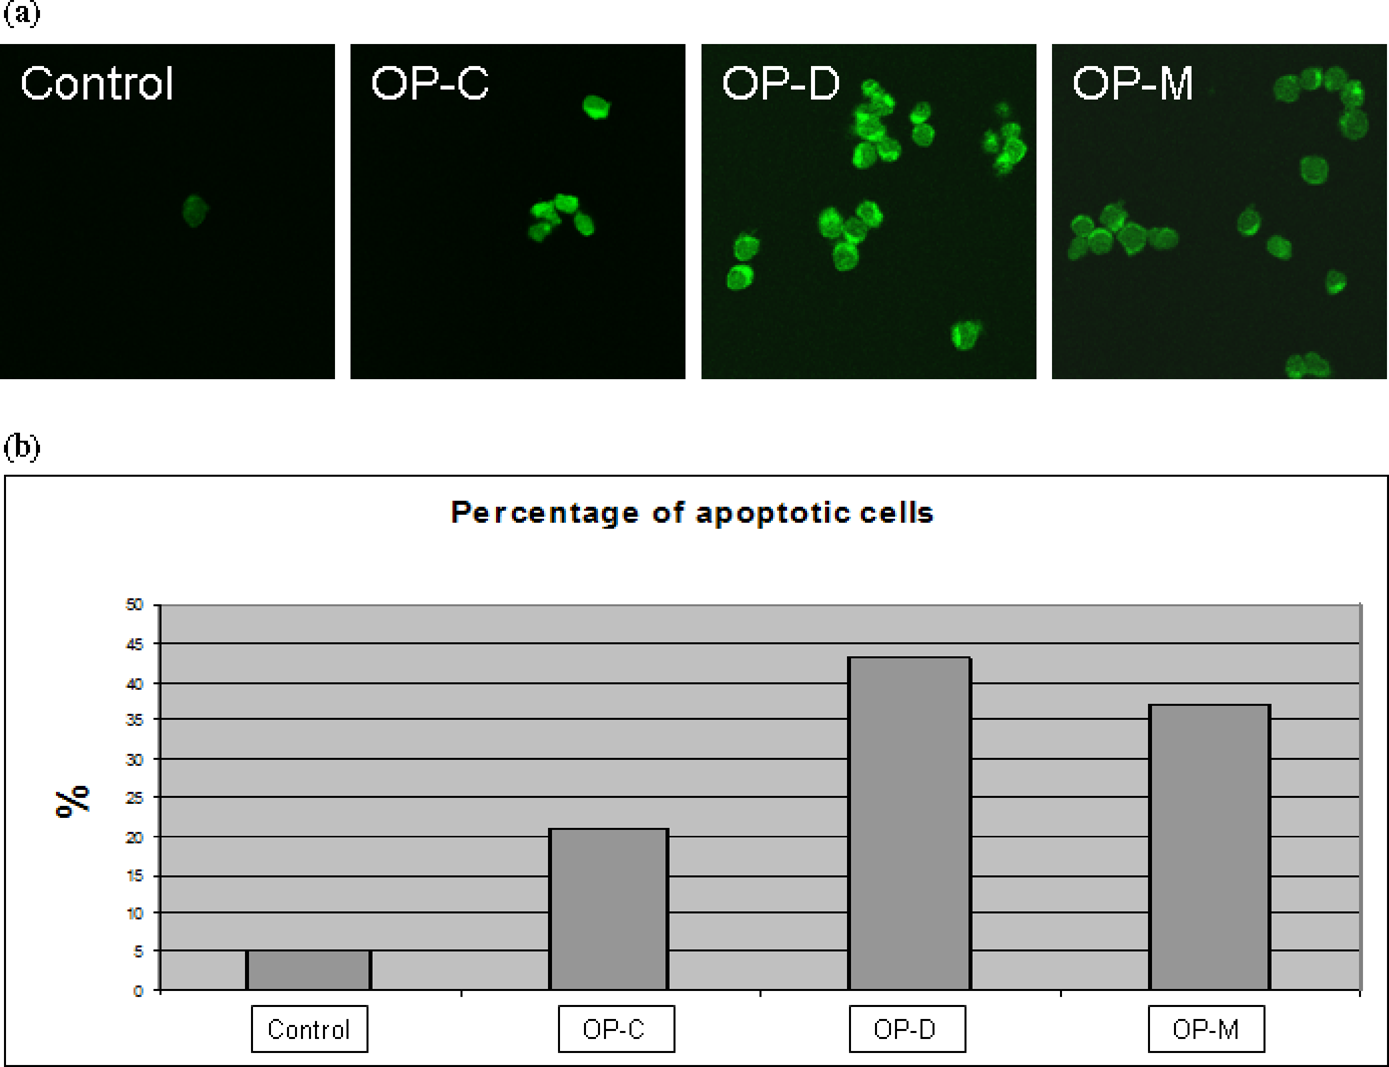
The TUNEL assay was carried out by DeadEnd Fluorometric TUNEL System Kit. The high-dose chlorpyrifos (OP-C), dichlorvos (OP-D) and methamidophos (OP-M) were used to treat SK-N-SH cells for 24 h. (A) The images of TUNEL positive cells were captured by a confocal microscope (× 400). (B) Quantitative result of TUNEL assay was analyzed: 100 cells were counted for each sample. The percentage of TUNEL-positive cell (green fluorescent) number to the total cell number is shown. TUNEL, terminal deoxynucleotidyl transferase-mediated dUTP nick-end labeling; OP, organophosphate; (A color version of this figure is available in the online journal)
Discussion
The main goals for our study were to elucidate the molecular mechanism of OP injury and find potential biomarkers for evaluating the degree of OP poisoning to human cells. Three representative human cell lines (alveolar epithelial cells A549, neuroblastoma cells SK-N-SH and hepatocellular cells HepG2) were initially studied and treated, respectively, with one of the three OPs (chlorpyrifos, dichlorvos or methamidophos) at high-dose (LC20) or low-dose (1/20 of LC20) for 24 h. Changes in global gene expression profiles in three different cell lines treated with each of the three OPs were analyzed by ArrayTrack. Hundreds of genes with significant changes in expression (P < 0.05 and fold changes >1.5) were identified as ‘significant genes’ for each cell line treated with the three different Ops, respectively. We found few common significant genes with similar changes in expression among the three different cell lines treated by either high- or low-dose of any OP studied (data not shown). OP-induced injury appeared to be rather tissue-specific and dose-related.
Among the three different cell lines examined in this study, human neuroblastoma cells exposed to all the three different OPs at either high or low dose clearly had the highest numbers of significant genes that were further analyzed using mAdb. We examined the significant genes in neuroblastoma cells treated with three different OPs in order to identify the common mechanisms of OP injury. In addition, we compared the significant genes and the pathways involved in the neuroblastoma cells exposed to the high and the low dose of OPs. Human neuroblastoma cells were previously used as a model test system for OP-associated injury. 17 It was reported that mipafox (a well-known organophosphorus cholinesterase inhibitor) caused organophosphorus-induced delayed neuropathy not only by their effects on neurite length, but also by their effects on Ca2+ homeostasis in differentiated neuroblastoma cells. 18
In our genome-wide analysis of the common significant genes induced by all three different OPs, we found that the high- and low-dose treatments in neuroblastoma cells were apparently affecting different genes that showed significant changes in expression. In other words, not too many common significant genes were identified in cells with high- and low-dose treatments of all three OPs (Figure 3). However, we noticed that significant genes identified in both high-dose and low-dose treatments were often involved in similar pathways. The KEGG pathway analysis revealed three out of four top significant pathways involved in the high-dose and low-dose treatments were actually the same (Table 3). Specifically, metabolic, cell cycle and MAPK signaling pathways were the three pathways found to be downregulated by both high- and low-dose treatments with all three different OPs (Tables 3, 4 and 5). MAPK signaling pathway plays an important role in several key cellular functions, including cell proliferation, differentiation and migration. 19 Downregulated effects on metabolic, cell cycle and MAPK signaling pathways were consistent with the apparent biological conditions that cell growth and proliferation were markedly inhibited in the cells with both high-and low-dose treatments.
Among the downregulated significant genes (Table 2), PRIM1 (primase, DNA, polypeptide 1) and CDC25A (cell division cycle A) are two important genes known to be involved in cell growth and cell cycle processes. PRIM1 is a small unit of a heterodimer in DNA primase, which plays key roles in DNA replication and synthesis of RNA primer. 20 CDC25A is a member of the CDC25 family of phosphatases, and plays important roles in cell cycle regulation, particularly at G1/S and G2/M check points.21,22 Downregulation of the PRIM1 and CDC25A would directly inhibit DNA replication, cause cell cycle arrest and result in cell death. It is important to note that changes of expression (down- or up-regulation) of the ‘significant genes’ identified by the microarray analysis could be verified by examining specifically the amounts of mRNA in neuroblastoma cells treated with various OPs using both RT-PCR and qPCR (Figures 5a and b).
In addition to the inhibitory effects found on the three pathways involved in cell metabolism, growth and proliferation, our results showed that high-dose treatments with all three different OPs (LC20) induced increased expression of genes such as ERN1, PRNP, NET1, CLN3, MT1A and MT3 in the neuroblastoma cells. ERN1 encodes a small nucleus protein which activates cell apoptotic process and induces cell cycle arrest.23,24 NET1 gene is involved in the induction of apoptosis and regulation of cell growth. 25 CLN3 is a multifunctional gene which is particularly involved in the regulation of cell death and neuron apoptosis.26,27 MT1A and MT3 play a negative role in the regulation of cell growth and neurogenesis.28,29 Activation of these genes would facilitate the cellular apoptotic process and further inhibit cell growth, thus results in rapid cell death. The marked increase of cell apoptosis in the OP-treated cultures could also be documented by TUNEL assay (Figures 6a and b). In the present study, OP-D and OP-M appeared to be more toxic than OP-C in the effect of inducing neuroblastoma cells to undergo apoptosis.
In comparison, our studies of significant genes in the neuroblastoma cells treated with low dose of the three OPs did not identify any of those apoptotic genes activated significantly by high-dose treatments of the three OPs. In contrast, the KEGG analysis showed that low-dose treatments of all three OP induced significant decreases in the expression of the genes involved in a unique pathway with spliceosome process (Table 6 and Figure 4). Most eukaryotic genes are expressed as precursor mRNAs that are converted to mRNA by a macromolecular complex ‘spliceosome’ through splicing, an essential step of gene expression in which non-coding sequences (introns) are removed and coding sequences (exons) are ligated together. 30 Spliceosomes are a dynamic family of complex particles that assemble on the mRNA precursor and help fold it into a conformation that will then allow transesterification to proceed. The proteins coded by the downregulated spliceosom-associated genes, HNRNPK (heterogeneous nuclear ribonucleoprotein K 31 ) and HNRNPA1 (heterogeneous nuclear ribonucleoprotein A1 32 ) genes, belong to the subfamily of ubiquitously expressed heterogeneous nuclear ribonucleoproteins (hnRNPs). The hnRNPs are RNA-binding proteins that complex with heterogeneous nuclear RNA (hnRNA) and pre-mRNAs in the nucleus. They participate in pre-mRNA processing, mRNA metabolism, nuclear/cytoplasm transport and modulation of splicing site selection. Our results suggest that the low-dose treatments, unlike the high-dose treatments, might not lead to rapid cell death. Instead, exposure to low-dose of OPs could significantly decrease expression in genes of the spliceosome pathway and affect the normal processing of mRNA representing a new form of OP-associated patho-genesis. In this context, a recent study in patients with mye-lodysplasia syndromes showed frequent pathway mutations of splicing machinery spliceosome. 33
Our results also showed that the expressions of some genes were commonly affected in the neuroblastoma cells exposed to all three different OPs at two different doses, respectively (Figure 3). This finding suggests that there could be a common mechanism in OP-associated injury. Identification of these common significant genes might be important for understanding the molecular mechanisms in cell injury elicited by OPs. They could also serve as potential candidates for biomarkers to evaluate the degree of OP-associated injury in neuronal cells as well as potential targets for therapeutic regimens against OP-associated toxicities.
Footnotes
Acknowledgements
This research was supported by a grant from Defense Threat Reduction Agency (DTRA: #CBS.MEDCHEM.01.10.FDA. PP008). We thank Dr Amy Yang for her help on microarray experiments and data analysis, Dr Ephrem Tekle for his help on confocal microscope.