
Abstract
Catch-up growth in adult (CUGA) is increasingly proposed as an important causative factor for the widespread insulin resistance (IR)-related diseases especially in developing countries/territories. We aimed to investigate the effects of CUGA to insulin sensitivity, lipid profile and stress in rats, as well as the probable relationship among them. Male Sprague-Dawley rats were randomly divided into six groups for two sampling points: caloric restriction group (R4) and normal chow controls for four weeks (NC4); CUGA re-fed with normal chow (RN4), CUGA re-fed with high-fat diet (RH4), normal chow controls (NC8) and high-fat diet controls (HF8) for eight weeks. Visceral fat accumulation (visceral adipose tissue [VAT] percentage), systemic (plasma corticosterone) and local (HSD11B1 mRNA expression in skeletal muscle [SkM] and VAT) stress, whole-body and peripheral insulin sensitivity were determined in this study. After four weeks of caloric restriction, R4 rats showed increases in systemic and local stress, decreases in visceral fat accumulation and no IR (whole-body or peripheral). Yet, after re-feeding, sustained systemic and local stress, remarkable visceral fat accumulation and IR (whole-body and peripheral) were found in RN4 compared with NC8, in RH4 compared with NC8 and HF8. Our findings demonstrated that CUGA rats were characterized by significant IR, visceral fat accumulation and stress. These changes were more severe in CUGA re-fed with high-fat diet. The interaction of sustained caloric restriction-induced stress and re-feeding might be of utmost importance in the etiology of visceral fat accumulation and IR in CUGA.
Introduction
Catch-up growth, a phenomenon that embodies an accelerated recovery after weight loss or growth retardation, is widely considered to increase risks for insulin resistance (IR)-related diseases later in life. 1 In recent decades, following the rapid economic development, developing countries/ territories generally have undergone nutrition promotion while their environments shifting from food shortage to food abundance, which is the most common cause of catch-up growth. 2 Furthermore, these changes are associated with an increasing prevalence of IR-related diseases such as type 2 diabetes.3,4 Thus, catch-up growth is increasingly recognized as one of the most important causative factors for the widespread IR-related diseases in the world.1,5
Nutrition promotion after undernutrition could occur in prenatal, childhood or adult life. Catch-up growth in adult (CUGA) is usually developed by re-feeding after caloric restriction in animals. In our study, we found that visceral fat accumulation and IR developed soon while re-feeding after caloric restriction in CUGA. 6 It is reported that skeletal muscle (SkM) mitochondrial abnormality, 7 suppressed ther-mogenesis 8 and thrifty metabolism 9 might play an important role in the pathogenesis of visceral fat accumulation and IR in CUGA. Actually, in these studies, the essential difference between CUGA and normal controls is the caloric restriction before re-feeding. Therefore, caloric restriction must be of utmost importance in the etiology in CUGA. The possible effects of caloric restriction on metabolism are complex, including decrease in metabolic rate 10 and increase in stress. 11 The drop in metabolic rate has attracted more interest and been considered as an important link between mitochondrial abnormality, suppressed ther-mogenesis, thrifty metabolism, lipid accumulation and IR, 10 In view that the characteristics of CUGA (visceral lipid accumulation and IR) is similar to the clinical manifestations of hypercortisolism, 12 and caloric restriction can elevate the glucocorticoids and chronic stress level. 11 We postulated that chronic stress might play a crucial role in the pathogenesis of CUGA and its main features (visceral fat accumulation and IR).
Glucocorticoid (corticosterone in rat, cortisol in human) is the common pathway of the sympatho-adrenomedullary and hypothalamo-pituitary-adrenocortical systems during stress response. Recently, many reports have been published that the stress-induced IR depends on the action of glucocorticoid on target tissues, which is determined by intra-cellular active glucocorticoid concentrations and regulated not only by circulating steroid concentrations, but also by intracellular 11β-hydroxysteroid dehydrogenase type 1 (HSD11B1). 13 HSD11B1 is an enzyme catalyzing the in vivo conversion of inactive to active glucocorticoids 13 and the expression level of HSD11B1 positively correlates with its activity. 14 Studies have also shown that increased HSD11B1 activity in SkM contributes to the pathogenesis of IR. 15 The molecular mechanisms involved include a defect in inhibition of Ser473 phosphorylation of protein kinase B (PKB) in SkM. 16 In addition, the increases in HSD11B1 activity and intra-adipose glucocorticoid levels results in lipid deposition in adipose tissue (AT). 17 We therefore further assessed the insulin signaling and HSD11B1 as a marker of local glucocorticoid activity.
The main objective of this present study is to explore the detailed changes in stress level, lipid profile and IR in CUGA rats. We also tentatively postulate that the increase in visceral fat accumulation and IR are due to the interaction between nutrition shift and stress.
Materials and methods
Animals and diets
Male Sprague–Dawley rats (aged six weeks, weighing 140–180 g) were obtained from Laboratory Animal Center of Tongji Medical College, Huazhong University of Science and Technology. All of them were housed individually in stainless steel cages with free access to water and subjected to controlled temperature (22±3°C), lighting (lights on 06:00-18:00) and relative humidity (50 ± 10%). All rats were adapted to surrounding environments for a week before the experiments and then randomly allocated to six groups for two different sampling points as illustrated in Figure 1a, with eight rats (N = 8) in each group. For four weeks sampling point: R4 (maintained on caloric restriction for 4 weeks) and its control NC4 (normal chow for 4 weeks) were prepared for four-week sampling points. For eight weeks sampling point: RN4 (CUGA by normal chow, re-fed with weight-matched normal chow for four weeks after four weeks of caloric restriction), RH4 (CUGA by high-fat diet, re-fed with weight-matched high-fat diet for four weeks after four weeks of caloric restriction), NC8 (fed ad libitum with normal chow for 8 weeks as normal controls) and HF8 (fed ad libitum with high-fat diet for eight weeks as high-fat diet controls). They were fed with either a standard rodent chow or a high-fat diet as scheduled above (shown in Figure 1a) once per day. The normal chow (13.68%, 64.44% and 21.88% of calories derived respectively from fat, carbohydrate and protein) was provided by the Laboratory Animal Center mentioned above. The high-fat diet (containing in terms of calories derived 59% fat, 20% carbohydrate and 21% protein) was made as described previously by Kraegen. 18 During caloric restriction, the food intake of CUGA rats was restricted to 60% of that eaten by their ad lib-fed companions of the same weight. During re-feeding, the CUGA animals were pair-fed with their weight-matched, ad libitum fed controls (RN4 versus NC8; RH4 versus HF8). This is important to explore the diet shift (nutrition promotion) itself and to exclude any influence of gap between appetite and expenditure, which probably result in nutrient excess in these animals. 19 All the experimental procedures performed in this study were approved by the Animal Ethics Committee in our university and in accordance with Hubei Province Laboratory Animal Care Guidelines for the use of animals in research.
Feeding regimen (a) and energy intake (b). The Catch-up growth in adult (CUGA) model was developed by way of re-feeding after caloric restriction. The controls were fed with normal chow or high-fat diet ad libitum. The CUGA rats were fed as much as 60% of their weight-matched controls during caloric restriction and increased to 100% of their controls (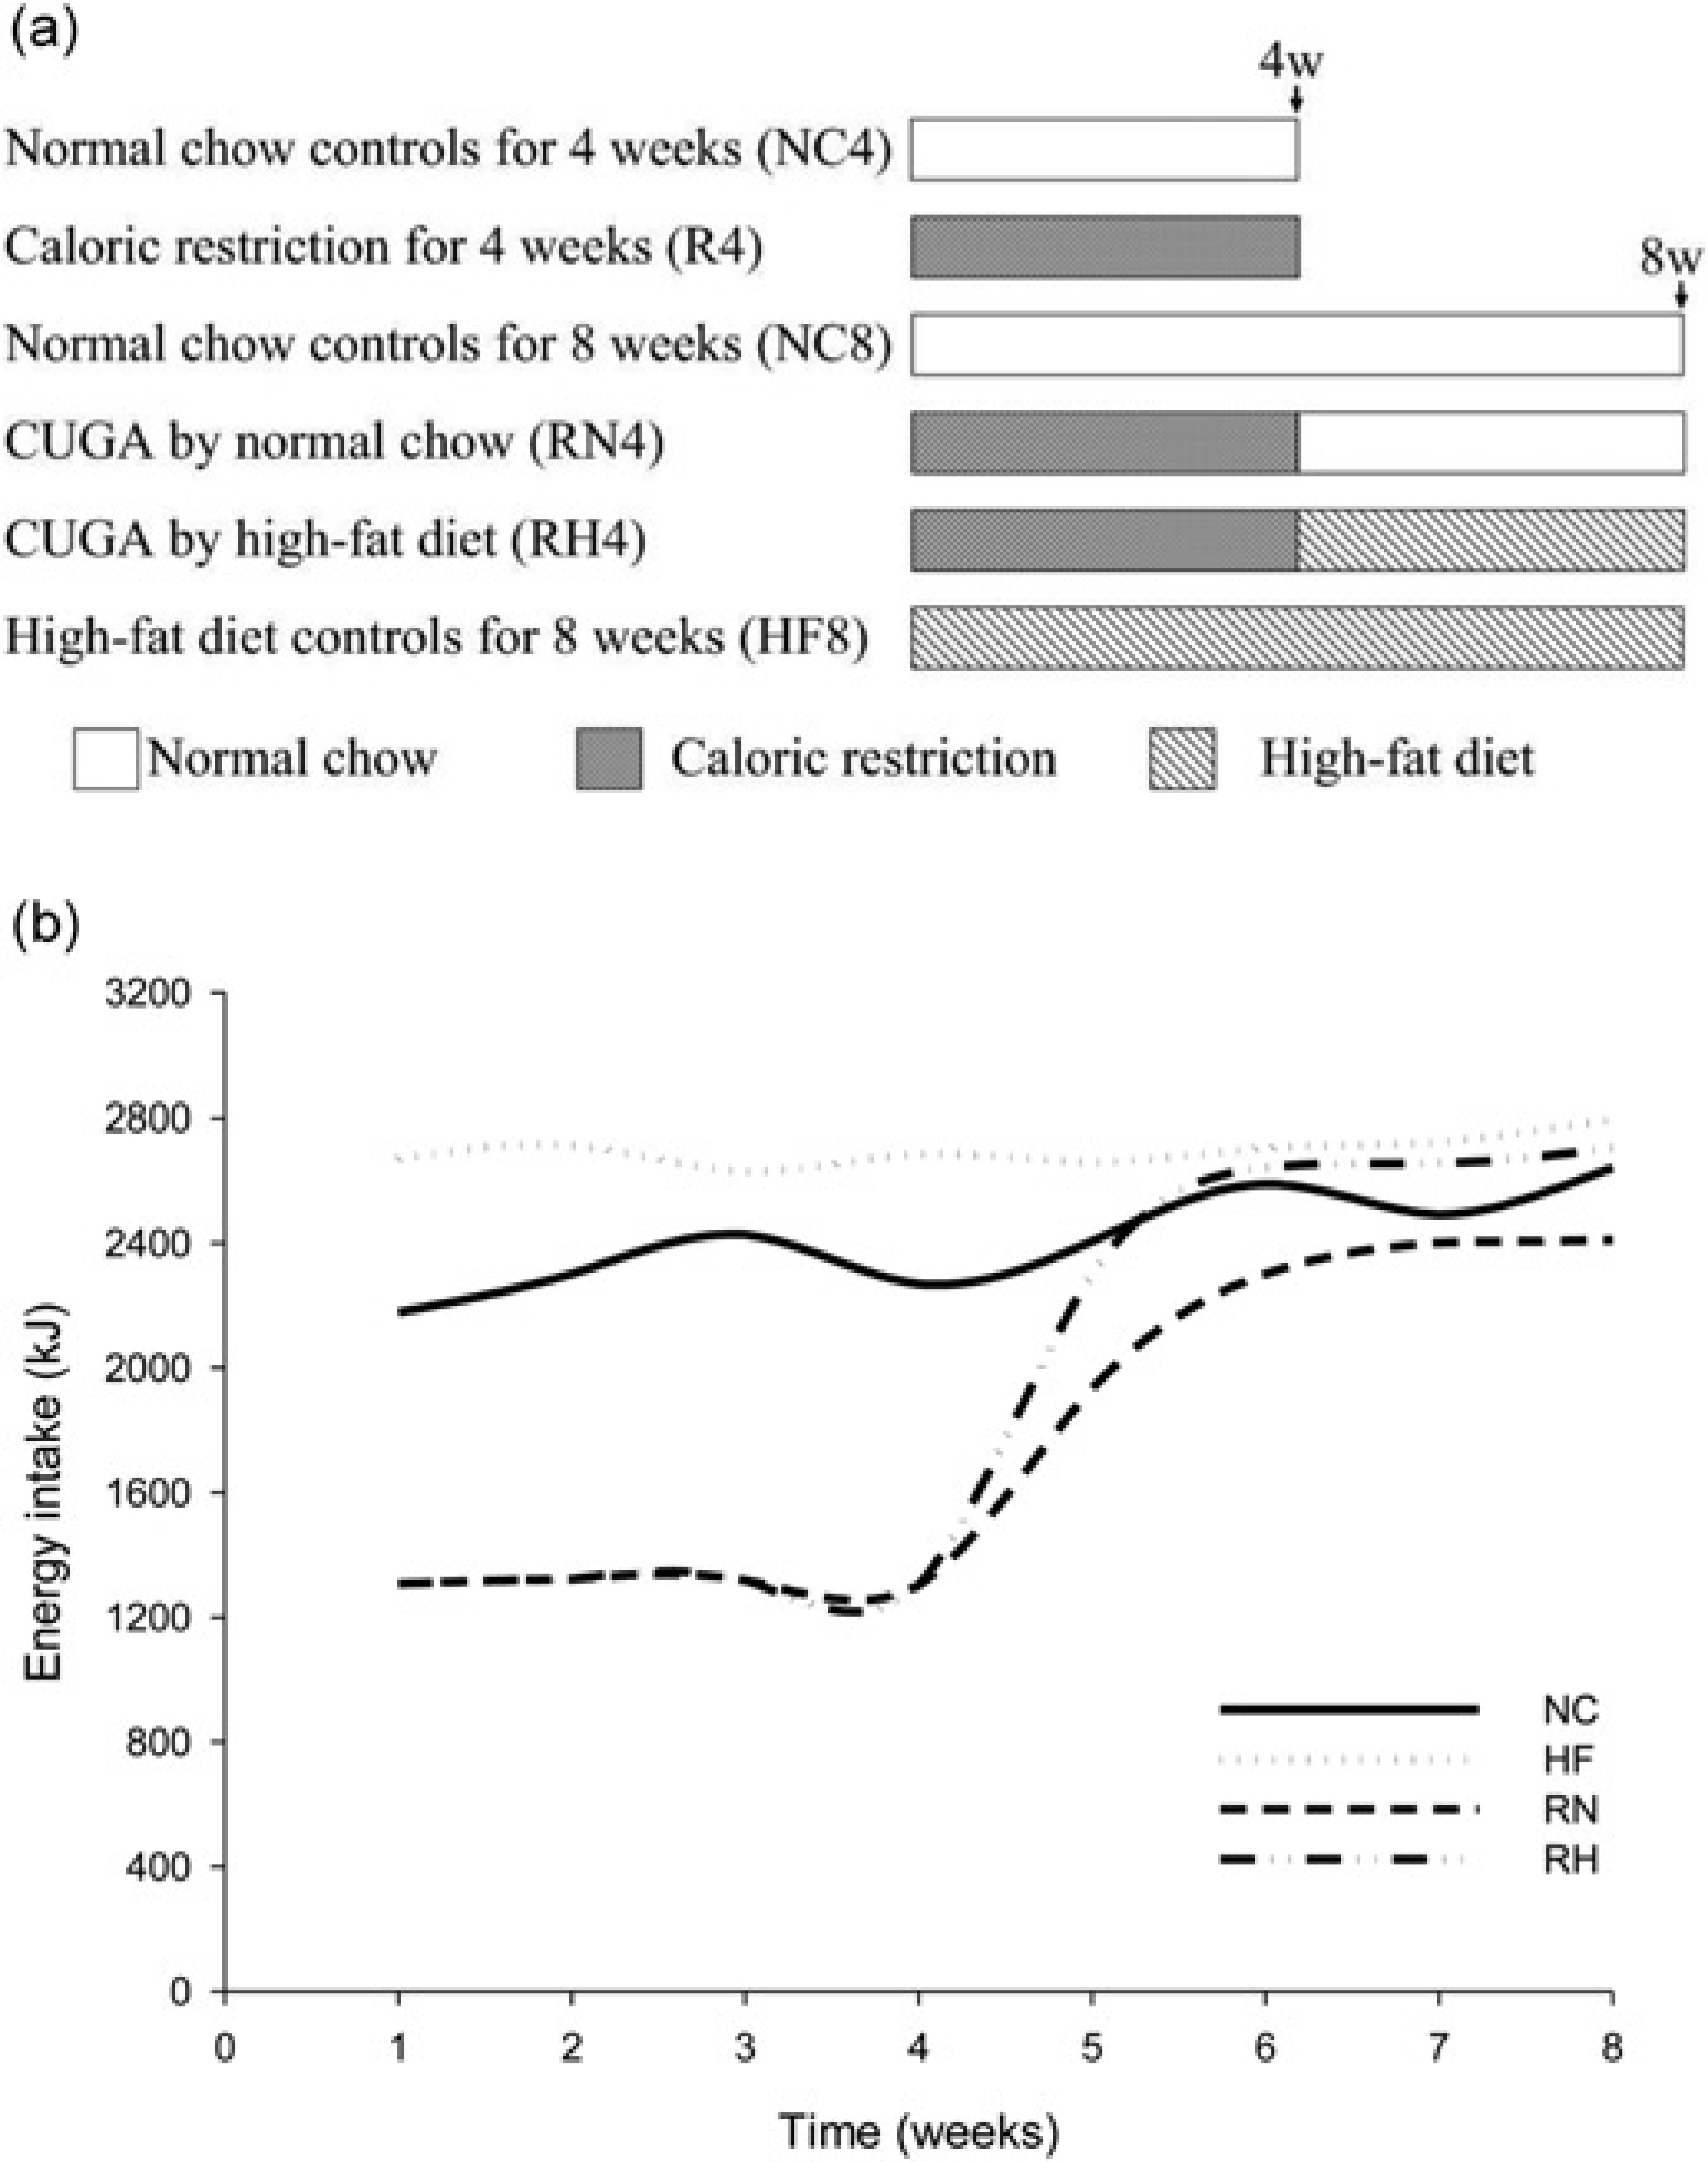
Energy intake
Food intake of animals was determined on alternate days in the evening as planned originally. The energy intake was calculated by the following equation:

where γ is energy intake(kJ/day), X is food intake (g/day) and a is energy density (kcal/g). 6 The energy intake corresponds to the mean value for two days.
Body weight, Lee index and body fat percentage
All the rats were weighed before the start of the hyperinsu-linemic–euglycemic clamp. The nasoanal lengths were measured prior to their sacrifice. Lee index was calculated from the formula:6,20

Subcutaneous (groin), perirenal and epididymal white adipose tissues were carefully dissected out and weighed. Body fat percentage of various AT compartments was determined by dividing the weight of the calculated fat per animal by the carcass weight. The sum of perirenal and epi-didymal fat was considered as visceral AT. 6
Animal preparation and hyperinsulinemic-euglycemic clamp in conscious rats based on tail artery and vein catheterization technique
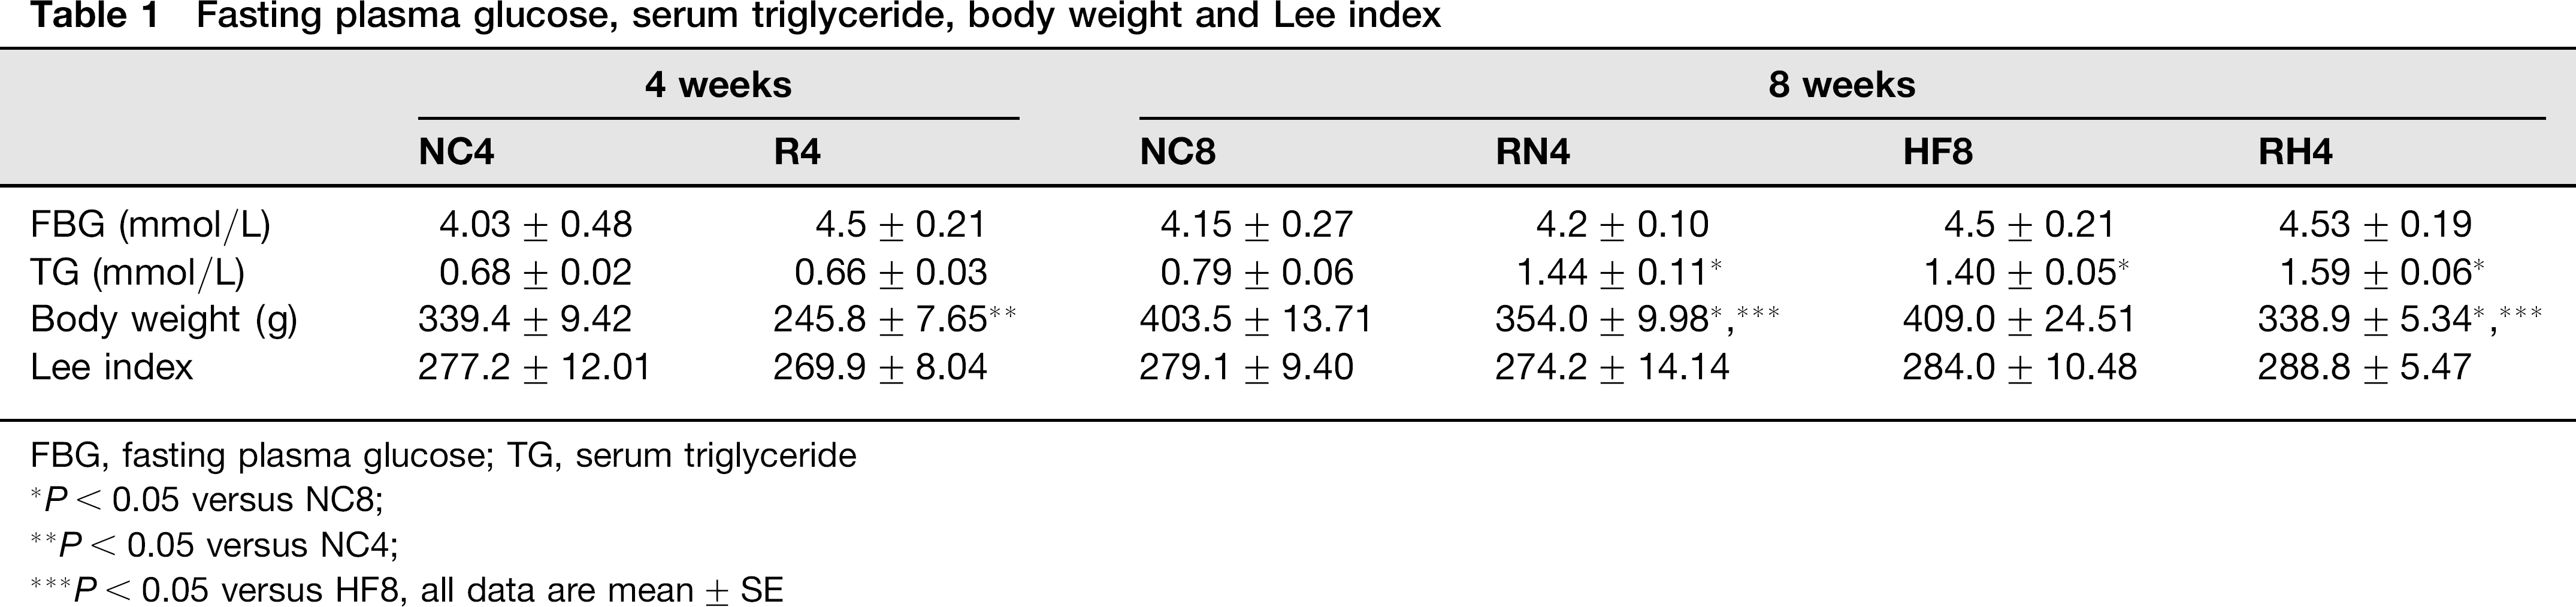
After a 10-12 h overnight fast, a 120-minute hyperinsulinemic-euglycemic clamp was performed in conscious rats according to a modified procedure described previously.21,22 In brief, tail artery and vein catheterizations were conducted with intravenous integrated catheters (24G × 19 mm, Weihai Jierui Medical Products Co. Ltd, Weihai, China) filled with heparin-saline solution (50IU heparin/mL 0.9% saline) under local anesthesia with 5% lidocaine around the tail root of rats. The venous catheter was used for intravenous infusion of insulin and glucose, and the arterial catheter for blood sampling. Fasting plasma glucose was assayed using a glucose oxidase kit (Beijing Chemical Industry, Beijing, China). 23 Plasma insulin level was estimated using a rat insulin enzyme-linked immunosorbent assay ELISA kit (Linco Research, St Charles, MO, USA). Serum triglyceride (TG) and total cholesterol (TC) were determined as described previously. 24 A prime-continuous infusion of human insulin (Novolin R, Novo Nordisk, Tianjin, China) was maintained at a rate of 0.25 U/kg/h to raise plasma insulin for 120 min, and 25% glucose solution was infused at variable rates and periodically adjusted to clamp the plasma glucose levels at approximately 4.5 mmol/L. Blood samples (20 μL) were collected every five minutes for plasma glucose determination using a glucometer (One Touch® Ultra, Lifescan, Milpitas, CA, USA). The average glucose infusion rate between the 60th and 120th min (GIR60–120) was used to evaluate insulin sensitivity. Additionally, IR was assessed with the homeostatic model assessment (HOMA-IR) index, calculated using the following formula: HOMA-IR = ab/22.5, where a is glucose (mmol/L) and b is insulin (mU/L).25,26 To estimate insulin-mediated glucose transport activity in individual tissues, 2-deoxy-D-glucose (2-DG; sigma-Aldrich, St Louis, MO, USA) was administered through the venous cannula as a bolus (2 mmol/kg in saline) 45 min before the end of the clamps. 27
Measurement of in vivo 2-deoxyglucose uptake in SkM during hyperinsulinemic-euglycemic clamp
At the end of hyperinsulinemic–euglycemic clamp, the rats were sacrificed with a lethal dose (150 mg/kg) of intraperi-toneally injected pentobarbitone sodium. Anterior tibial muscle was carefully dissected, removed and frozen quickly in liquid nitrogen after exsanguination. The rate of 2-deoxyglucose uptake by selected SkM samples was determined using a non-radioisotope enzymatic assay described by Yamamoto et al. 27 Briefly, two different reaction mixtures were prepared in the following manner. Assay cocktail A contained all reagents 50 mmol/L triethanolamine hydro-chloride (pH 8.1), 50 mmol/L KCl, 0.02% bovine serum albumin, 0.1 mmol/L nicotinamide adenine dinucleotide phosphate (NADP+), 2–10 μmol/L resazurin sodium salt, 20 units/mL Leuconostoc mesenteroides glucose-6-phosphate dehydrogenase (G6PDH) and 0.2 units/mL diaphorase. Cocktail B was similar in composition but contained 0.1 units/mL of Candida utilis (tolura yeast) G6PDH, instead of L. mesentriodes G6PDH (all reagents were purchased from Sigma-Aldrich). Usually G6PDH from C. utilis reacts only to G6P (glucose-6-phosphate) while G6PDH from L. mesentoriodes reacts with both G6P and DG6P (2-deoxy-D-glucose-6-phosphate). Then frozen muscle (50–100 mg) was homogenized on ice in a nine-fold volume of ice-cold deionized water. An aliquot (100 μL) of the homogenate was transferred to a 1.5-mL Eppendorf tube and 200 μL of 0.1 mol/L NaOH was added, followed by heat treatment at 85°C for 45 min to destroy endogenous NAD(P)H, NAD(P) and enzymes. After the tubes were cooled, 200 μL of 0.1 mol/L HCl was added to neutralize the alkali, and the sample was centrifuged at 10,000g for five minutes. The supernatant (160 μyL) was transferred and incubated with 800 μL assay cocktail A or B, and compared against mixtures of standard solutions of glucose and 2-DG (160 μL) and assay cocktails A or B (800 μL). The reaction time was set to 60 min for cocktail A and 30 min for cocktail B as described by Yamamoto et al. 27 (G6P + DG6P) was measured using assay cocktail A and (G6P) was measured using assay cocktail B, followed by detection on a F-4500 fluorescence spectrophotometer (Hitachi Ltd., Tokyo, Japan) at emission 615 nm with excitation at 530 nm. The values for (G6P + DG6P) and (G6P) were then determined from their respective standard curves. (DG6P) value was calculated from the difference between (G6P + DG6P) and (G6P) and the uptake of 2-DG was evaluated.
Plasma corticosterone levels
Blood for plasma corticosterone determination was drawn at 7:00–9:00, through the vena caudalis of the rats three days before the day of the hyperinsulinemia-euglycemia clamp in order to exclude the possible impact on the results of insulin sensitivity assessment in these animals. The corticosterone concentrations were measured by commercially available kits (Assaypro, St Charles, MO, USA).
Reverse transcriptase-polymerase chain reaction
Total RNA was extracted from snap-frozen tissue samples (tibialis anterior as SkM and perirenal fat as AT) with 1 mL of TRIzol reagent (Invitrogen Life Technologies, Carlsbad, CA, USA) according to the manufacturer's protocol, and RNA concentration was analyzed by spectropho-tometry. The cDNA samples were prepared from 3 μg of total RNA sample. The polymerase chain reaction (PCR) amplification cycles were performed using oligonucleotide primers (Sangon, Shanghai, China) as follows: HSD11B1, forward 5'-GCAGAGCGATTTGTTGTT-3’ and reverse 5'-TGTCTATGAAGCCGAGGA-3’ (364-bp product);β-actin, forward 5'-CTATCGGCAATGAGCGGTTC-3’ and reverse 5'-CTTAGGAGTTGGGGGTGGCT-3’ (762-bp product). The cycling protocol consisted of an initial denaturation at 96°C for three minutes, followed by 30 cycles of amplification (at 95°C for 10 s, 55°C for 30 s and 72°C for 1 min) and final extension at 72°C for 16 min. Aliquots of the PCR products were separated by agarose gel electrophoresis and visualized under ultra violet. The signal intensity was determined by computerized densitometry and assessed after normalization using β-actin as an internal reference. 22
Immunoblot analysis
Protein concentrations were measured using the bicin-choninic acid reagent (Pierce, Rockford, IL, USA) and the volume required for 80 μg of protein was determined. Samples were then separated by sodium dodecyl sulfate polyacrylamide gel electrophoresis and subsequently transferred to nitrocellulose. Immunoblotting was done, followed by detection with enhanced chemiluminescence, quantified by densitometry and normalized against actin loading controls.21,22 Rabbit polyclonal antibodies recognizing anti-PKB/Akt and anti-phospho-PKB/Akt (Ser473) antibodies were used for immunoblot assays (Cell Signaling Technology, Beverly, MA, USA).
Statistical analysis
Results are presented as means ± SEM Statistical analyses were calculated to assess the differences among the groups at the same sampling points using two-tailed unpaired Student's t-test (4-week sampling point) or one-way analysis of variance (8-week sampling point) followed by least significant difference -t post hoc test for multiple comparisons with SPSS 11.5 software (SPSS, Chicago, IL, USA). P < 0.05 was considered statistically significant.
Results
Energy intake
The average energy intake of RNs or RHs rats were ∼60% of that eaten by their weight-matched normal chow or high-fat diet controls (a little less than their age-matched controls) after re-feeding (Figure 1b).
Fasting plasma glucose, serum TG, body weight, Lee index and body fat percentage
No significant difference was found (Table 1) in R4, RN4 and RH4 compared with their age-matched controls (P > 0.05). The serum TG was greater (Table 1) in RN4, RH4 and HF8 compared with NC8 (P<0.05). The body weight in R4, RN4 and RH4 (Table 1) decreased significantly compared with their controls (P < 0.05, R4 versus NC4; RN4 versus NC8; RH4 versus HF8 and NC8). However, the Lee index in R4, RN4 and RH4 (Table 1) did not differ (P > 0.05) from their controls. The body fat percentage of subcutaneous AT (SAT/BW) showed no difference in R4 compared with that in NC4, in RN4 (Figure 2a) compared with that in NC8 (P > 0.05); on the contrary, the body fat percentage of visceral AT (VAT/BW) (Figure 2b) was lower in R4 than that in NC4, while it was greater in RN4 than that in NC8 (P < 0.05). The SAT/ BW and VAT/BW increased in RH4 and HF8 (Figures 2a and b) compared with NC4 and RN4 (P < 0.05).
Fasting plasma glucose, serum triglyceride, body weight and Lee index
FBG, fasting plasma glucose; TG, serum triglyceride
P< 0.05 versus NC8;
P < 0.05 versus NC4;
P< 0.05 versus HF8, all data are mean ± SE
Body fat percentage of subcutaneous adipose tissue (
Systemic and peripheral (SkM) insulin sensitivity
The average GIR60–120 at hyperinsulinemic–euglycemic clamp decreased (Figure 3a) (P < 0.05) and the HOMA-IR index increased (Figure 3b) in RN4 compared with NC8 (P < 0.05), in RH4 compared with NC8, RN4 and HF8 (P < 0.05), while no significant difference was found in GIR60-120 or HOMA-IR index between R4 and NC4. We further found that the insulin-mediated Ser473 phosphorylation of PKB (Figures 4a and b) and 2-DG uptake (Figure 4c) in SkM in R4 were similar to those in NC4, but they were significantly lower in RN4 compared with NC8 (P < 0.05), in RH4 compared with NC8, RN4 and HF8 (P < 0.05).
Systemic insulin sensitivity. The average 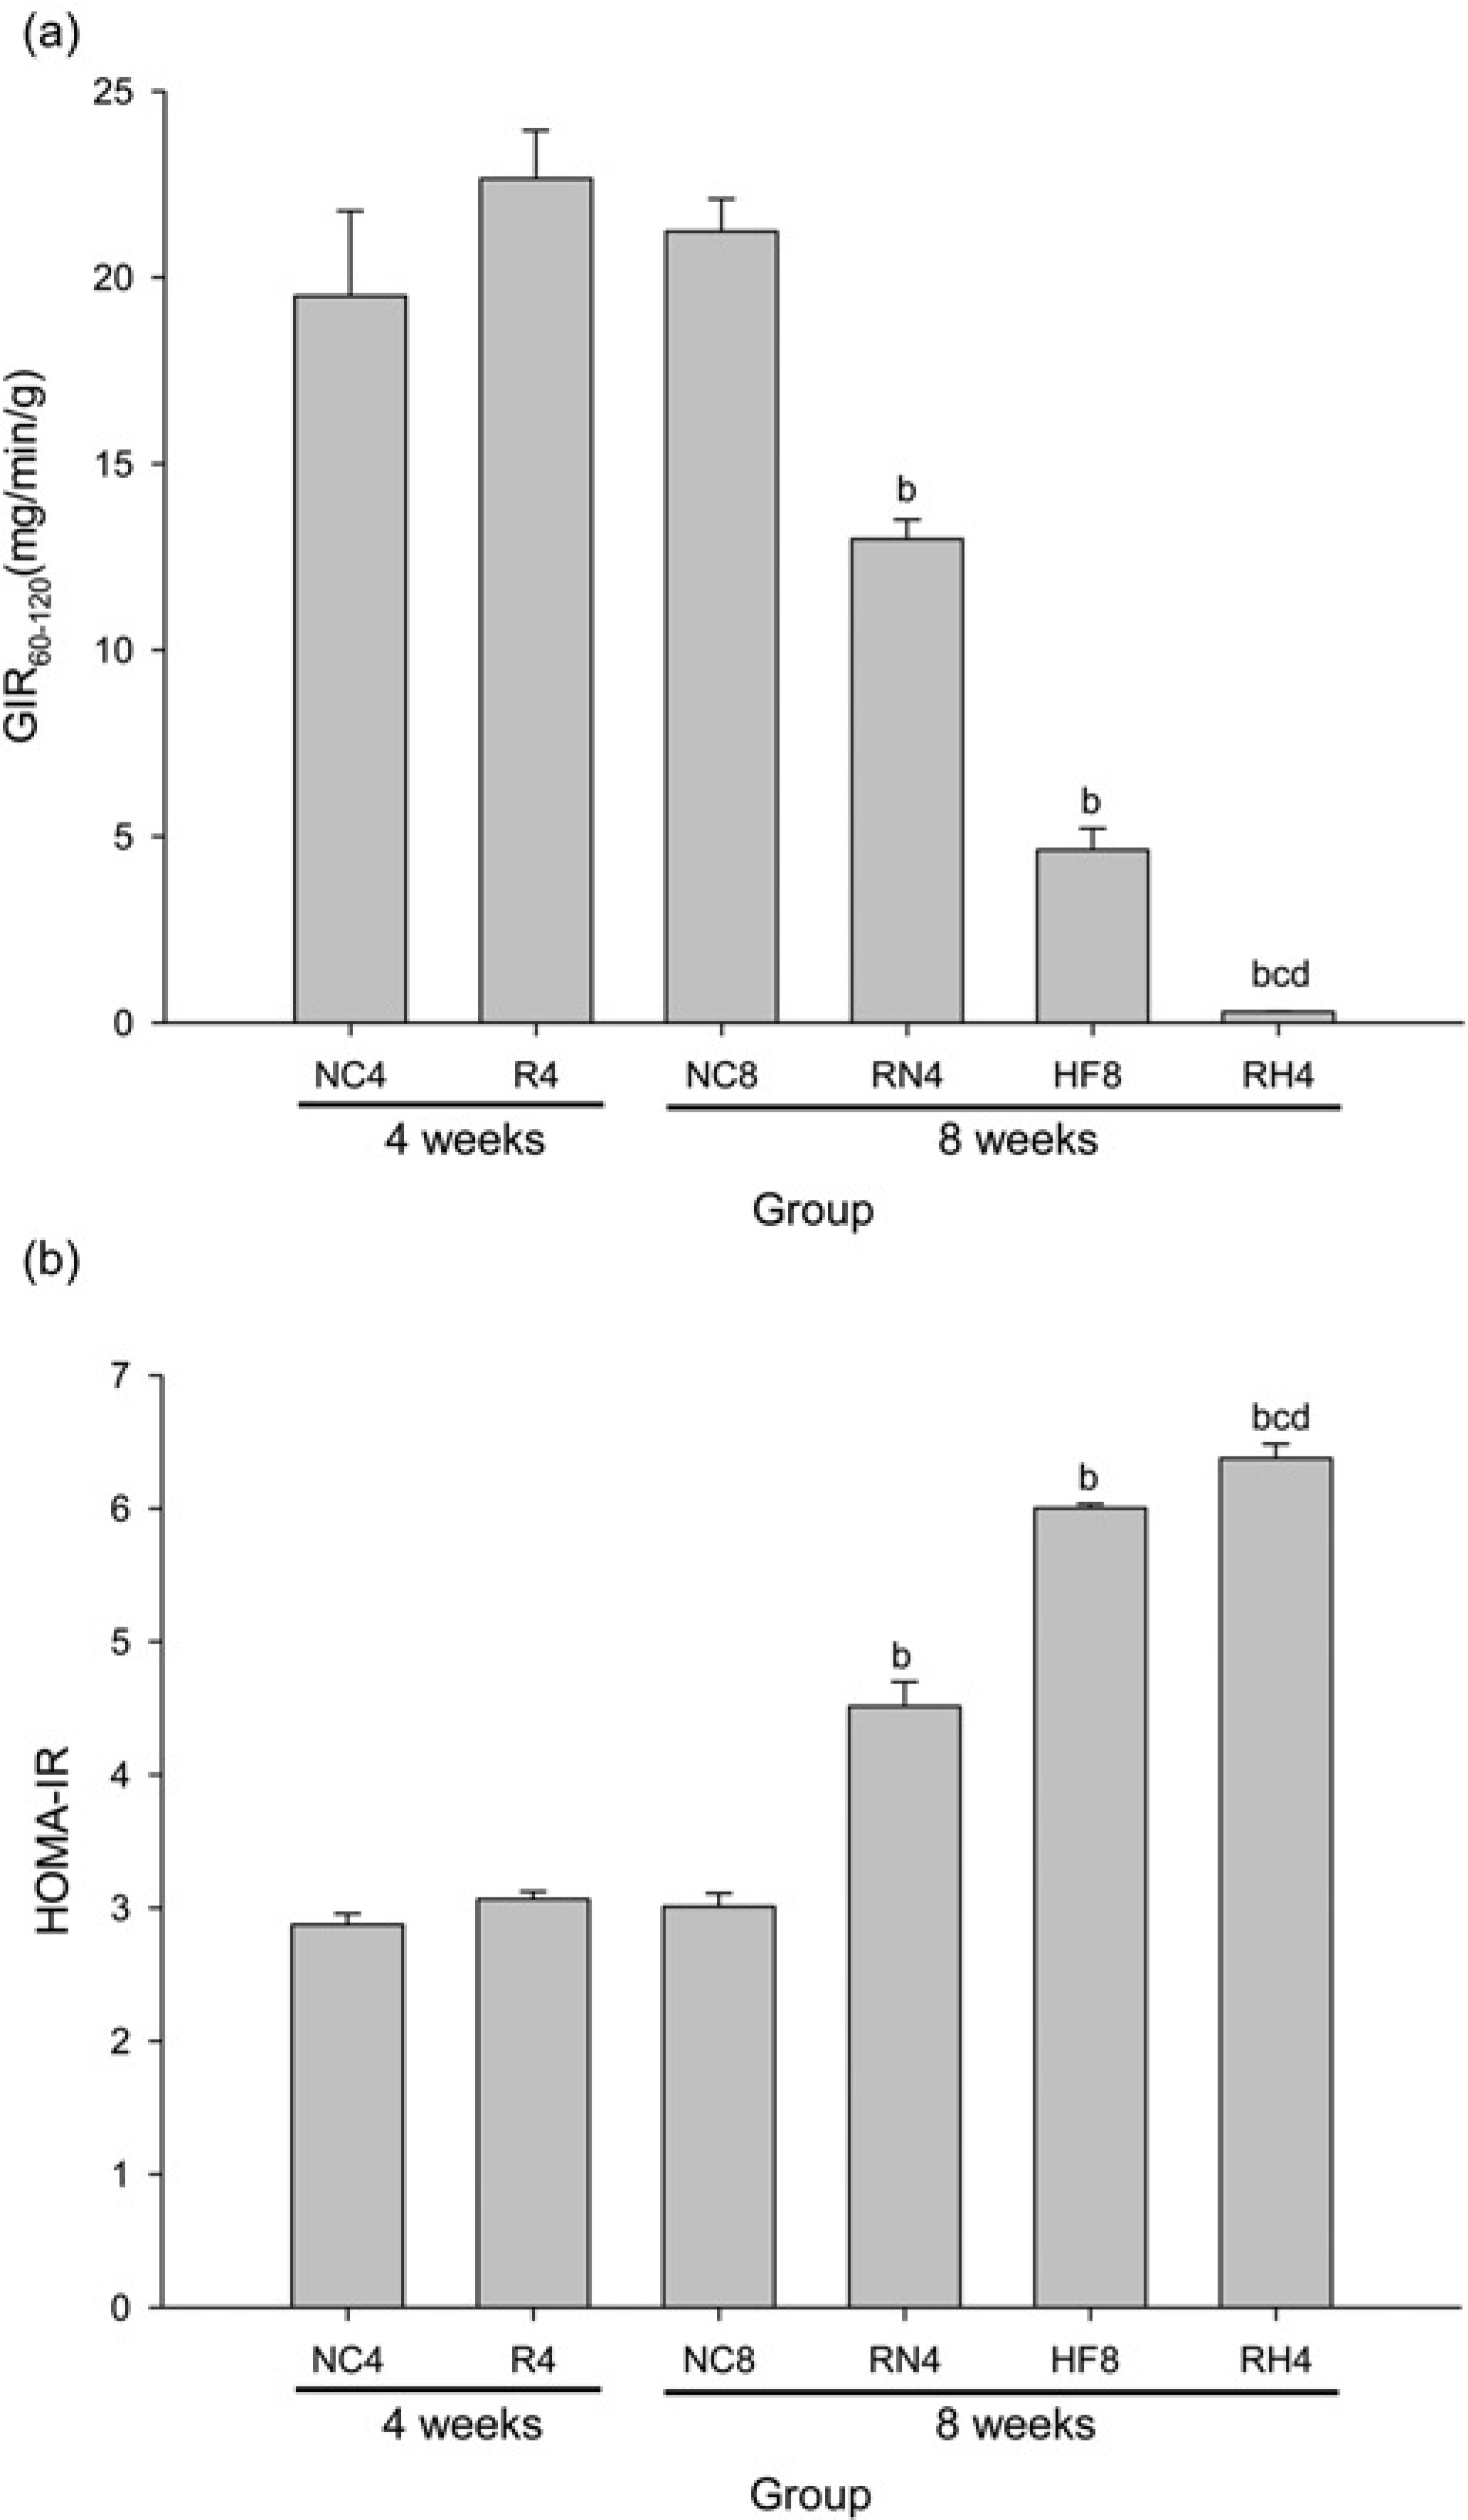
Peripheral insulin sensitivity in skeletal muscle (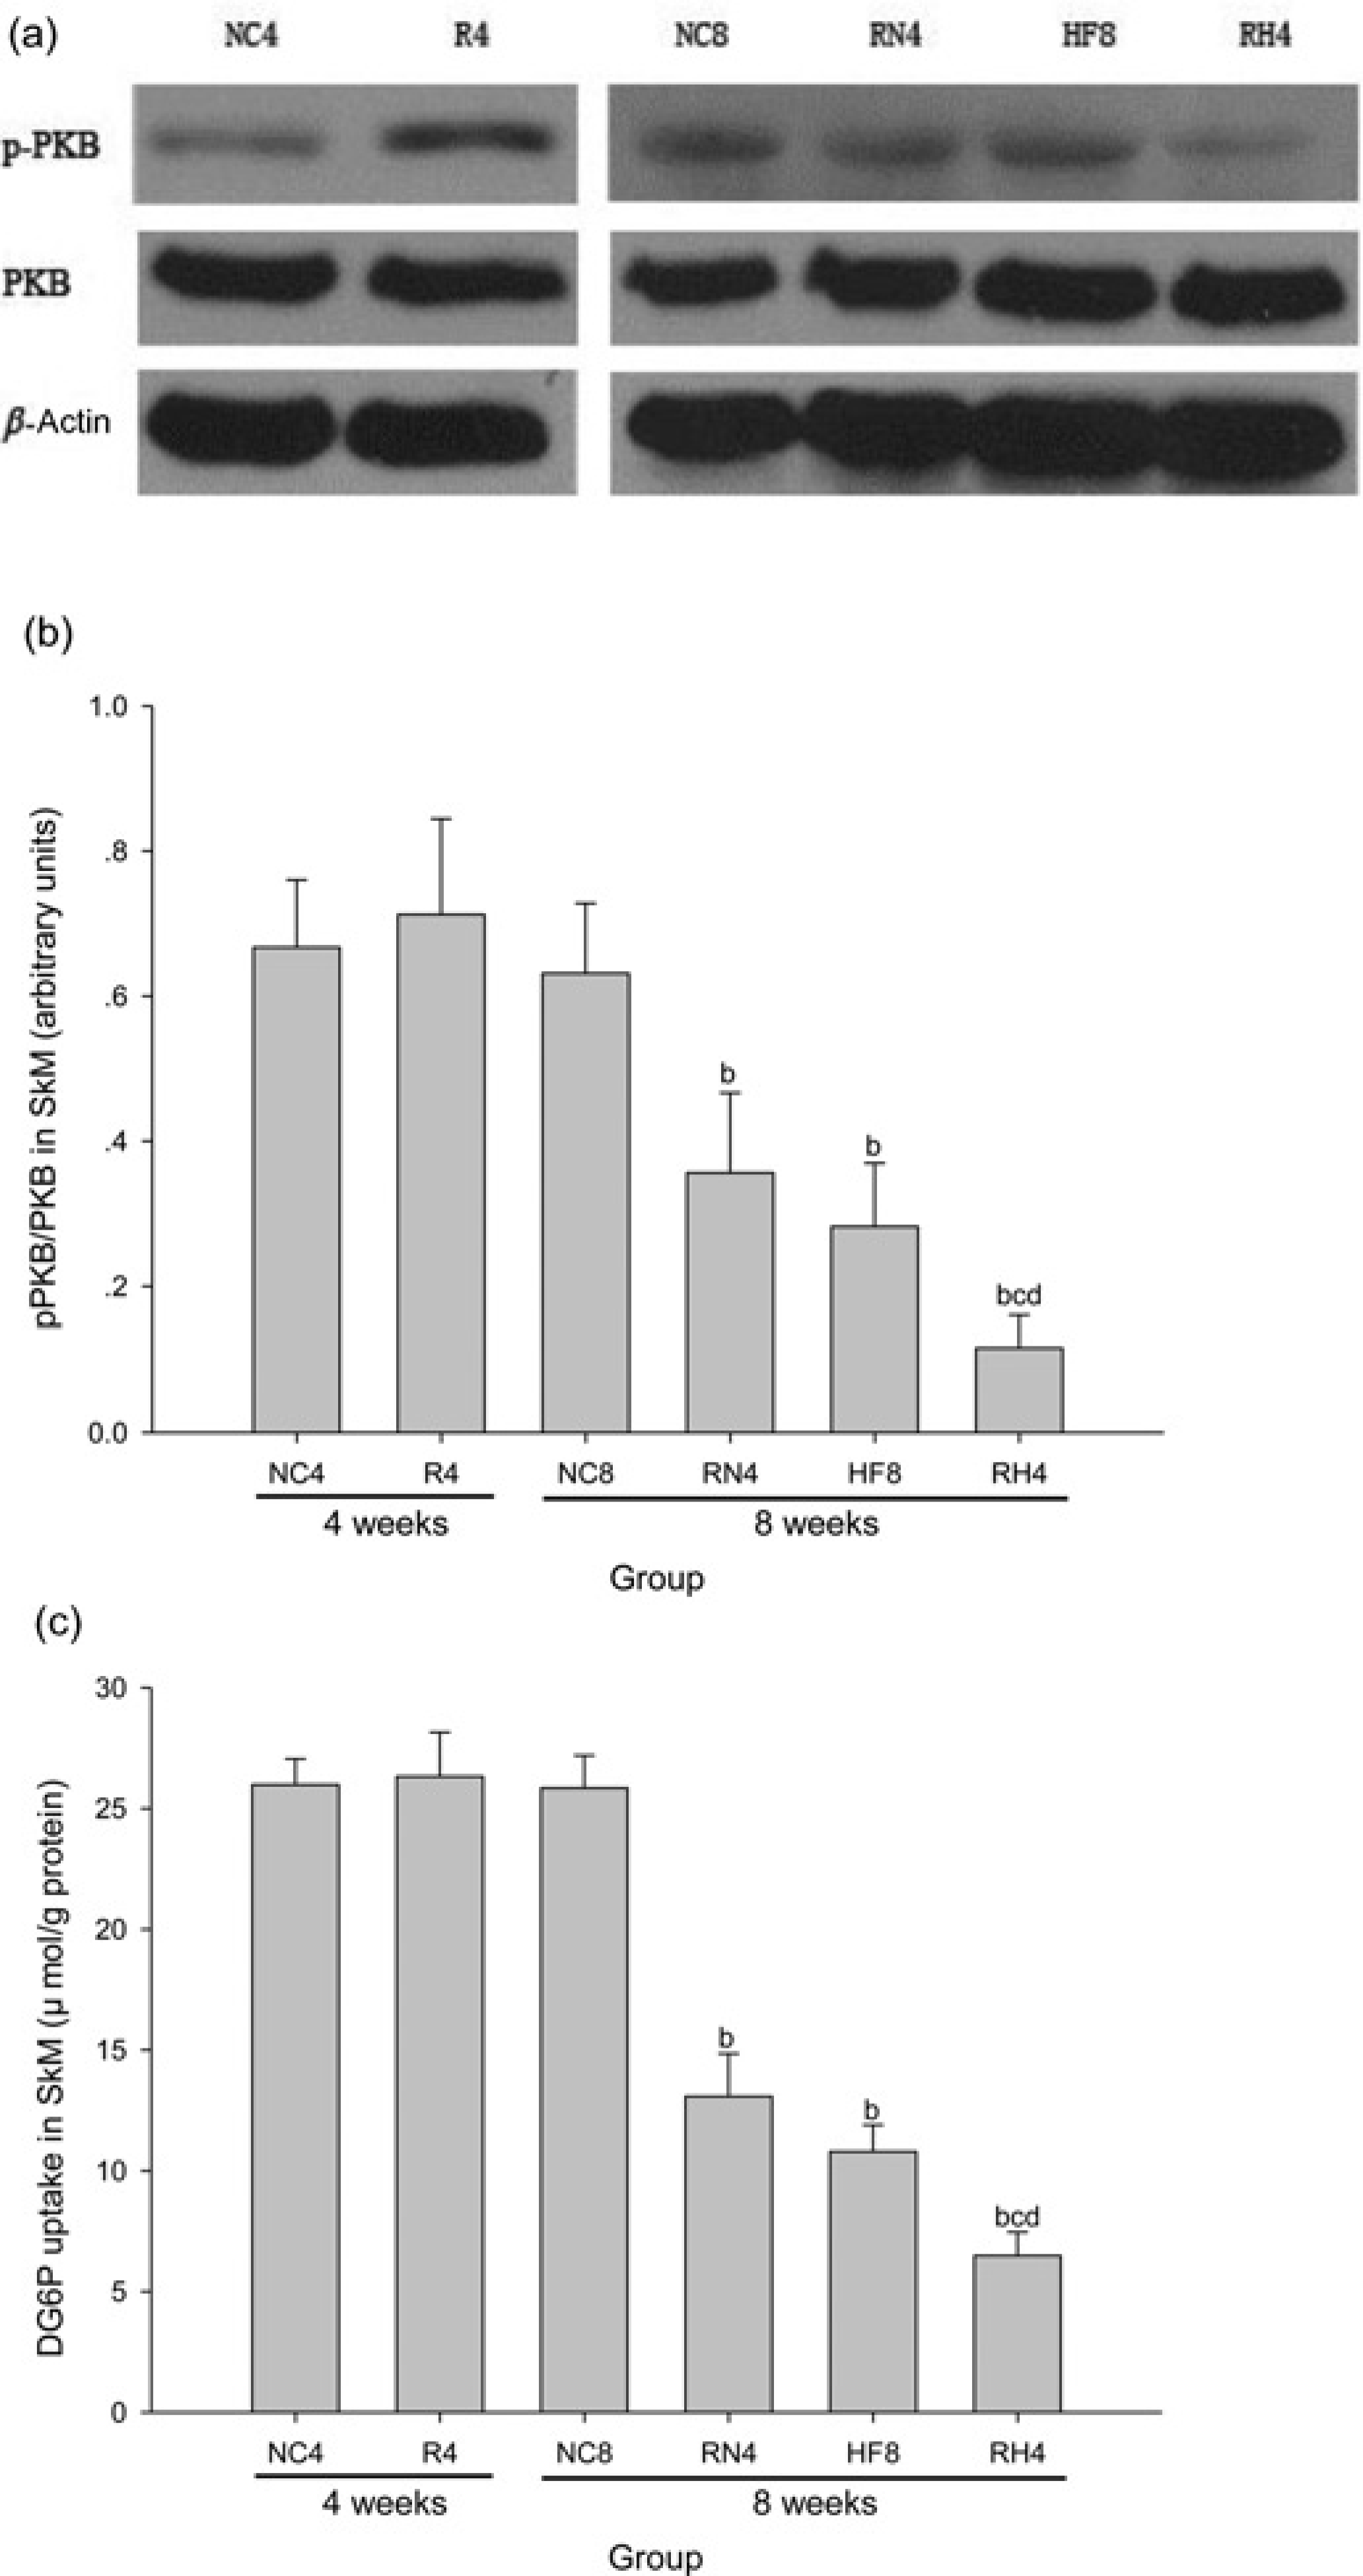
Plasma corticosterone concentration
The plasma corticosterone (Figure 5) was significantly higher in R4 than that in NC4 (P < 0.05). In addition, this increase sustained after re-feeding in RN4 compared with NC8 (P < 0.05), in RH4 compared with NC8, RN4 and HF8 (P < 0.05).
Plasma corticosterone level. The plasma corticosterone increased in 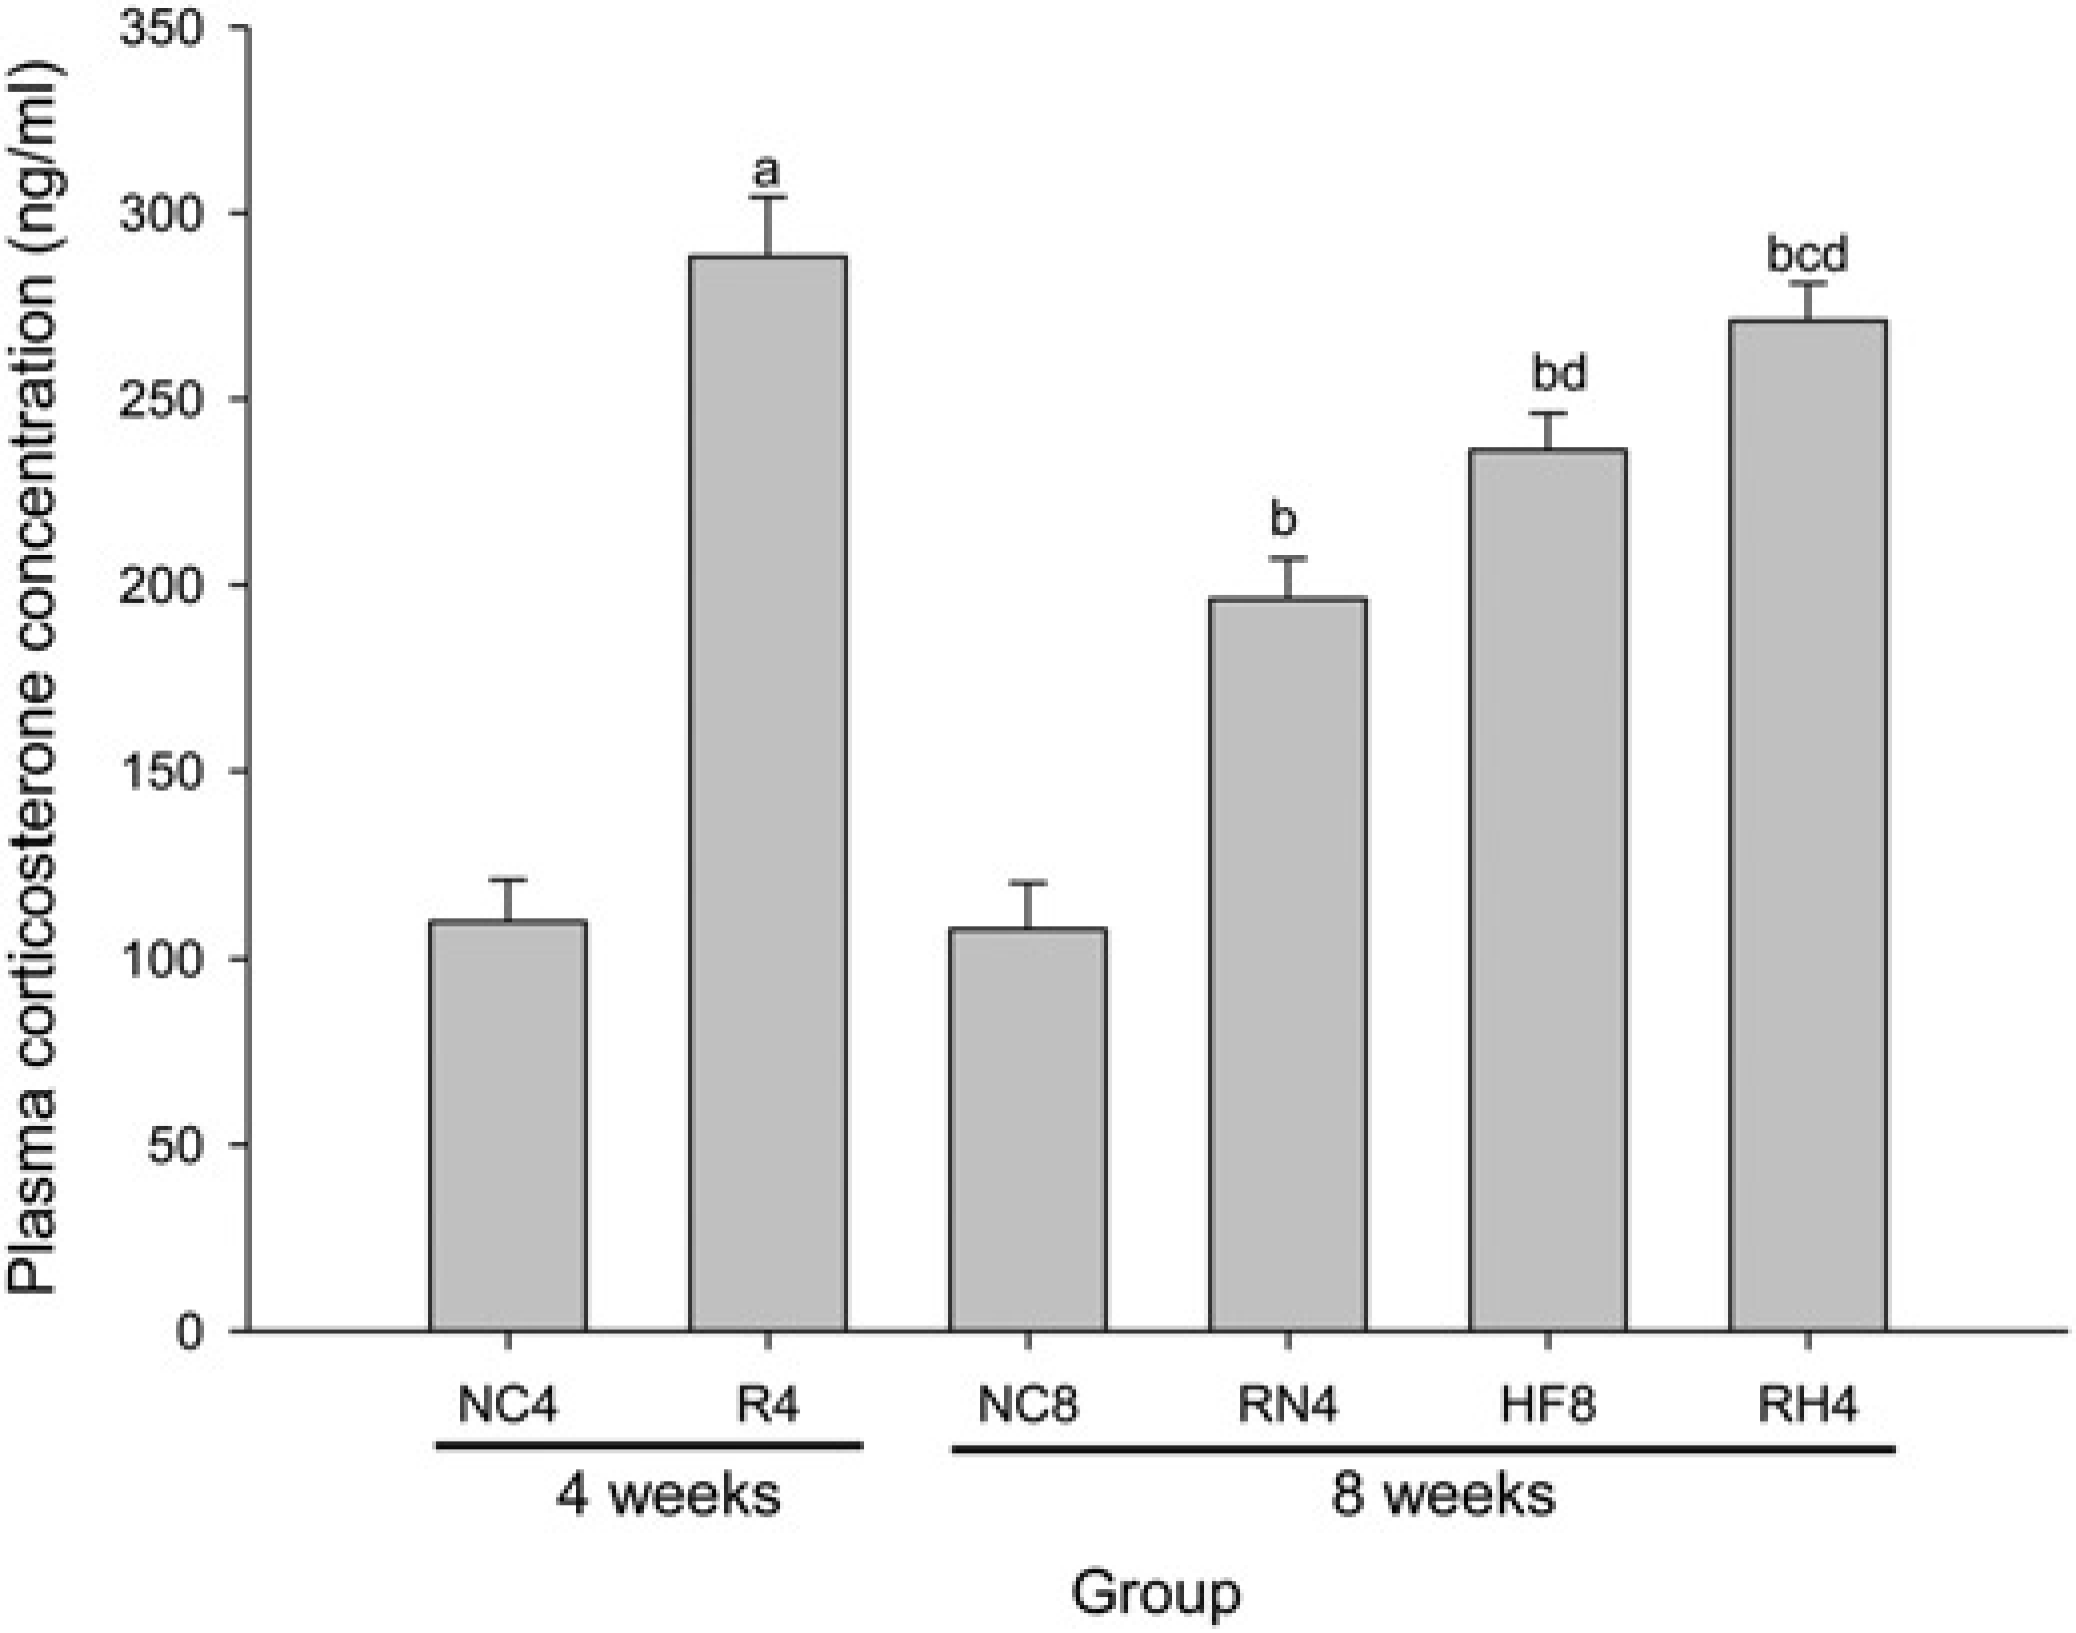
Alteration of HSD11B1 mRNA expression level in SkM and AT
The mRNA expression level of HSD11B1 in SkM (Figures 6a and b) and AT (Figures 6c and 7d) were dramatically up-regulated (P < 0.05) in R4 compared with NC4, and remained higher after re-feeding in RN4 compared with NC8 (P < 0.05), in RH4 compared with NC8, RN4 and HF8 (P < 0.05).
Alteration of 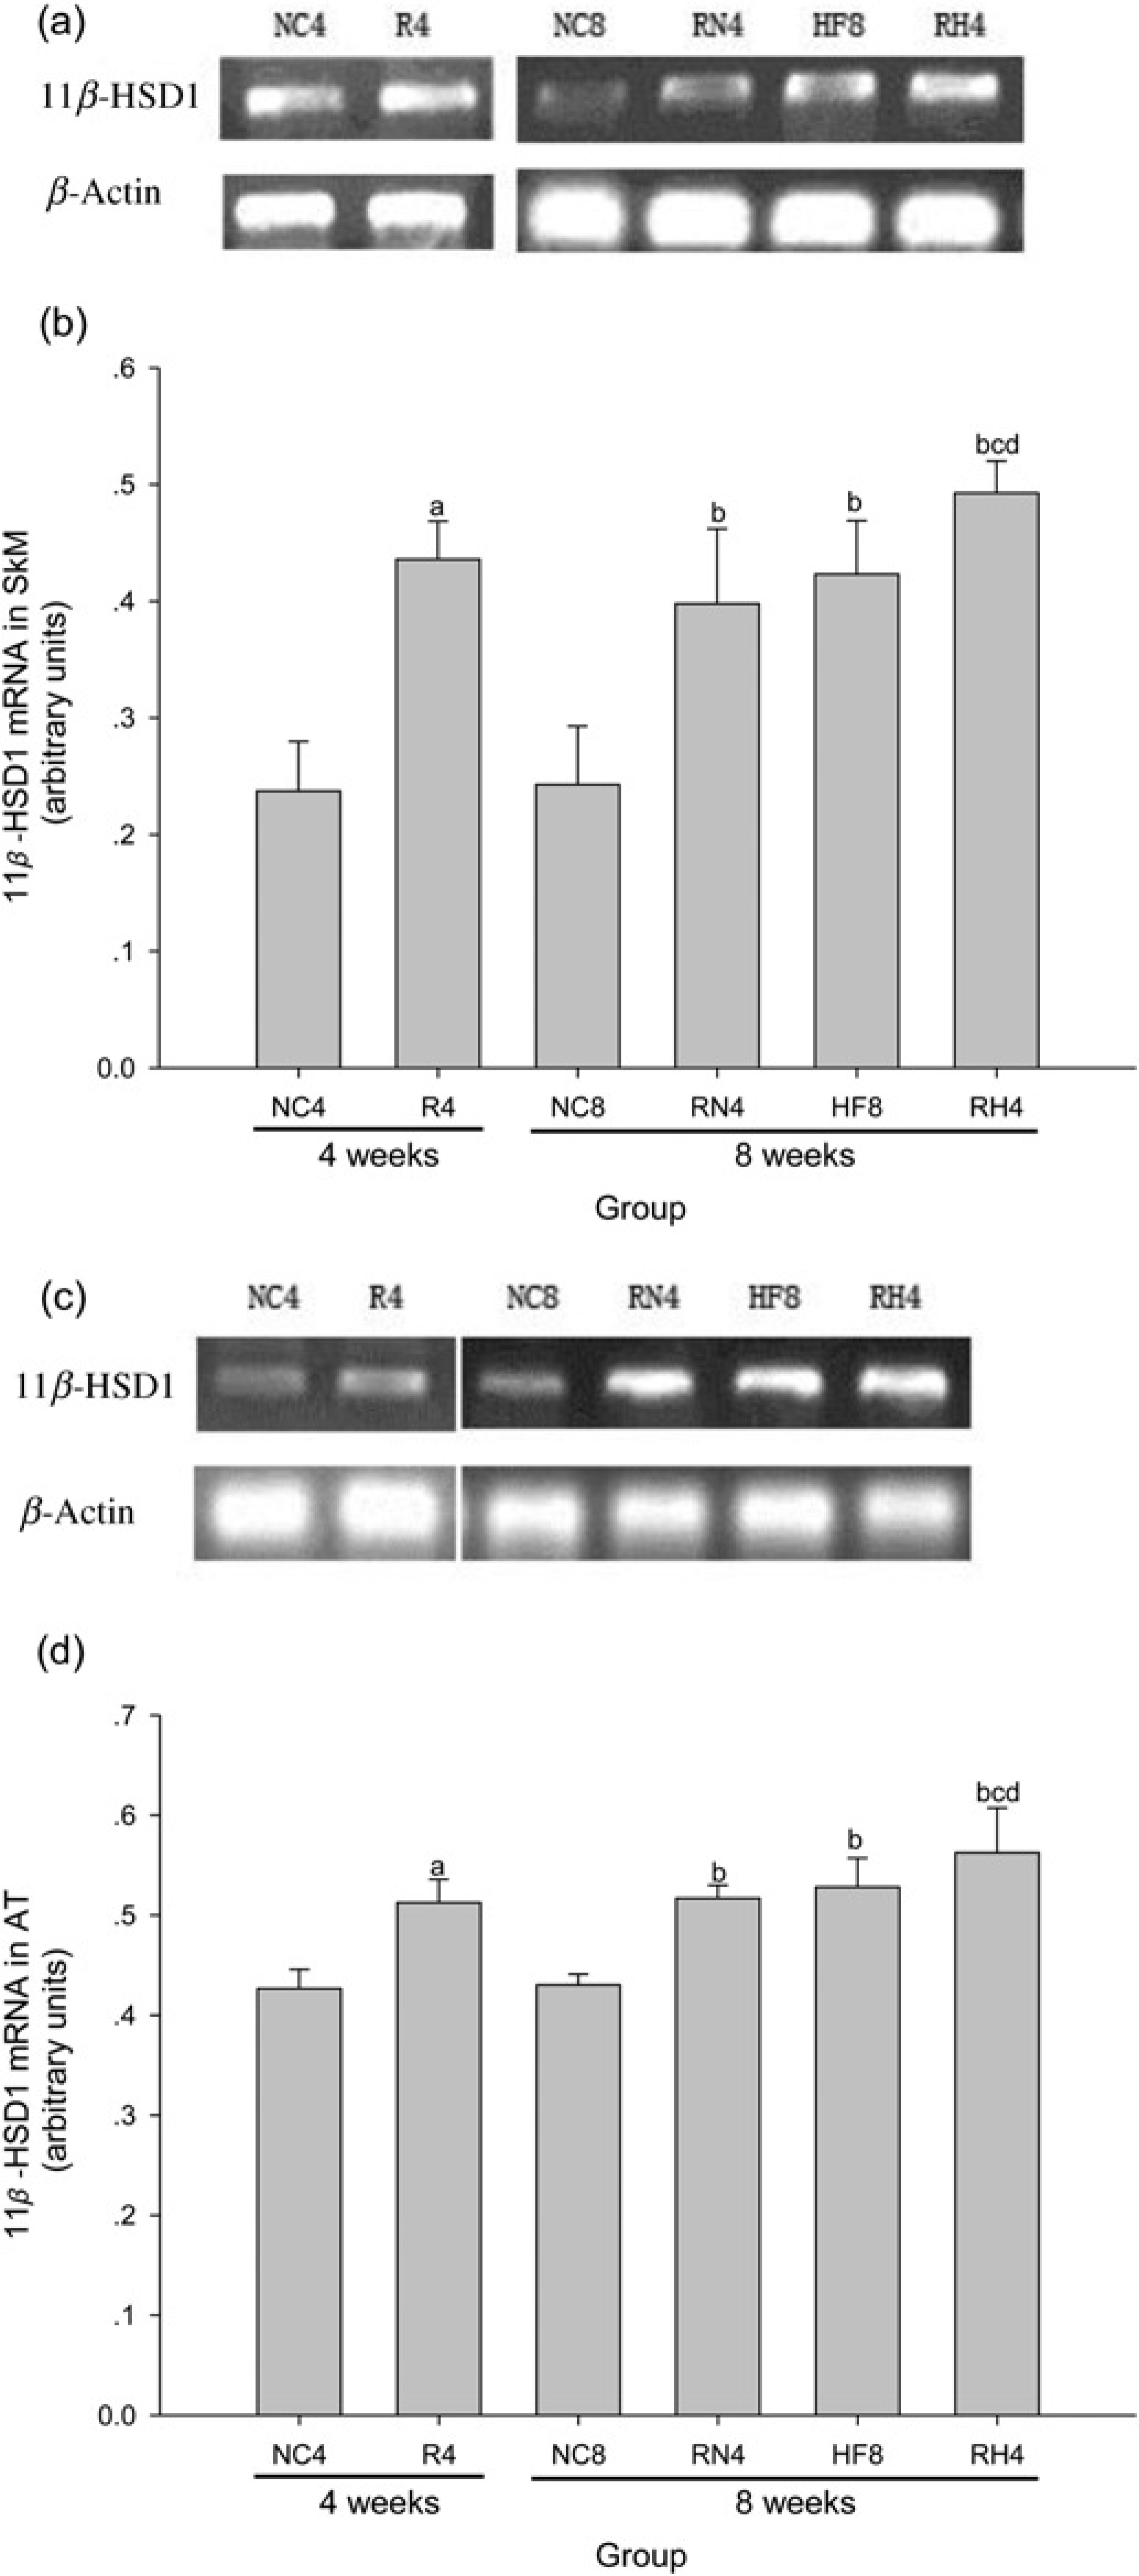
Discussion
In this study, we showed that the plasma corticosterone, as well as HSD11B1 expression level in SkM and AT increased at the end of caloric restriction stage, while the visceral fat decreased and IR never occured in these animals. After re-feeding with either normal chow or high-fat diet, the plasma corticosterone, and HSD11B1 expression level in SkM and AT sustained in a high level, which was associated with visceral fat accumulation, and drastic IR in whole body and SkM. Additionally, these changes were greater in CUGA re-fed with high-fat diet than that with normal chow.
We observed that plasma corticosterone level increased both at the end of four weeks caloric restriction and after re-feeding. Belda et al. 28 reported that caloric restriction can cause increases in corticosterone level in rats, which is consistent with our findings. However, it is reported that corticosterone level seem to elevate in rats re-feeding for two weeks after four weeks of caloric restriction, but the difference was not significant. 10 The length of time for caloric restriction and re-feeding might be explanations for this discrepancy between their observations and our results. 29 Glucocorticoids regulate HSD11B1 activity and gene expression in peripheral tissues in rats, 30 and in turn, the stimulation of HSD11B1 activity, can increase the supply of glucocorticoids. 31 Thus, we tentatively put forward that the increases in HSD11B1 expression in AT and SkM might be closely related to the elevation of plasma corticosterone level in CUGA rats. As such, they promote each other and result in significant increases in both of them.
As the key enzyme catalyzing the in vivo conversion of inactive to active glucocorticoids in pivotal metabolic tissues including SkM and AT, HSD11B1 is strongly implicated in the pathogenesis of obesity, type 2 diabetes and metabolic syndrome. 32 The results of our research showed that the drastic IR and visceral fat accumulation in CUGA were associated with increases in HSD11B1 expression level in SkM and AT. Hence, we can reasonably presume that the increased HSD11B1 expression in AT and SkM might play a causative role in the pathogenesis IR and lipid deposition in CUGA rats. Moreover, it is demonstrated that enhanced HSD11B1 in visceral AT may increase local glucocorticoid receptor activation and promote visceral obesity, 33 while a relatively higher HSD11B1 activity in visceral AT versus subcutaneous AT is associated with preferential visceral fat accumulation and concomitant metabolic alterations. 34 Therefore, these findings of visceral fat accumulation and IR in CUGA rats to some extent might be attributed to the increase of HSD11B1 in visceral AT rather than subcutaneous AT. This is an important reason for that we just show the results of HSD11B1 expression in visceral AT (perirenal fat) but not in subcutaneous AT.
Peripheral IR in SkM plays an important role in the development of systemic IR and is characterized by inhibition of insulin-mediated Ser473 phosphorylation of PKB and its subsequent reduced glucose uptake. 35 Our data have shown that GIR60–120, as well as glucose uptake and insulin-mediated Ser473 phosphorylation of PKB in SkM all decreased significantly in CUGA rats, confirming the presence of systemic and peripheral IR. Thus, downregulation of insulin-mediated Ser473 phosphorylation of PKB in SkM might be one of the main causes of IR in CUGA rats. It is reported that glucocorticoids can result in impairment of insulin-mediated Ser473 phosphorylation of PKB and glucose uptake, and HSD11B1 inhibition can attenuate IR of organisms by improving insulin signaling involving insulin-mediated Ser473 phosphorylation of PKB and glucose uptake.36 These results obtain from our research strongly suggest that the peripheral and systemic IR in CUGA rats might result from increases in plasma glucocorticoid and HSD11B1 expression level in SkM. Additionally, it is reported that IR in SkM can lead to re-distribution of glucose from SkM to AT and consequent visceral fat accumulation during CUGA. 37 The visceral fat accumulation induced by glucose re-distribution, along with that promoted by elevated HSD11B1 expression mentioned above, 33 might play important roles in the pathogenesis of peripheral and systemic IR. 38 Thus we postulate this interaction of systemic and local stress (increases in plasma corti-costerone level and HSD11B1 expression in SkM and AT) inducing visceral fat accumulation and IR, may represent a vicious circle in the subsequent causation of drastic visceral fat accumulation and IR in CUGA.33,36
Noteworthy, visceral fat accumulation and IR appeared after re-feeding, but not at the end of caloric restriction stage, though systemic and local stress increased in both of them. These results strongly suggest sufficient nutrient supply might be indispensable in the pathogenesis of IR. It is reported that the high prevalence of obesity and metabolic syndrome cannot be simply attribute to nutrient excess, but to chronic stress amplifying and accelerating diet-induced obesity and metabolic syndrome. 39 Therefore, from the findings of our experiment we tentatively postulate that the interaction of increased stress and sufficient nutrient supply might be key causal factors in the etiology of visceral fat accumulation in CUGA. However, the detailed mechanism is unclear and further research is necessary. Furthermore, we demonstrated that the visceral fat accumulation and IR was more severe in CUGA rats re-fed with high-fat diet than that in CUGA rats re-fed with normal chow. It is reported that high-fat diet can elevate basal corticosterone levels and enhancing hypothalamo-pituitary-adrenocortical responses to stress in rats. 40 The combination of a high-fat diet and chronic stress may have synergic effects in exacerbating fat accumulation and IR.39,41 Thus, the interaction of high-fat diet and chronic stress might be an explanation for these obeservations in CUGA in our study.
Yet, it should be noted that for practical reasons involving the unavailability of radioisotope agents, we were not able to assay the activity of HSD11B1 in time unfortunately, although its mRNA expression level closely and positively correlates with its activity. 14 We will complete it accurately in our further research in the future. For the same reason, we determined glucose uptake in SkM using a non-radioisotope, enzymatic microplate assay, 27 which is proved to be very reproducible and feasible, instead of utilizing radio-labeled 2-DG. That our data indicating decreases in glucose uptake in high-fat diet rats is similar to these observations employing radioisotope assay system, 18 also support the repeatability and feasibility of this method.
Notwithstanding these limitations, we found that the visceral fat accumulation and IR were associated with increases in systemic and local stress (SkM and AT). Herein, we tentatively put forward the hypothesis that interaction of sustained caloric restriction-induced stress (systemic and local) and nutrient sufficiency after re-feeding is likely to be an important trigger for the visceral fat accumulation and IR in SkM. Then the visceral fat accumulation and IR in SkM exacerbate each other and ultimately cause drastic systemic IR in CUGA rats (summarized in Figure 7).
Catch-up growth in adult (CUGA) induced by re-feeding after caloric restriction is characterized by visceral fat accumulation and drastic insulin resistance (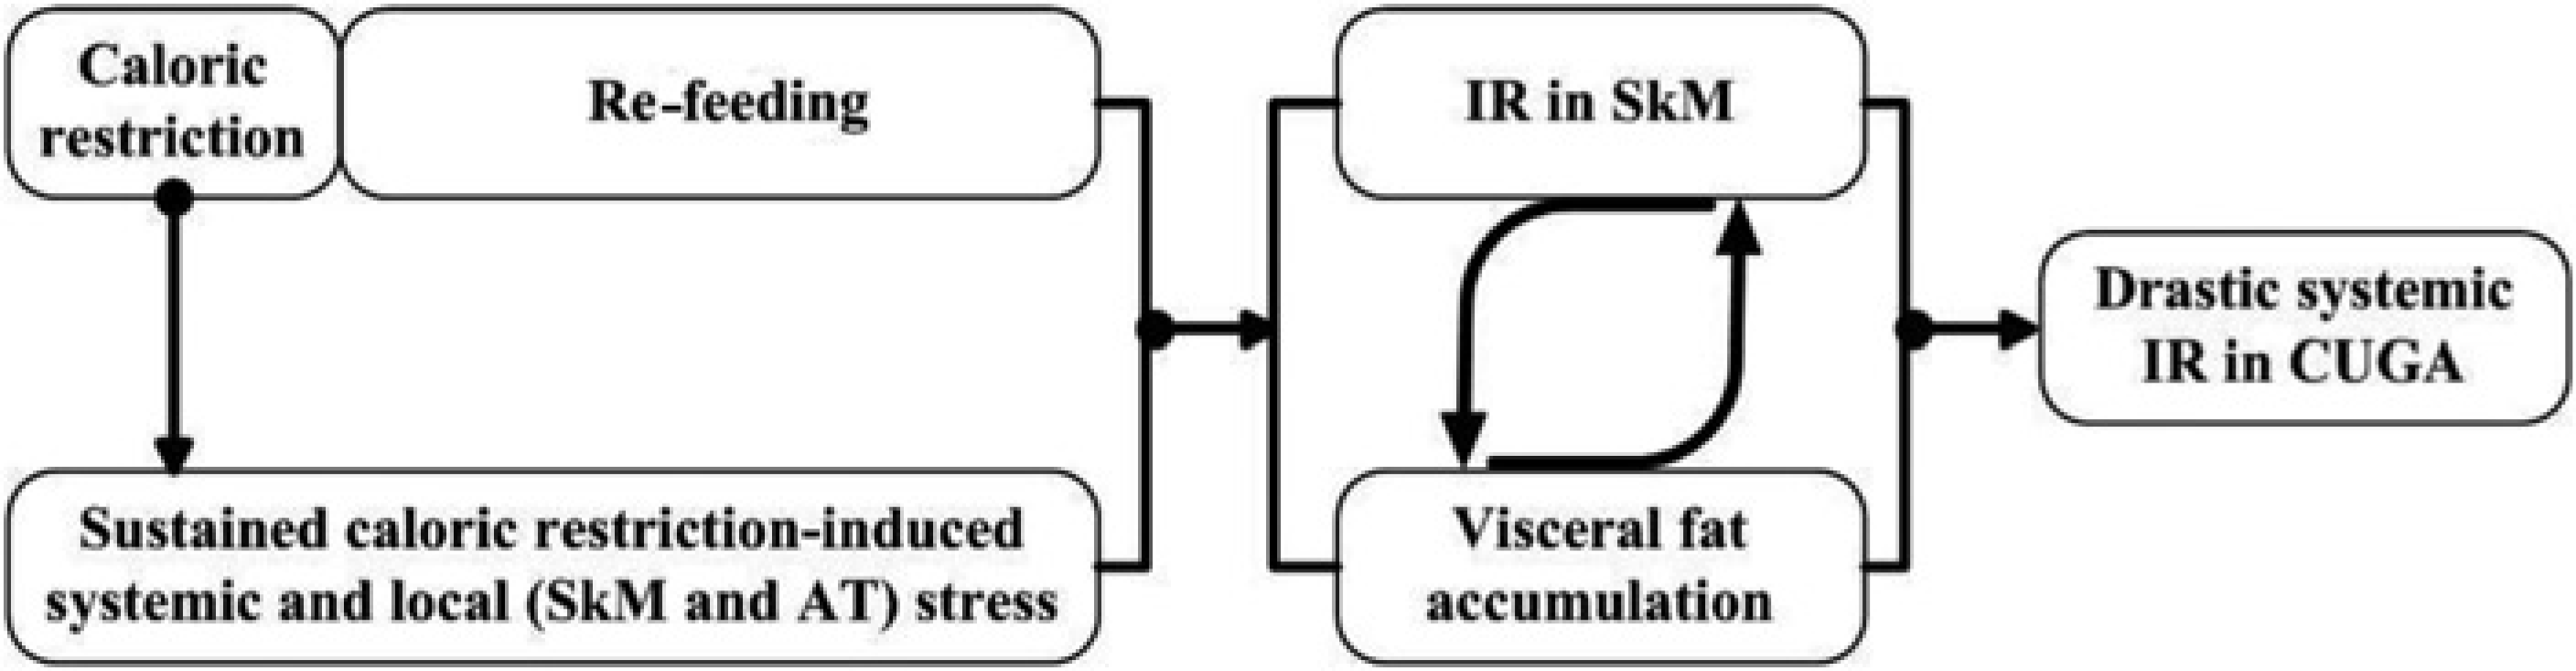
Footnotes
Acknowledgements
We thank Ms Payal Buckoreelall for valuable help in editing the manuscript. Many thanks to all those who were involved in this work, with particular gratitude to Dr Wei-Hong Yang, Xiu-Ling Deng, Wen-Fang Xia and Jie Min for generous advice and fruitful discussions.
This study was supported by National Natural Science Foundation of China (30771035 and 81170782) and the Independent Innovation Fund of Huazhong University of Science and Technology (2012QN233).