




Abstract
To assess the reliability and validity of self-reported height and weight in adults living with HIV/AIDS (ALWHA) we assessed 508 ALWHA of both genders on antiretroviral therapy. Height and weight were directly measured in a subsample. Sensitivity and specificity analysis were performed to determine the validity of self-reported measures. Bland–Altman's method was used to calculate the limits of agreement between values while reliability was assessed using intraclass coefficients. Regression equations were devised to determine actual measures from self-reported values. Mean differences among measured and self-reported weight were −0.96 kg for men and −0.54 kg for women. Mean height differences were less than 2 cm, yielding good reliability for body mass index (BMI). Overweight (BMI ≥ 25 kg/m2) diagnosis sensitivity was 90.6% and specificity was 81.2%. Corrected measures determined by regression equations had stronger correlation with self-reported values (r > 0.980). Self-reported height and weight showed good reliability and validity compared with directly measured height and weight. However, measures should be corrected whenever possible to achieve higher accuracy.
INTRODUCTION
Height and weight are important indicators of population health because of their role in calculating the body mass index (BMI), a common measure of obesity. 1,2 Self-report measures are one of the most frequently employed ways to collect data on height and weight and have been used consistently in epidemiological studies. They are quick and easy to administer, and have the advantages of low cost while requiring little or no training and infrastructure. They are also good methods for sampling large numbers of individuals.
However, these tools are subject to certain limitations: questions may be misunderstood, participants may not accurately recall past events and response biases such as social desirability are not uncommon. Therefore, the accuracy of self-reported measures needs to be determined. 1,2
Previous studies carried out in Brazil have indicated that self-reported and actual weights correlate by more than 90%, especially among individuals with high literacy and greater access to health care. 3–5
Although previous studies have reported that height and weight data are reported with acceptable accuracy, weight tends to be underestimated, more so by women and heavier individuals, whereas height tends to be overestimated, more so by men and shorter individuals. 6 Moreover, women with a BMI of less than 20.0 kg/m2 tend to overestimate their weight 2 and misclassification of nutritional status can be associated with specific characteristics (e.g. age, gender, socioeconomic status, etc.). Associations between misreporting of weight and age and race-ethnicity have been found. 7 Among women, the same author also found associations with income, marital status and schooling. Similar results have been shown among Brazilians. 5
To our knowledge, accuracy of self-reported weight and height among people living with HIV/AIDS (PLWHA) has not yet been studied. Obesity is a growing problem among this group, with a prevalence approaching that found among the general population. 8,9 A more practical method for assessing nutritional status could prove to be an useful tool in PLWHA.
The purpose of this study was to evaluate the validity and reliability of self-reported weight and height among adults living with HIV/AIDS (ALWHA).
METHODS
Data were collected in the municipality of São Paulo, Brazil, as part of a cross-sectional study in PLWHA (aged between 20 and 59 years old) who had been on combination antiretroviral therapy (ART) for at least three months. For the analyses performed in this article, only persons with both self-reported weight and height were included. Pregnant women were excluded, giving a final sample of 508 individuals.
Participants were selected from nine of the 15 STD/AIDS Specialized Health Community Centers administered by the City Council STD/AIDS Program. The health community centers included were located at four different geographic regions of the city of São Paulo and no differences regarding socioeconomic variables were found when included health centers were compared against those excluded due to infrastructure problems.
This study was approved by the Ethics Committees of both the School of Public Health and the Health Secretariat of the municipality of São Paulo. All patients were fully informed about the objectives and procedures of the study and provided their written informed consent.
During the interview carried out by a trained nutritionist and nutrition undergraduate students, participants were asked ‘how tall are you?’ and ‘when was the last time you had your height measured?’; ‘how much do you weigh?’ and ‘when was the last time you had your weight measured?’ In a subsample of 43 individuals, height and weight were directly measured by a trained nutritionist immediately after being asked to report both measures. Body weight was measured in light clothing to the nearest 0.1 kg using a digital scale (Tanita, Tokyo, Japan) and height was measured without shoes and recorded to the nearest 0.1 cm using a stadiometer (Seca, Hamburg, Germany). The average of duplicate measures was used to calculate BMI, which was later categorized as underweight (BMI < 18.5 kg/m2), normal weight (18.5–24.9 kg/m2), overweight (25.0–29.9 kg/m2) and obese (BMI ≥ 30.0 kg/m2). 10 BMI calculated from self-reported height and weight data is referred to throughout this paper as self-reported BMI.
The effects of two classes of variables were examined. Demographic variables included gender, age and education, whereas laboratory variables included CD4 cell count (cells/mm3), analysed by flow cytometry (FACS Calibur, Becton Dickinson, Sparks, MD, USA), and viral load (copies/mL) measured by branched DNA assay (Versant 440, Siemens, São Paulo, Brazil). Both variables were collected from participants’ medical files with a maximum time interval since interview day of ±6 months. Viral load was analysed as a dichotomous variable, where 50 copies/mL was the viral load detection threshold considered, although for 28 participants, 400 copies/mL was considered as the viral load detection threshold. Duration of known HIV infection and of antiretroviral drug (ARV) use was also collected from participants’ medical files.
The sample was described by proportion, means and standard deviations, and was compared with the subsample, with both self-reported and directly measured values assessed, using the Student t-test and chi-square test. The Kolmogorov–Smirnov test was used to investigate the adherence of the study variables to a normal distribution. As all variables presented a normal distribution, correlation coefficients could be employed.
Differences were calculated by subtracting the self-reported value from the measured value.
Sensitivity, the probability of an overweight (BMI > 24.9 kg/m2) or underweight (BMI < 18.5 kg/m2) individual, based on measured values, being correctly classified as overweight or underweight, and specificity, the probability of a person who is not overweight or underweight, based on measured value, not being classified as overweight or underweight taking into account self-reported values, were calculated to evaluate validity.
Reliability between measured and self-reported values of weight and height was evaluated using Intraclass correlation coefficient (ICC) and 95% confidence interval (95% CI).
In addition, Bland and Altman 11 plots were used in order to examine the individual agreement between self-reported and measured data. On these plots, the differences between measured and self-measured values (measured minus self-reported) were plotted against the mean of measured and self-reported values. Limits of agreement were calculated as the mean difference±1.96 standard deviation (SD).
Regression analyses were performed to generate formulas that could predict actual height and weight from self-reported values. Measured height and weight were the dependent variables, and self-reported values, demographic variables (gender, age and schooling), clinical (duration of known HIV infection and ARV use) and laboratorial variables (CD4 cell count and viral load) were the independent variables. Although we attempted to carry out gender-specific analyses, general regression models presented better adjustment (r 2) than those carried out on women and men separately.
The BMI distribution of the sample is presented comparing proportions based on self-reported and corrected measures.
Statistical analyses were performed using SPSS, version 13.0 (SPSS Inc, Chicago, IL, USA) and P values <0.05 were considered to be significant.
RESULTS
Characteristics of the population (São Paulo, 2008)
ART = antiretroviral therapy; SD = standard deviation
*The subsample had both self-reported and direct measures assessed
†Student's t test or chi-square test. Significant when P < 0.05
Differences between self-reported and directly measured weight, height and BMI values of adults living with HIV/AIDS (São Paulo, 2008)
SD = standard deviation; CI = confidence interval; BMI = body mass index
*Mean Differences=measured values−self-reported values
†Intraclass correlation coefficient
‡ P < 0.001
Mean differences between self-reported and measured weight were −0.96 kg for men and −0.54 kg for women. Height and weight were overestimated in both men and women, and mean differences in height were −1.80 cm for men and −1.63 cm for women. However, BMI was slightly underestimated by 0.10 kg/m2 among men 0.19 kg/m2 among women (Table 2).
Figure 1 shows the extent of misreporting of body weight, height and BMI in the subsample. Individual differences in the accuracy of self-reported anthropometrics are evident along with a tendency to over-report. For example, difference between measured and self-reported values of BMI ranged from 2.0 cm (over-reporting) to −2.0 cm (under-reporting). However, most scores for all measures (weight, height and BMI) lay between the limits of agreement, thereby indicating good agreement for both measures. In each figure, the solid line represents the mean difference between measured and self-reported values while the dashed lines represent 95% limits of agreement.
Bland–Altman plots of the difference between measured and self-reported body weight (a), height (b) and body mass index (BMI) (c) plotted against the mean
Probability of correct classification of overweight and underweight status using body mass index (BMI) among adults living with HIV/AIDS (São Paulo, 2008)
*Overweight = BMI ≥ 25.0 kg/m2; underweight = BMI < 18.5 kg/m2
The prediction equations for height and weight, and the percentage of variance explained by the equation (r
2), are given as
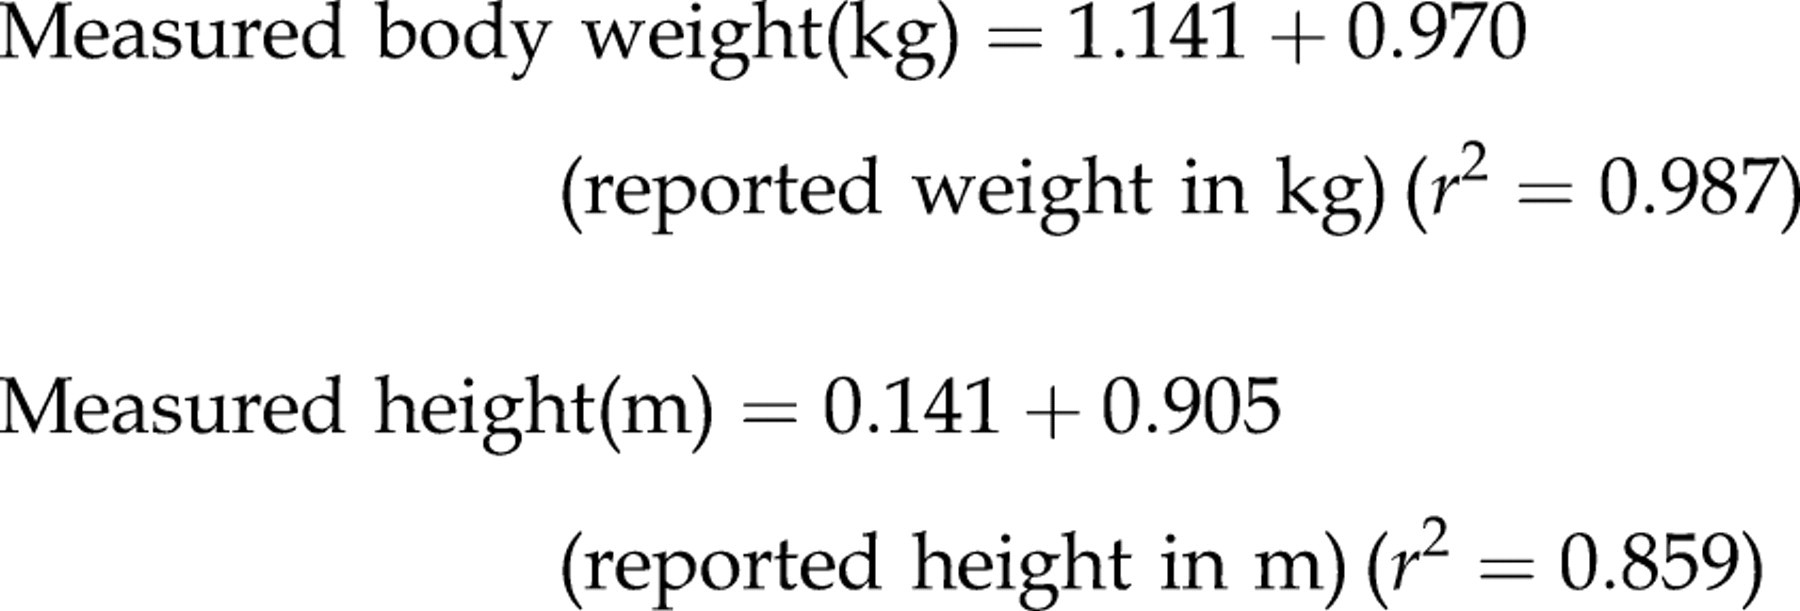
ICCs between corrected and self-reported values were higher than those between measured and self-reported values (ranging from 0.996 among men to 0.998 among women). Nonetheless, it is notable that ICCs found for corrected and self-reported height were more strongly influenced (ICC = 0.941 for men and ICC = 0.982 for women). Similar findings were observed for BMI (ICC ranging from 0.995 among men to 0.999 among women).
The above equations were applied to the entire population to give corrected self-reported values. The distribution of nutritional status according to BMI among the studied population is shown in Figure 2. Proportions of self-reported and corrected values are similar. Regarding the BMI groups (i.e. underweight, normal weight, overweight and obese groups), the prevalence of being overweight in the overweight group was over-reported by both men and women. For instance, a 3.2% prevalence difference of overweight was observed in men.
Effect of corrected and self-reported weight and height on nutritional status classified by body mass index (BMI) among adults living with HIV/AIDS (São Paulo, 2008)
Based on corrected values, 34.9% of men and 34.7% of women were considered overweight (BMI ≥ 25 kg/m²) while 2.6% and 9.9% were classified as being underweight, respectively.
DISCUSSION
The results from the present study indicate that the use of self-reported weight and height is valid and reliable among ALWHA. To our knowledge, there are no published studies investigating the validity and reliability of self-reported weight and height in this population. As previous findings have shown a growing prevalence of being overweight in this group, with rates ranging from 29% to 63% of men and women living with HIV/AIDS in both developing and developed countries, 8,9,12 tools to assess nutritional status at low cost are needed.
Unlike other population-based studies, our results showed that body weight was over-reported by both men and women. 2 Ziebland et al., 13 when individually analysing women with BMI of less than 20 kg/m2, showed a tendency to overestimate weight by approximately 0.8 kg. Similar findings have been observed among Brazilian women from a population-based sample (0.4 kg). 5
Overestimation of weight in men (1.93 kg) has also been reported, thus corroborating our results (0.96 kg). 5
Underestimating body weight is understandable in western society due to the desire to be tall and slim. 6 According to the literature, overweight individuals under-report their body weight, while underweight individuals tend to over-report it. 3,14 It is possible that PLWHA present similar behaviour to underweight individuals or to those with eating disorders, particularly in relation to the person's body image and the erroneous idea of their weight which reflects an internally desired body image, as well as the possible influence of cultural norms or personal psychological needs to report weight inaccurately. 3
Weight loss among PLWHA, even if desired in order to reach a healthy weight, may be associated with the stigma of the early years of the AIDS epidemic. Back then, Kaposi sarcoma, opportunistic diseases and rapid weight loss were common signs of AIDS, contributing towards the strong stigma of the disease. 15 On the other hand, after the introduction of combination ART, this same group has to live with metabolic and body changes, which are not yet fully understood but are associated with the use of ARV drugs. 15,16 Future studies seeking to assess the reasons for weight overestimation among PLWHA are warranted.
Mean height differences have corroborated previous findings, varying from 1.63 cm in women to 1.80 cm in men. A systematic review conducted pointed out that height was overestimated in most of the selected studies involving men and women, and that the mean error ranged from 0.6 to 7.5 cm. 2 Similar results have been found in Brazilian samples. 4,5,17 Moreover, graphical comparison between the two sources of data suggests a slight tendency towards overestimation of height, a finding in line with results found by other investigators. 17
Due to the small discrepancies found between self-reported and measured values, the effect of self-reporting on BMI estimation was insignificant (net difference of 0.13 kg/m2). These results are consistent with those described by other authors. 1,4
Although the good concordance, estimated by the ICCs, between self-reported and measured values, coefficients for height stratified by gender were slightly lower than those found for weight and BMI, and lower than ICCs previously found in Brazil: ICC = 0.98 by Chor et al. 17 and ICC = 0.97 by Fonseca et al. 4
A positive association has been found between correctly reported weight and number of visits to a health setting. 14 As visits to STD/AIDS Specialized Health Community Centers are frequent, these visits probably contributed towards making patients more aware of their weight. In contrast, Bailey et al. 18 showed that 25% of the middle-aged women studied had their heights measured during medical appointments. Measuring body weight is routine practice at Brazilian clinics, principally to enable drug dose adjustments to be made. However, height is seldom assessed, thus raising a possible explanation for the higher accuracy of self-reported weight compared with self-reported height.
High sensitivity and specificity values were observed in the analysis of BMI validity, calculated from the self-reported values of body weight and height. The sensitivity values of greater than 90% and specificity of around 80% indicate that most of the participants correctly self-reported their weight and height. For those individuals classified as being overweight according to measurements, sensitivity values from the self-reporting were around 90% for overweight diagnosis, a figure similar to findings of other studies. 4,19,20 Specificity, however, was found to be lower in the present study among men (71%), probably due to the greater overestimation of height rather than weight seen in this group. Sensitivity was perfect for underweight diagnosis and specificity was perfect among men only, results similar to those found before when underweight individuals were assessed (sensitivity of 72% and specificity of 97%). 3
Therefore, the prevalence of overweight/obesity in this population could be assessed with reasonable accuracy by using self-reported values. Nevertheless, recent evidence suggests that misclassification of self-reported BMI results in overestimated associations between overweight/obesity and concomitant morbidity. 21 Consequently, caution is necessary when assessing the prevalence of overweight-related health conditions based on self-reports, especially among men living with HIV/AIDS: 29% of whom were considered false-negative for overweight classification.
Correcting self-reported values with regression analyses may minimize this common bias when using self-reported data. 1,5 Results from a cohort of English participants in the European Prospective Investigation into Cancer and Nutrition (EPIC-Oxford) pointed out that after self-reported values of height and weight were corrected with predictive equations derived from 10% of the sample, misclassification of nutritional status decreased to 15% in men and 14% in women. 22
In the present study, after self-reported weight and height of the entire population were corrected with the equations devised from data collected in a subsample representing approximately 9% of the whole sample, ICCs between corrected BMI and self-reported BMI increased. Similarly, corrected height and weight concordance with respective self-reported values also improved, corroborating results of previous studies. 5,23 Hayes et al., 24 after correcting self-reported weight and height, found that overweight and obesity prevalence CIs estimated from the corrected values were superior to those calculated from self-reported values.
In the present study, directly measured values were predicted only by their respective self-reported values, a finding replicated before in Brazil, 3 and more recently in an Australian population survey. 24 Furthermore, high percentages of variance explained by our predictive equations (r 2) agreed with previous findings. 1,19,24
In conclusion, the results of the present study suggest that self-reported anthropometrics are valid and reliable for use among a population of adults living with HIV/AIDS. As weight and height self-reporting can be assessed relatively easily and at low cost, this could constitute a useful tool for evaluating nutritional status of PLWHA. In analyses where anthropometric factors are important variables of interest, measurements taken from a sample of the study population should be used to improve the accuracy of estimates of height, weight and BMI. The predictive equations presented in this study to correct self-reported weight and height can be applied to other samples with similar demographic characteristics.
Footnotes
ACKNOWLEDGEMENTS
The authors would like to thank the City Council Program of STD and AIDS of the municipality of São Paulo for its contribution to this study. ACFLD received a Master's Scholarship from the Research Support Foundation of the State of São Paulo (FAPESP).