




Abstract
The prevalence of antiretroviral drug resistance in patients undergoing routine testing while receiving treatment in the UK is about 50%. Most resistance is against nucleoside reverse transcriptase inhibitors and non-nucleoside reverse transcriptase inhibitors, but 25% of patients receiving protease inhibitors (PIs) also have evidence of PI resistance. Although extensive resistance profiles are rare, a proportion of patients present with complex genotypes, which makes treatment selection difficult and vitally important. A resistance profile can be interpreted to provide an indication of the degree of resistance to different drugs and the potential drug options. Factors to bear in mind during treatment selection include phenotypic and genotypic resistance, mutation patterns, numbers and ‘weights’, and the hypersusceptibility and fitness effects of certain mutations. In treatment-experienced patients, physicians should aim for a regimen that combines at least two, preferably three, fully active drugs. In addition to selecting drugs that are predicted to have activity, the relative genetic barrier, cross-resistance potential and support needed to maintain activity in the long term are also key considerations.
Introduction
The UK resistance database, which collects virtually all genotypic resistance tests in the country, shows that the prevalence of resistance (defined as the presence of resistance mutations in patients who are receiving treatment and have undergone a resistance test as part of routine clinical care) is about 50% (Figure 1). Most resistance is against nucleoside reverse transcriptase inhibitors (NRTIs) and non-nucleoside reverse transcriptase inhibitors (NNRTIs), but 25% of patients receiving protease inhibitors (PIs) have evidence of PI resistance. Importantly, PI resistance usually coexists with NRTI resistance and NNRTI resistance in this patient group. This paper will use the case study shown in Box 1 to discuss interpretation of resistance data and the development of treatment regimens involving PIs.
Prevalence of antiretroviral drug resistance among treated patients undergoing testing in the UK. Reproduced with kind permission from Geretti et al.
1
NAM = nucleos(t)ide-associated mutation; nNAM = non-nucleoside-associated mutation; PRAM = protease resistance-associated mutation
Resistance Profile
Figure 2 shows the patient's resistance profile. Extensive profiles such as this are fortunately infrequent, but a proportion of patients still present with such complex genotypes.
Case study: genotypic resistance results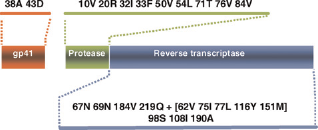
In this case, a number of mutations consistent with the patient's treatment history are present in the reverse transcriptase: the Q151M complex (A62V V75I F77L F116Y Q151M, which confers multinucleoside resistance), two thymidine analogue mutations (TAMs; D67N and K219Q), M184V and T69N. Mutations associated with resistance to the NNRTIs are present from when the patient was failing on nevirapine, with G190A as an important resistance mutation in this respect. Many important protease mutations are also present, including I50V, which is the characteristic fosamprenavir mutation. The patient also has resistance to enfuvirtide, with two mutations that confer resistance to this drug in gp41.
Interpreting Resistance Data
Case study: resistance to available antiretroviral agents
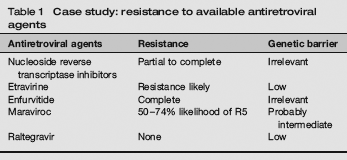
In the case of NRTIs, resistance in this patient is virtually complete. The presence of the Q151M complex usually means that the level of resistance to tenofovir is not as high as the levels of resistance to, for example, zidovudine, stavudine or abacavir, but other mutations, such as D67N, will impact on the efficacy of tenofovir. Thus, although tenofovir may have some residual antiviral activity in this patient, it would be weak. Many physicians, when developing a salvage regimen for this patient, might choose to continue lamivudine or emtricitabine in an attempt to maintain the M184V mutation, which is believed to make the virus less able to replicate and to increase its susceptibility to a drug such as tenofovir.
The patient has one mutation for etravirine (G190A), which initially suggests that the patient will have low-to-intermediate resistance to etravirine. It is always important, however, to bear in mind the treatment history when interpreting a resistance profile. As this patient failed over several years on stavudine, lamivudine and nevirapine, he may have accumulated other NNRTI mutations that are no longer apparent in the genotype but that are ‘archived’. Although the patient may have only partial resistance to etravirine, the background of NNRTI resistance means that the genetic barrier of etravirine will be low. Overall, therefore, the drug will have to be well supported to ensure that it maintains its partial antiviral activity.
Case study
A 44-year-old man was first diagnosed with HIV in 1987. He has a long antiretroviral treatment history staring in 1987 with zidovudine monotherapy. Since then he has received a number of different regimens, as is the case for many patients with longstanding HIV infection. He has experienced significant toxicity from the drugs, including anaemia with zidovudine, renal colic on indinavir, lipoatrophy after several years on stavudine and severe diarrhoea with lopinavir/ritonavir. He also experienced three years of virological failure with stavudine, lamivudine and nevirapine, as well as PI failure - first with nelfinavir and then with lopinavir/ritonavir. In 2006, he began treatment with emtricitabine plus tenofovir disoproxil fumarate, boosted fosamprenavir and enfuvirtide (T20). He initially achieved a viral load <50 copies/mL but this subsequently rebounded and his viral load is now 5000 copies/mL. His CD4 cell count is 98 cells/mL
This patient has complete resistance to enfuvirtide, so there would be no significant virological benefit from continuing the drug once resistance has emerged. Among highly treatment-experienced patients with CD4 counts of around 100 cells/mL, approximately 50% show R5 virus when tested with the standard Trofile assay, increasing further with the enhanced Trofile assay. A tropism test would therefore be needed to ascertain whether maraviroc is an option for this patient. The genetic barrier of maraviroc is currently uncertain, but is unlikely to be as low as that for the NNRTIs. In the case of integrase inhibitors such as raltegravir, activity would be expected to be high, as the patient is naive to this class of antiretroviral drugs. However, the genetic barrier of integrase inhibitors, including raltegravir, is low, and the drug will therefore be potent but would retain its activity only if it is well supported by other drugs in the regimen.
Factors Influencing Selection of A Protease Inhibitor
Overall, the regimen developed for an individual patient needs to provide a balance between good virological activity and good genetic barrier to prevent rapid loss of activity. A variety of factors will therefore influence the selection of a PI in this context. The first is overall phenotypic resistance to the PIs, including fold changes and clinical cut-off points - in other words, the level of resistance that, for that particular drug, impacts on virological responses. In terms of the genotype, it is important to consider mutation patterns, the number of mutations and the ‘weight’ of mutations - that is, the contribution of each mutation to the overall loss of activity. It is also important to consider the correlation between activity and drug levels. In the context of salvage treatment, hypersusceptibility and fitness effects may be helpful.
Phenotypic and genetic susceptibility
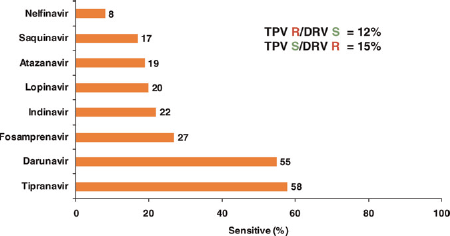
In an American cohort of treatment-experienced patients failing on a PI, 139/236 (59%) had evidence of PI resistance, with 28% of patients resistant to all PIs and only 27% sensitive to one of the second-generation PIs with a high genetic barrier to resistance (tipranavir [TPV] and darunavir [DRV]) (Figure 3).
2
Furthermore, 12% of patients were resistant to TPV but susceptible to darunavir and 15% were susceptible to TPV but resistant to darunavir. Even in a population with quite extensive resistance, therefore, it is still possible to find differential activity for PIs with a high genetic barrier. When the activity of TPV in this population is examined in more detail, the susceptibility predictably declines with the greater number of PIs that have been used in the patient (Table 2).
3
Overall, about 58% of this population retained susceptibility to TPV.
Genotypic susceptibility to protease inhibitors in treatment-experienced patients. Reproduced with kind permission from Baxter et al.
2
R = resistance; S = susceptibility Genetic susceptibility to tipranavir by prior use of protease inhibitor (PI) Includes full and partial susceptibility. Reproduced with kind permission from Piliero et al.
3

Weighted mutation scores
It is possible to predict activity from the resistance profile by counting mutations and then evaluating the weight of those individual mutations.
Tipranavir
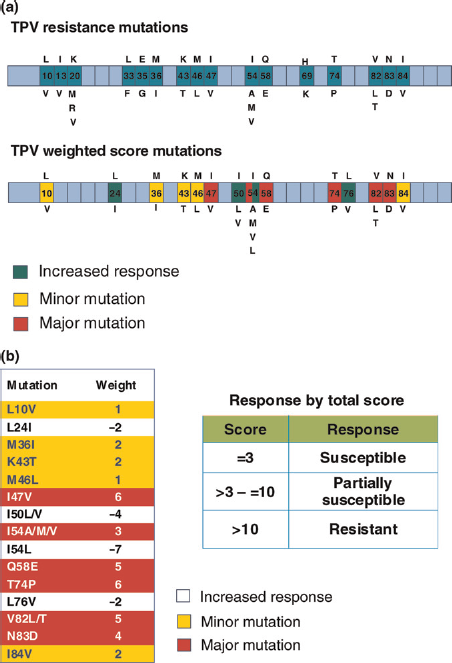
A weighted mutation score has been developed to predict viro-logical response to TPV/ritonavir.
4
This reflects the observation that some mutations have a greater impact on responses than others and that some mutations are associated with improved responses. The genotypic score for TPV has evolved over time to reflect refinement of analysis and emerging data. Figure 4 illustrates the TPV resistance-associated mutations (RAMs) and their weight, including mutations associated with resistance and with increased susceptibility to the drug. If the total weighted score is ≤3, treatment-experienced patients treated with ritonavir-boosted TPV will usually obtain maximum responses. A total score between 3 and 10 indicates intermediate activity, while a total score >10 indicates loss of activity.
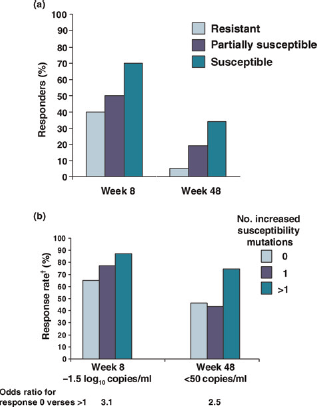
When this weighted mutation score was applied to highly treatment-experienced patients in the RESIST trial, there was clear definition in the three strata and a correlation between vir-ological responses (defined as at least one log drop in viral load) early after initiation of the salvage regimen and at week 48 (Figure 5).
4
In addition, the number of mutations conferring increased susceptibility (L24I, I50L/V, I54L and L76V) was shown to correlate with improved virological responses to TPV/ritonavir at week 48 compared with patients who lacked these mutations.
6
RESIST: virological response* to tipranavir/ritonavir by weighted score (a) and when mutations conferring increased susceptibility (24I, 50L/V, 54L and 76V)† are present. *Response = viral load reduction ≥1 log10 below baseline without treatment change. †ln patients with background activity score >0.5. Reproduced with kind permission from Scherer et al.
4
and Hall et al.
8
Darunavir
A genotypic susceptibility score derived from the POWER study identified 11 darunavir RAMs at 10 positions in highly treatment-experienced patients.
7
In a subsequent update, substitution of T74P for G73S improved the model.
8
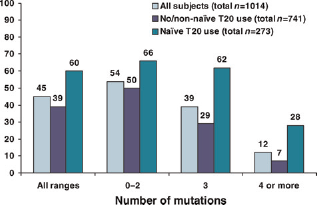
Results from the POWER and more recent DUET studies showed that the number of mutations correlates well with responses (Figure 6): responses declined as the number of mutations increased, with more marked reductions in patients with four or more mutations. Emerging data confirm that the mutations identified for darunavir are those that appear in patients failing on darunavir; research is thus starting to identify predictors of darunavir activity.
Response to darunavir/ritonavir (600/100 mg twice daily) by baseline mutations. From Prezista summary of product characteristics
7
There is currently no confirmed weighting for darunavir mutations, but the Stanford database provides a way interpreting resistance data and assign a mutation score (http://hivdb.stanford.edu/). Each mutation within the Stanford database is assigned a value based on knowledge of the impact of the mutation. I50V is a major mutation that impacts significantly on resistance overall and is assigned a value of 20; other mutations that contribute significantly include I47V, I54M and I84V, which are all assigned a value of 12. The contribution of mutations such as V33F and V32I is currently unknown, and they are assigned values of 10 and 5, respectively. The sum of these values can be used to classify the level of resistance as partial or high.
Partial resistance overlap
Partial overlap exists between the mutational pathways driven by darunavir and TPV. Some important protease mutations are common to more than one resistance pathway, while many other mutations are associated with only one drug: mutations I47V, I54M, T74P and I84V are common to TPV and darunavir, but each drug also has a wide range of mutations that are not related strongly to resistance in the other. Consistent with these findings, when phenotypic susceptibility to darunavir is plotted against phenotypic susceptibility to TPV, the overall correlation is poor (correlation coefficient 0.35), 9 which indicates that many viruses that are resistant to one drug may retain at least partial susceptibility to the other. There is, however, a much tighter correlation between resistance to darunavir and resistance to fosamprenavir (correlation coefficient 0.90).
As these two drugs are structurally related, it is not surprising that when there is phenotypic resistance to one, the level of phenotypic resistance to the other increases in parallel. To a smaller extent, there is also a correlation in terms of phenotypic resistance between darunavir and lopinavir/ritonavir.
Selecting A Treatment Regimen
The first step in determining a treatment plan for our patient with extensive resistance is to determine the resistance levels. This could be achieved by using the simple mutation counting technique, in which case the patient is likely to have a poor response to darunavir because he has six mutations and the presence of three or more mutations is known to correlate with loss of drug activity (Figure 7). The weighted mutation score for TPV could also be applied: in this case, two mutations will contribute with a positive weight and others will contribute with a negative weight. Overall, whether or not one takes the hypersusceptibility mutations into account, in this patient, susceptibility to TPV is likely to be higher than susceptibility to darunavir. This correlates well with the Stanford interpretation, which indicates high-level resistance to darunavir and low-level resistance to TPV.
Case study: genotypic resistance test results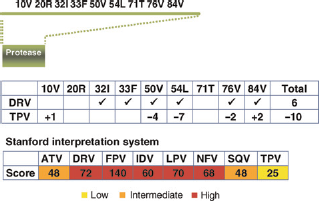
Once the resistance pattern has been determined, the next stage is to decide on a treatment regimen. The resistance pattern identified in this case suggests that TPV would be a possible candidate, but it should not be used alone.
Enfuvirtide could usually be a potential partner for TPV, but this patient has high levels of resistance to this drug. Etravirine is not a good partner option, as, due to drug-drug interactions, the area under the curve at 12 hours for etravirine would be reduced by 76%. 10 Maraviroc could be used if the patient showed an R5 HIV profile, 11 and raltegravir or elvitegravir are also possible options.12,13 The BENCHMRK study provides data from a subset of patients with genotypic susceptibility to TPV at baseline who received raltegravir or placebo with an optimized background regimen that included TPV/ritonavir. 14 The proportion of patients with a viral load <50 copies/mL at 48 weeks was 40% in the placebo group and 73% in the raltegravir group. Change from baseline in CD4 count/mL was also better in the raltegravir arm than in the placebo arm (+114 versus +56). Similarly, the MOTIVATE study involved a subset of patients who used maraviroc or placebo with an optimized background regimen that included TPV/ritonavir. 15 At 48 weeks, the proportion of patients with a viral load <50 cells/mL was 29.4% in the placebo arm and 49.4% in the maraviroc arm. The improvements in viral load and CD4 counts in these two studies highlight the level of virological suppression and immunological improvement that can be achieved by combining active drugs even in a highly treatment-experienced and highly resistant population.
Box 2 summarizes the outcome for the patient in the case study.
Case study: outcome
The patient's Trofile test predicted that R5 virus was present. The physician chose tipranavir/ritonavir, raltegravir and maraviroc. Three months later, the patient's CD4 count was 175 cells/mL and the viral load was <50 copies/ mL. The patient continues on the same regimen.
Conclusion
In treatment-experienced patients, physicians should aim for a regimen that combines at least two, preferably three, fully active agents. It is important, however, to consider not only the activity of the drugs but also the relative genetic barrier, the potential for cross-resistance and the degree of support the drugs need to ensure their activity is maintained in the long term. It is also important to remember that there is only partial overlap in the resistance profiles of TPV and darunavir; the resistance results should therefore be reviewed to ensure the correct PI is chosen from the virological perspective. Other considerations such as adherence, tolerability and drug-drug interactions also need to be taken into account. The TPV weighted mutation score can be used to guide decision making, as TPV can be used effectively in combination with newer agents that are becoming available.