
Abstract
China has recently experienced an increase in the incidence of syphilis. Effective spatial monitoring of syphilis incidence is important for successful implementation of control and prevention programmes. This study monitored county-level primary and secondary (P&S) syphilis incidence rates for all of mainland China by examining spatial patterns. Exploratory spatial data analysis (ESDA) methods were used to characterize the spatial distribution pattern of syphilis cases. During the seven-year study period, the average annual P&S syphilis incidence was 8.82 cases per 100,000 people. Using Empirical Bayes smoothed rates, the local Moran test identified many areas of high syphilis risk (all P values ≤0.01). The number of high-risk counties increased from 73 counties in 2004 to 134 counties in 2010. An eastern coastal cluster of high-risk counties persisted throughout 2004-2010. ESDA methods can assist public health officials in identifying high-risk areas. Allocating more resources to high-risk areas could more effectively reduce syphilis incidence.
Keywords
Introduction
Syphilis, a sexually transmitted infection (STI) that was nearly eliminated from China 50 years ago, 1 has made a resurgence in the past 20 years. Syphilis is now among the top five most commonly reported communicable diseases, and is the most frequently reported STI in China. 2 Nationwide surveillance data indicate that the total incidence of syphilis in China increased from 7.12 cases per 100,000 people in 2004 to 15.88 cases per 100,000 people in 2007. 3 By way of comparison, there were more reported syphilis cases in Guangdong province in 2008 than in the entire European Union in the same year. 4 In response to this trend, the Chinese Ministry of Health recently issued a 10-year plan for syphilis control and prevention, recognizing the reemergence of syphilis as an important public health threat and renewing interest in syphilis control programmes. 5
Previous studies have demonstrated that STIs are not equally distributed across geographic areas.6-10 The design and implementation of effective interventions to control or prevent syphilis should be grounded in a good understanding of existing and emerging spatial patterns. Exploratory spatial data analysis (ESDA) methods, which provide a set of robust tools and techniques for exploring spatial data, are an emerging approach to achieving this understanding. 11 ESDA methods can be applied by health officials to monitor spatial variations in disease rates, which can assist health officials in designing more location-specific control and prevention programmes who take into account global and local spatial influences. 10
The Chinese Center for Disease Control and Prevention (CDC) established a routine reporting system for selected infectious diseases in the 1950s. 2 The system switched from paper-based reporting to an electronic file system in 1985, and since 2004 has used web-based reporting (the China Information System for Disease Control and Prevention, CISDCP), which is more sensitive and efficient than the previous system. 12 However, only a few studies have utilized information collected by this system on a nationwide basis,13-17 and none of these studies have included a spatial analysis of disease patterns.
In this study, we used ESDA methods, involving Bayesian smoothing and spatial autocorrelation, to provide a thorough spatial (entire mainland China) description of the occurrence of primary and secondary (P&S) syphilis from 2004 to 2010. We also identified clusters in syphilis incidence in mainland China, thus providing spatial guidance for future research.
Methods
Data
Records on P&S syphilis cases in mainland China's 2872 counties from 2004 to 2010 were obtained from CISDCP. Since syphilis cases were collected through the CISDCP system, the incidence of syphilis in this paper in fact refers to the reported incidence of syphilis. Our analysis focused on P&S syphilis cases because these outcomes are likely to be more sensitive to changes in sexual behaviours than are latent syphilis cases. We used reported P&S syphilis cases over seven years to provide a stable measure of disease incidence by time and location (county). 18 In order to conduct a geographic information system-based analysis of the spatial distribution of P&S syphilis, county-level polygon maps at a 1:1,000,000 scale were obtained. Demographic information was obtained from the National Bureau of Statistics of China, which provided estimated population data based on the 2000 census. P&S syphilis cases were geocoded and matched to the county-level layers of the polygons by administrative code using the software Mapinfo7.0 (Pitney Bowes Software Inc, Troy, NY, USA).
Empirical Bayesian smoothing
When estimating the underlying disease risks, raw rates derived from different administrative units across the whole study area may result in variance instability and spurious outliers. This is because the rates observed in areas with small populations may be highly unstable in that the addition or deletion of one or two cases can cause drastic changes in the observed values. Empirical Bayesian (EB) smoothing, originally proposed by Clayton and Kaldor, 19 is a way to address this variance instability. The EB smoothing method borrows strength from a prior distribution to correct for the variance instability associated with rates that have a small base. Disease rates, especially those in areas with small populations, are adjusted to be closer to the overall mean of the region. The resultant map no longer has unstable disease rates in areas with small numbers of cases.
Anselin's local Moran's I
Anselin's local Moran's I (LISA) was first proposed in 1995. 20 We used the GeoDa cluster detection software programme (GeoDa Center, Tempe, AZ, USA) to compute the LISA test statistic. This method aims to identify clusters with disease rates that are similar in magnitude, and to identify outliers by comparison with their neighbours and the mean of the whole region. We used the standardized first-order ‘queen neighbors’ as the definition of neighbours. LISA statistics for syphilis incidence were calculated based on the assumption of constant variance. This assumption might be violated when incidence at the county level varied greatly across the whole study region. EB smoothing was performed to adjust for this violation. After computing the LISA statistics from the smoothed rates, we evaluated the test statistic using the Monte Carlo P value, which was derived from 999 randomizations of the dataset. Since the multiple comparisons increased the chances of identifying overlapping clusters, we used an alpha level of 0.01 to assess the statistical significance.
Results
Annualized average of P&S syphilis from 2004 to 2010
Summary statistics for the EB smoothed rates for all counties were calculated. The mean and standard deviation were 8.82 and 14.48, respectively, per 100,000 people. The identifier for outliers was the computed z-value, the difference between the observed and expected mean of the EB smoothed rates standardized by the standard deviation (Table 1). Thus, it had a mean of 0 and a variance of 1. Chenzhong County had a rate of 24.35 standard deviations from the mean for 2004-2010. All 10 counties with the highest rates were at least 5.12 standard deviations from the mean.
Empirical Bayesian (EB)-smoothed primary and secondary (P&S) syphilis incidence rates in China's 10 highest-incidence counties, 2004-2010
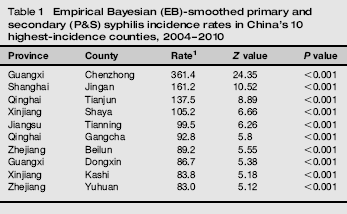
Figure 1 gives an indication of spatial associations: counties with similar colour shades tended to be near each other. We carried out a formal statistical test using Moran's I. The test statistic was 0.4731 (Z = 30.74, P = 0.001). The P value was calculated based on 999 simulations.
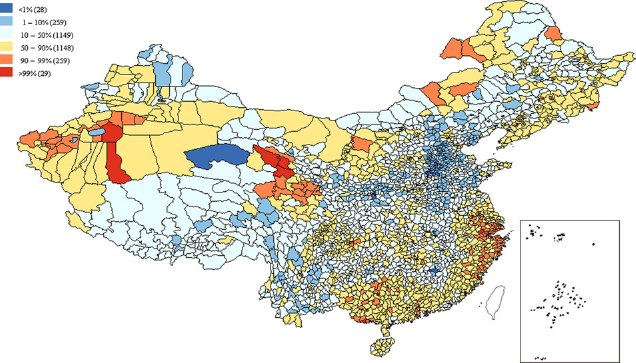
Bayesian-smoothed primary and secondary syphilis rates in China by county, 2004-2010
The local Moran cluster map (Figure 2) indicates that smoothed P&S syphilis incidence rates for two counties were significantly (P ≤ 0.01) higher than those of their contiguous neighbours. One of these, Lingzhi County had smoothed rates of more than 16, while its neighbours’ rates were all 3.0 or less.
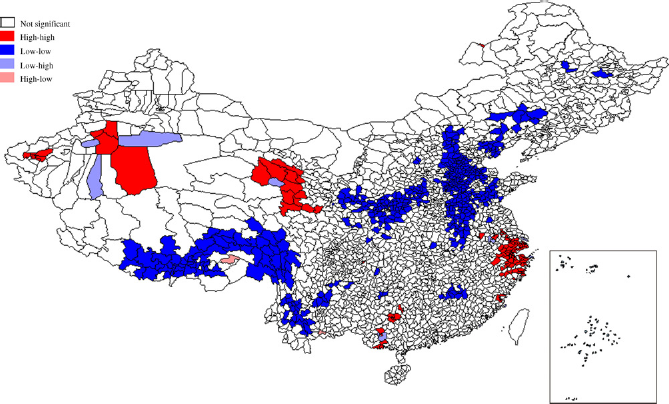
Local Moran cluster map of primary and secondary syphilis rates in China, 2004-2010
The local Moran's I method showed four major clustered areas of high P&S syphilis risk (Figure 2). The first, located in eastern China, was centred in Shanghai, Jiangsu, Zhejiang and Fujian provinces and included a total of 90 counties. EB smoothed rates for these counties ranged from 12.10 to 161.20 cases per 100,000 people. The second high-risk cluster was in southern China (Guangxi Province), and comprised 15 counties. EB smoothed rates for these counties ranged from 11.50 to 361.40 cases per 100,000 people. The third cluster, which included 11 counties, was centred in Qinghai Province in north west China. EB smoothed rates for these counties ranged from 9.60 to 137.50 cases per 100,000 people. The fourth cluster, of eight counties, was located in Xinjiang Province in north west China. EB smoothed rates for that cluster ranged from 18.40 to 105.20 cases per 100,000 people.
There were also a few cases where single counties emerged as significant clusters by themselves but were difficult to discern on the maps (e.g. Manzhouli County).
Changes in P&S syphilis rates from 2004 to 2010
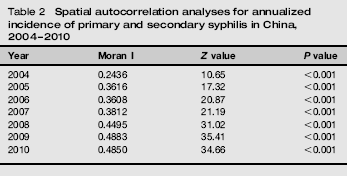
The value of global Moran I increased from 0.24 to 0.48 between 2004 and 2010, indicating that the spatial distribution of P&S syphilis has become more uneven (that is, the clustering of high and low values is becoming more prominent) (Table 2). The formal test of spatial dependence was significant for each year, implying that distribution of P&S syphilis was spatially autocorrelated in China.
Spatial autocorrelation analyses for annualized incidence of primary and secondary syphilis in China, 2004-2010
The cluster areas varied greatly during the seven-year study period (Figure 3). The number of high-risk counties – that is, those counties included in clustered areas of high P&S syphilis risk identified by the local Moran's I method – increased from 73 in 2004 to 134 in 2010. The number of high-risk counties in Shanghai, Zhejiang and Jiangsu provinces increased from 40 in 2004 to 85 in 2010. The number of high-risk counties in Guangxi Province increased from 15 to 24 between 2004 and 2006, but then decreased to 15 in 2007 and three in 2010.
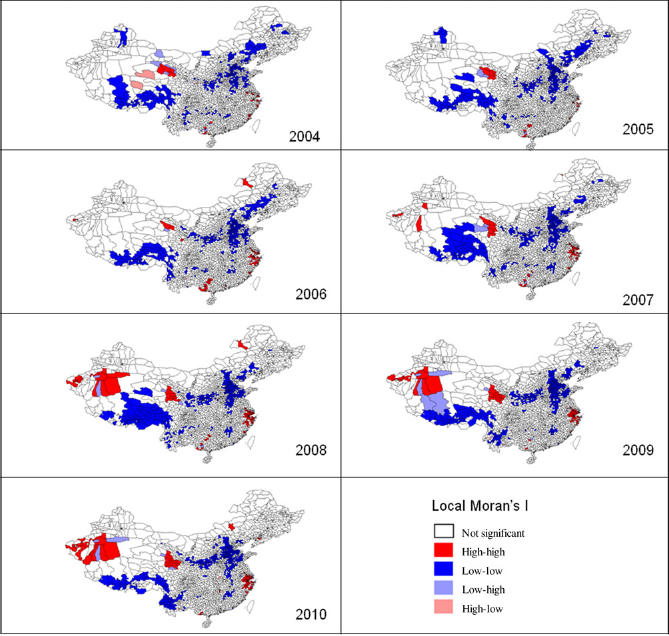
Local Moran cluster map of primary and secondary syphilis rates in China (per year), 2004-2010
The number of high-risk counties in Xinjiang Province increased from 0 in 2004 to 19 in 2010. The incidence of P&S syphilis in the province increased from 4.37 to 23.72 cases per 100,000 people during the same period. Among the 99 counties in Xinjiang Province, 26 counties had a P&S syphilis incidence of more than 30 cases per 100,000 people in 2010. The most notable change was that the incidence of P&S syphilis in Shaya County increased from 13.73 to 248.53 cases per 100,000 people between 2004 and 2010.
In Qinghai, the number of high-risk counties increased from four in 2004 to 10 in 2010. The incidence of P&S syphilis in Qinghai Province increased from 12.74 to 27.06 cases per 100,000 people between 2004 and 2010. Among the 44 counties in Qinghai Province, 16 had a P&S syphilis incidence of more than 30 cases per 100,000 people in 2010. Tianjun County had the highest P&S syphilis incidence in the province, at more than 120 cases per 100,000 people per year between 2004 and 2010. The P&S syphilis incidence of many counties in Qinghai, particularly Henan, Maqing, Tongren, Zeku and Haiyan counties, increased very quickly between 2004 and 2010. The average increase in P&S syphilis incidence in those five counties was 69.31 cases per 100,000 people.
Discussion
In this study, we explored the spatial pattern of P&S syphilis rates in mainland China from 2004 to 2010. To the best of our knowledge, this is the first study of syphilis at such a spatial resolution (county level) to use the large, nationwide database.
We found that P&S syphilis rates in mainland China were spatially dependent during the years 2004-2010. Moran I revealed significant positive global spatial autocorrelation, which persisted throughout the studied period. The number of high-risk counties increased greatly between 2004 and 2010, from 73 counties in 2004 to 134 counties in 2010. The eastern coastal cluster (Shanghai, Jiangsu, Zhejiang and Fujian provinces) persisted throughout 2004-2010. The cluster in Xinjiang Province emerged in 2006 and expanded between 2006 and 2010. The number of high-risk counties in Qinghai Province doubled between 2004 and 2010.
Several studies have suggested that more developed areas in China have greater numbers of reported syphilis cases.17,21 Similarly, our study suggests that most high-risk counties are located in relatively wealthy eastern coastal regions. However, we could not conclude that the incidence of P&S syphilis was associated with economic status, since many counties in developed provinces of China remain poor. We plan to collect county-level economic data for further analysis in a future study. In addition, some high-risk regions were found in the less developed, inland areas (such as Qinghai and Xinjiang provinces). Qinghai Province has reported a low incidence of syphilis in the past. However, the incidence of syphilis increased very quickly in recent years. Possible reasons for this phenomenon were the rapid development of tourism and the considerable increase in the migrant population in recent years, especially after the establishment of the Qinghai-Tibet Railway. 22 Further research is needed to determine whether China's syphilis clusters are associated with specific economic, social-cultural and/or environmental characteristics.
Spatial syphilis incidence variation includes two separate but complementary aspects related to the spread of syphilis: 23 regional surveillance variation (e.g. comparing reported cases among counties) and local prevalence variation within a county (e.g. comparing sex work venues with entertainment centres). Regional syphilis variation can be used as a tool to target syphilis prevention and control programmes. Several epidemiological studies in China have demonstrated a relationship between entertainment centres and STI risk. 23 There are tens of millions of entertainment centres in China. Only a few of these entertainment centres are sites of commercial sex activities; so it is neither realistic nor necessary to provide rapid syphilis tests at all the centres. Rather, by using the spatial method to detect high-risk regions, syphilis screening could be focused in areas with a higher burden of syphilis.
Furthermore, in order to develop an appropriate and comprehensive syphilis control strategy, syphilis prevalence variation within a county should also be considered in a spatial framework. The methods used in this study can be applied to finer geographic units (e.g. postal units). Smaller spatial units may provide more location-specific information that can inform the design and implementation stages of public health programmes. 10 Further research could focus on finer geographic units to identify clusters within counties with higher burdens of syphilis.
There are limitations associated with using cases reported through the CISDCP system. The reported cases might not reflect the true extent of the epidemic, since STIs treated at pharmacies and private practices go largely unreported. A study of migrant married women in Hubei province 24 found that 28.22% of patients with STIs sought initial care at a site other than a government dermatovenereology centre. An investigation of migrant construction workers in Shanghai 25 showed that 50.7% of patients sought care from private doctors or pharmacists. These studies suggest that true syphilis rates might be much higher than reported. As a result, the P&S syphilis rates found in this study, although high in some areas, were underestimates of the true rates.
Another limitation is the possibility that there are differences in syphilis case-reporting practices among regions. According to one study, 15 reporting of syphilis cases in developed southeastern areas (such as Shanghai, Zhejiang and Jiangsu provinces) was more than 80%, with nearly 100% case reporting in Shanghai city. However, the coverage in less developed inland areas (such as Qinghai, Gansu and Guizhou provinces) was less than 50%. Therefore, the need for syphilis prevention and control in inland areas should not be overlooked.
One limitation of our study is the clustering methodology. Past research suggests that using two methods for data analysis would provide stronger evidence of either clustering or lack of clustering, especially when both methodologies have unique characteristics. 26 We plan to adopt another clustering methodology, such as the Kulldorff spatial scan statistic, to analyse the same data in future research.
In conclusion, our study provides a good understanding of the spatial patterns of P&S syphilis in mainland China, and might help to determine allocation of resources to high-risk areas with the goal of reducing syphilis incidence. With the help of the spatial framework provided in our study, China's syphilis control programmes could be focused on locations where they will have the greatest impact.
Footnotes
Acknowledgements
This work was financially supported by the National Natural Science Foundation of China (grant no. 30571618) and the National Special Foundation for Health Research (grant no. 200802133).