
Abstract
This cross-sectional study aimed to compare dietary intake in people living with HIV (PLHIV) experiencing symptoms of depression with those not reporting depression. The Centre for Epidemiologic Studies Depression Scale (CES-D10) was used to classify the risk of depression. Dietary nutrient intake was determined using the diet history and food frequency questionnaire. Depressed (n = 21) compared with non-depressed (n = 37) subjects had significantly lower mean intake of fibre (16.1 versus 25.4 g/day), vitamin A (801.5 versus 1524.8 mg/day), magnesium (299.8 versus 380.0 mg/day) and folate (264.8 versus 402.9 μg/day). The proportion of subjects achieving the recommended intake of these nutrients, with the exception of folate was also found to be lower in the depressed group compared with non-depressed group. The study found that depressive symptomatology in PLHIV was associated with poorer dietary nutrient intake. A multidisciplinary model of care that includes a nutrition assessment is recommended for the management of PLHIV with depression to reduce the risk of associated nutritional problems.
Keywords
Introduction
Depression is a common co-morbidity in people living with HIV (PLHIV). The prevalence of depression in patients infected with HIV has been estimated to be as high as 37%. 1 A recent study of depression among men attending a general practice in Australia found that over 30% of HIV-positive homosexual men suffered from major depression. 2
A number of studies on depression in the general population have shown a variety of altered food habits. These have included skipping meals, lack of interest in food, poor food choices and disinterest and poor motivation in preparing and cooking balanced meals. These habits have been shown to lead to anorexia, weight loss, under nutrition and micronutrient deficiencies. 3 Alternatively, depressed patients have been reported to overeat, experience increased appetite or food cravings particularly for carbohydrate and chocolate, which can lead to weight gain. 4
Adequate nutrition is essential for PLHIV as it helps manage symptoms, reduces toxicities associated with antiretroviral therapy (ART), delays disease progression and maintains immune responses resulting in better quality of life. 5 HIV infection and its treatment have been associated with many nutritional effects. These include an increase in energy expenditure, a reduction in the amount of food consumed, anorexia, malabsorption, micronutrient status alterations and decreased dietary diversity. 6
An association of dietary intake with depression has been shown in the general population. 3 In a longitudinal analysis of participants in the Nutrition for Healthy Living Study, depression has been associated with reduced macronutrient intake among PLHIV. 7 However, there have been no studies examining the relationship between depression and both macronutrient and micronutrient intake in PLHIV. This study was undertaken to compare macronutrient and micronutrient intakes of PLHIV experiencing symptoms of depression with PLHIV who are not depressed in a cohort of patients attending an HIV ambulatory care clinic.
Method
The study group consisted of a convenience sample of 58 participants attending a large multidisciplinary, government funded, HIV ambulatory care centre in Sydney, Australia, for their routine HIV care. The study received ethical approval from the South Eastern Sydney and Illawarra Area Health Research Ethics Committee. Eligibility criteria included people over the age of 18 years with known HIV infection. Those with poor English language fluency at the time of recruitment or serious medical illness were excluded.
The usual daily eating pattern with variations was assessed using a diet history (DH). The DH involved a structured interview by a dietitian using the modified 24-hour recall form as described by Stang and Story. 8 The modification was made to the recommended servings for adults based on Australian Guide to Healthy Eating 9 and weekend variations were added to capture dietary variations. Food models were used to help estimate amounts of food usually consumed. A self-administered food frequency questionnaire (FFQ) was also completed at the same visit. 10 The FFQ used a detailed list of food items to estimate how often foods were eaten. Subjects were required to indicate how frequently they ate in the last month (rated on a five-point scale: more than once per day, once a day, two to three times a week, one to two times a month and never). The DH was cross checked with the FFQ to clarify and verify eating patterns. A three-day dietary record was then collated retrospectively and entered into FoodWorks Nutrient Analysis Software (Xyris, Version 5, Brisbane, Australia). This software was used to calculate an estimated total daily intake of each specific nutritional component using the Australian Food Composition Database (NUTTAB 95 Australian Government Nutrient Database, Canberra, Australia). The average daily energy requirements were estimated based on the Schofield equation and an extra 10% requirement was added due to HIV status. 11 The percentage of energy from macronutrients and daily micronutrient intake was compared with the current Recommended Daily Intake (RDI) values as specified by the National Health and Medical Research Council (NHRMC) guidelines. 12 Vitamins, herbs and/or other supplements were not included in the dietary analysis as data on dosage and types of supplements were not collected. However, this information was captured in the FFQ as either taking or not taking them.
Food security (FS) status was evaluated using the six-item US Household Food Security Scale (USHFSS). 13 The FS questions referred to circumstances over the 12 months preceding the survey. Subjects were asked to describe behaviours and attitudes relating to various aspects of their food insecurity experience, including household financial limitations. The scores ranged from 0 to 6. Higher scores indicate food insecurity: a score of ≤1 indicates food security; 2 to 4 indicates food insecurity without hunger and ≥5 indicates food insecurity with hunger. For the present study, the food security scale was dichotomized into food secure and food insecure.
The level of depressive symptoms over the prior week was measured with a 10-item Centre for Epidemiologic Studies Depression Scale (CES-D10). The CES-D10 uses a four-point Likert scale for each question ranging from 0 to 3. The total score for the CES-D10 ranged from 0 to 30 with higher scores representing greater depressive symptoms. A score of ≥10 on the CES-D10 indicates the presence of depression 14 and was used to classify groups (depressed versus not depressed) for the study.
Statistical Analysis
Statistical analysis was undertaken using the Statistical Package for Social Sciences (SPSS) software, Version 10 (Chicago, IL, USA). Descriptive statistics were used to describe demographics. Differences between depressed and non-depressed individuals were examined using the Mann-Whitney U test for continuous variables. The chi-squared test or Fisher's exact test where appropriate was used for categorical variables and to compare differences in proportion between groups. Spearman's correlation was used to assess the association between depression and food security. A P value of ≤0.05 was considered statistically significant for all analyses.
Results
Table 1 shows the baseline demographic characteristics of the two study groups. No differences were found between depressed and non-depressed groups except for unemployment (P = 0.031).
Demographic data for study groups
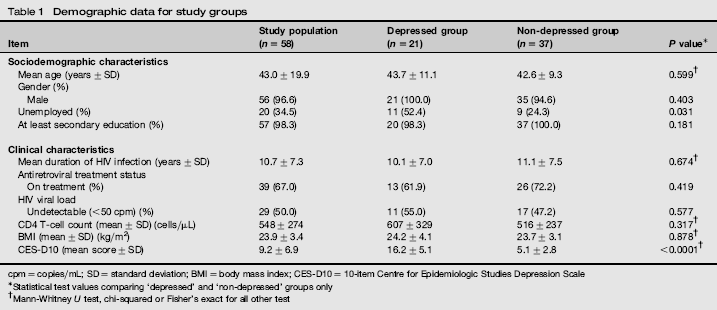
cpm = copies/mL; SD = standard deviation; BMI = body mass index; CES-D10 = 10-item Centre for Epidemiologic Studies Depression Scale
Statistical test values comparing ‘depressed’ and ‘non-depressed’ groups only
Mann-Whitney U test, chi-squared or Fisher's exact for all other test
The mean CES-D10 score in this cohort was 9.2 (SD 6.9) with a range of 0-28. The CES-D10 classified 21 (36.2%) subjects in this cohort as depressed with the mean score of 16.2 (SD 5.1).
Household FS data were available in 41 of 58 subjects. A significant positive correlation was found between the total score of the CES-D10 and the USHFSS (p = 0.588, P < 0.001). Food insecurity was found in 8/11 (72.7%) of the subjects in the depressed group compared with only 5/30 (16.7%) in the non-depressed group (χ2 = 11.682, P < 0.001). Nutrient intakes of the subjects in the depressed and non-depressed subjects are shown in Table 2.
Daily dietary intake comparison in depressed (n = 21) and non-depressed (n = 37) subjects
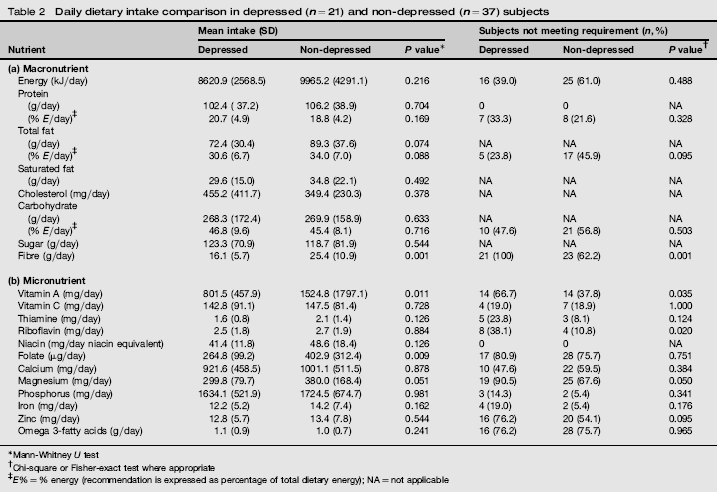
Mann-Whitney U test
Chi-square or Fisher-exact test where appropriate
E% = % energy (recommendation is expressed as percentage of total dietary energy); NA = not applicable
Macronutrients analysis
Of the macronutrients, depressed subjects had significantly lower fibre intake. Comparison between the groups found depressed subjects were more likely to have inadequate fibre intake (P = 0.001) (Table 2(a)). All 21 (100%) subjects in the depressed group did not meet the RDI. In contrast, 62.2% (23/37) of non-depressed subjects did not reach the RDI for fibre (χ2 = 7.644, P = 0.001). All subjects, both depressed and non-depressed, met the daily intake for protein (Table 2(a)). No differences between depressed and non-depressed groups were found with the other macronutrients (Table 2(a)).
Micronutrients analysis
Of the 12 micronutrients studied, the mean vitamin A, magnesium and folate intakes were significantly lower in depressed subjects (Table 2b). The mean difference in vitamin A intake between depressed and non-depressed subjects was -720.3 mg/day (P = 0.011). Vitamin A intake below the RDI was found in two-thirds (14/21) of depressed subjects, whereas only a third (14/37) of non-depressed subjects failed to meet the RDI for vitamin A (χ2 = 4.46, P = 0.035). The mean intake of magnesium in the depressed group was lower than in the non-depressed group (-80.2 mg, P = 0.051). Over 90% (19/21) of depressed subjects did not meet daily requirements, while 67% (25/37) in the non-depressed group fell short of the RDI for magnesium (χ2 = 3.84, P = 0.050). Likewise, the proportion of subjects not meeting the RDI for riboflavin was significantly greater in depressed subjects compared with non-depressed subjects (38% versus 11%, χ2 = 6.078, P = 0.020), but the mean value did not differ significantly. The mean difference in folate intake was lower in depressed subjects compared with non-depressed subjects (-156.1 μg/day, P = 0.009). However, no difference was found in the proportion of subjects not meeting daily requirements between groups (80% versus 76%). No differences between groups were found with the remaining micronutrients.
The FFQ found that the vitamin and/or herbal supplement intake varied significantly between depressed 10/21 (47.6%) and non-depressed 28/37 (75.7%) subjects (χ2 = 4.668, P = 0.031).
Discussion
The study describes differences in dietary intakes between PLHIV experiencing symptoms of depression and those not experiencing depression in a convenience sample of patients attending an outpatient HIV clinic in Sydney. Nutritional deficiencies were found in subjects with depressed symptoms. It has long been recognized that poor nutritional status impairs immune response and is associated with disease progression, increased morbidity and mortality. 15 Despite effective ART, poor nutritional status in PLHIV remains a common problem.
Few studies have investigated associations between macro-nutrient intake and depression. The finding of reduced fibre intake in the present study is similar to that of a previous longitudinal study in PLHIV. 7 Consumption of a diet that is high in fruits, vegetables and fish have been found to be protective against the onset of depressive symptoms, whereas a diet rich in processed food, meat, chocolate, sweet desserts, fried food, refined cereals and high-fat dairy products seems to be detrimental for depression. 16
Altered levels of micronutrients have been documented early in the disease process. Deficiencies in vitamins A, B, C, D and E and the minerals selenium and zinc have been associated with higher risks of HIV disease progression.15,17 The results of our study demonstrate that vitamin A and magnesium intake were significantly lower in subjects with depressive symptoms. Woo et al. 18 reported that dietary intake of vitamin A, riboflavin, fibre and vegetables was inversely associated with depression score in community-dwelling elderly. Similarly, another study found that low levels of antioxidant vitamins and carotenoid intake was reported to be associated with a history of attempted suicide. 19 Dietary antioxidants (including vitamin A) have been studied for their ability to protect against chronic disease associated with free radical damage. 20 Deficiency of beta carotene, a carotenoid with antioxidant activity, may impair the immunomodulatory effects needed to prevent oxidative damage during infection. 21 Vitamin A deficiency is common in HIV infection and has also been associated with mortality. 17
Magnesium is an essential mineral involved in many enzymatic reactions including antibody synthesis and T-cell function. 22 While not all investigations of micronutrient status in PLHIV have found low serum magnesium, low levels of magnesium have been reported in HIV-infected patients. 23 It has been suggested that low magnesium may account for some of the symptoms experienced by PLHIV including fatigue and lethargy. 24 The finding of significantly lower fibre intake in the depressed group in our study may have contributed to the lower magnesium intake in this group. Dietary magnesium can be widely obtained from a variety of unrefined foods including cereals, green vegetables, legumes, fruits and animal products.
An association between low levels of several B vitamins, including riboflavin and folate, and depressive symptoms has been suggested. 18 Riboflavin is available in most foods although the best sources are dairy products, eggs, yeast extracts and fortified breakfast cereals. The mean riboflavin intake in the present study was almost twice the RDI in both depressed and non-depressed subjects. The recommended riboflavin intake for adults in Australia is 1.3 mg for men and 1.1 mg for women. 12 However, we also found that there was a significantly higher proportion of depressed subjects not meeting the RDI for riboflavin compared with non-depressed subjects.
Of particular note, the present study also found a high proportion of subjects in both groups did not meet their RDI for folate suggesting that this cohort had inadequate folate intake from food sources (breakfast cereals, orange juice and leafy vegetables were main sources). 25 The relationship between dietary folate and depression has been well documented. 26 It has been suggested that a deficiency of folate may increase the risk of depression and result in the accumulation of homocysteine. In line with this, low folate status was also associated with a poor response to antidepressants and has been linked with longer depressive episodes. 27
The study found an association between non-depressed subjects and the use of vitamin and/or herbal supplements. The significance of the finding is unclear, but it is possible that non-depressed subjects in this cohort may have been taken a greater interest in their health and had more disposable income to purchase supplements. There have been other studies which have shown the benefits of vitamin supplementation in depression,3,28,29 although this finding requires further investigation in PLHIV.
The two groups were similar with respect to basic characteristics, except for employment status and household food insecurity. Our study population is similar to the HIV population in Australia which is predominantly male (92.4%) with a mean age of 48.0 years. 30 The depressed group were more than twice as likely to be unemployed which may have confounded to the findings of poorer diet among the depressed subjects. The likelihood of being food insecure has been reported to increase dramatically as income adequacy deteriorates. 31 Insufficient quality and quantity of food can lead to both macronutrient and micronutrient deficiencies, which can affect HIV acquisition and health outcomes among PLHIV. 32 Household food insecurity is significantly related to poorer health status across multiple dimensions of health including physical, mental and social health. 31 Food insufficiency and lower income has been linked to depressive symptoms in HIV-infected crack cocaine users. 33 Accordingly, in our cohort, we found an association between food insecurity and higher depressive symptomatology.
This study has shown an association between depression and the reduced dietary intake of fibre and selected micronutrients. However, the study also suggests a complex interaction between unemployment, increased food insecurity, depression and decreased use of vitamin supplements. It is possible that unemployment and poverty may play an important role in dietary changes. In addition to lower dietary intake, the lower frequency in use of vitamin supplements by depressed subjects may further reduce micronutrient serum levels in this population.
We acknowledge that the present study has several limitations. The relatively small sample size of patients and the use of convenience sampling may limit generalizability of the findings. Depression was classified using the CES-D10 and not the Diagnostic and Statistical Manual of Mental Disorders, Fourth Edition (DSM-IV) due to resource allocation and funding limitations. Nevertheless, the CES-D10 has been validated against the DSM-IV.34,35 Dietary data were also collected by self-report, and may therefore have a recall bias in dietary intake as inaccurate estimation of portion size can be a major source of error. However, food model replicas were used to aid subjects to estimate portion size, which may have reduced the recall bias. A combination of two dietary methods was also used, allowing for the collection of information about the typical food consumed, as well as the exploration of broad dietary patterns and intake of specific foods or groups of foods. A further limitation of the food composition nutrition database is that it is not comprehensive. The best possible match was used as a substitute when the exact food could not be located in the database. Low vitamin D levels have been associated with depression; 36 however, this was not measured in the present study as FoodWorks Version 5 did not have the feature to calculate vitamin D levels. Finally, while we identified micronutrient intake deficiencies in subjects with depressive symptoms we did not measure serum micronutrient concentrations in this study. Further studies that include such measurements would be valuable.
In conclusion, we found that depressed subjects consumed a diet of lower nutritional value, resulting in fibre, vitamin A, magnesium and folate intakes below recommended levels. PLHIV with depression are at higher risk of nutrition-related problems. Practitioners need to be aware of nutritional deficiencies and should refer PLHIV with depression for nutrition assessment as part of standard HIV care and treatment. Dietary counselling in PLHIV with depressive symptomatology should include a food security assessment.
Footnotes
Acknowledgements
The authors would like to thank Aaron Di Guilmi and Jessica Young for their contribution to the study, and Katherine Coote for reviewing the manuscript. The authors would also like to thank the clients and the clinical staff of the Albion Centre for their participation in and their support of this study.