




Abstract
Objectives
To investigate the effect of increasing alcohol consumption on the number of admissions to adult, general critical/intensive care units (ICUs) in England and Wales with alcoholic liver disease, their case mix, mortality, and impact on critical care and hospital activity by extrapolating from admissions to ICUs over the last 10 years.
Methods
Secondary analysis of a high quality clinical database from a national clinical audit using data from 385,429 admissions to174 ICUs in England and Wales between December 1995 and July 2005, of which 4219 (1.1%) had alcoholic liver disease. The extrapolated total number of admissions with alcoholic liver disease and total number of ICU bed-days occupied were calculated. Changes over time in the case mix (age, sex and APACHE II and ICNARC risk prediction models), mortality at ultimate discharge from acute hospital, and length of stay in ICU and in hospital were explored.
Results
The percentage of ICU admissions with alcoholic liver disease increased from 0.65% in 1996 to 1.35% in 2005, but the case mix remained similar. Mortality decreased and length of stay increased over this period. The extrapolated total number of admissions to all 229 adult, general critical care units in England and Wales increased from 550 in 1996 to 1513 in 2005, and the extrapolated total number of bed-days occupied by these admissions increased from around 3100 to over 10,000.
Conclusions
Admissions to ICUs in England and Wales with alcoholic liver disease tripled over the 10-year period from 1996 to 2005. The continuing increase in alcohol consumption means that this trend is likely to continue.
Introduction
Data from the Centre for Social Research on Alcohol & Drugs indicate that around 4% of the global burden of disease is attributable to alcohol consumption. 1 Alcohol consumption in the UK has increased steadily since the late 1950s 2 and this rise is reflected in markers of alcohol-related ill health. While the average mortality for liver cirrhosis across Europe as a whole has declined since the 1970s, the rate in the UK has continued to increase.3,4
The Royal Society for the encouragement of Arts, Manufactures and Commerce's Commission on Illegal Drugs Communities and Public Policy has recently developed a score to measure the amount of harm caused by drugs, all drugs that could be misused investigated. 5 They determined that alcohol was the fifth most harmful drug and the most harmful unclassified drug.
In June 2006, the Information Centre for Health and Social Care published statistics on alcohol-related admissions to NHS hospitals in England. 6 The total number of alcohol-related admissions increased from around 100,000 in 1995-1996 to over 180,000 in 2004-2005 and the number of these that were associated with alcoholic liver disease increased from 14,000 to 35,000. While alcoholic liver disease represents a relatively small (<20%), but increasing, proportion of admissions relative to alcohol-related, mental and behavioural disorders, 6 these admissions are particularly resource-intensive in terms of the interventions delivered and use of critical care services. 7
Most published studies regarding alcohol-related admissions to critical care are single centre audits related to alcohol abuse of any kind.8-10 Numbers in general are small and the criteria for definition of significant alcohol exposure vary. No attempt has previously been made to quantify the number of admissions to critical care units with alcoholic liver disease on a national level.
We sought to quantify the impact on critical care services in England and Wales of admissions with alcoholic liver disease by extrapolating the total number of admissions to critical care units in England and Wales with alcoholic liver disease over the last 10 years from data in a large, high quality, clinical database to discover if there was any increase.
Methods
Case Mix Programme database
The Case Mix Programme (CMP) is the national, comparative audit of adult, general critical care units (intensive care units and combined intensive care and high dependency units - referred to as ICUs, throughout) in England, Wales and Northern Ireland. This is a voluntary programme, where case mix (age, sex, acute severity, surgical status and reason for admission) and outcome data are collected on consecutive admissions to ICU. Approximately 75% of units participate in the CMP, providing highly representative data. Following extensive local and central validation, data are pooled into the Case Mix Programme Database (CMPD). Data were extracted from the CMPD, covering the period December 1995 to July 2005. Details of the data collected and the validation process have been reported previously 11 and have been independently assessed to be of high quality (www.docdat.org). Support for the collection and use of patient-identifiable data without consent in the CMP has been obtained under Section 60 of the Health and Social Care Act 2001 (approval number PIAG 2-10(f)/2005).
Selection of units
All participating ICUs from England and Wales were used in the analysis. It was not possible to obtain population figures for Northern Ireland, so these were excluded.
Selection of cases
Reasons for admission to ICU are recorded in the CMPD using the Intensive Care National Audit & Research Centre (ICNARC) Coding Method - a tiered hierarchical coding for reason for admission to ICU developed and validated specifically for this purpose. 12 All admissions have at least a primary reason for admission recorded and may, optionally, have other secondary reasons recorded. Admissions were identified as having alcoholic liver disease if they had ‘alcoholic cirrhosis’ or ‘alcoholic hepatitis’ recorded as the primary or secondary reasons for admission.
Data
Data relating to case mix, outcome and activity were extracted and variables derived as defined below.
Case mix
Age and sex were extracted. Acute severity of illness was measured by the Acute Physiology And Chronic Health Evaluation (APACHE) II score 13 and the ICNARC physiology score. 14 Both scores encompass weightings for acute physiology defined by derangement from the normal range for a number of physiological variables in the first 24 hours following admission to ICU. APACHE II has additional weightings for age and for a past medical history of specified, serious co-morbid conditions.
Outcome
Survival data were extracted at discharge from ICU and at ultimate discharge from acute hospital.
Activity
Length of stay in ICU was calculated in fraction of days from the dates and times of admission and discharge. Length of stay in hospital was calculated in days from the dates of original admission to ultimate acute hospital discharge. Re-admissions to ICU within the same acute hospital stay, confirmed by the ICUs, were also identified.
Analyses
A statistical analysis plan was agreed a priori. The analyses performed were as follows.
Summary statistics
The case mix, outcome and activity of admissions with alcoholic liver disease were summarized for each year from 1996 to 2005.
Extrapolations
The estimate for the total number of admissions with alcoholic liver disease to ICUs in England and Wales in a given year was obtained by calculating the rate of admissions per year (number of observed admissions divided by proportion of the year for which data were collected) for each unit, averaging over the units, and multiplying by the total number of adult, general critical care units in England and Wales. This figure was obtained by hand-searching the Directory of Critical Care 15 to give 229 units (213 in England and 16 in Wales).
The extrapolated numbers of admissions do not include those in specialist units, as specialist units, including liver units, do not participate in the Case Mix Programme whose remit is adult, general ICUs. Department of Health data for January 2007 indicate four units with a total of 26 specialist liver critical care beds (15 Level 3, 11 Level 2) in England 16 accounting for 0.8% of adult critical care beds.
Confidence limits were placed on the number of admissions using a bootstrapping procedure. Bootstrap samples (n = 10,000) were taken at the unit level from all units with admissions in the given year. For units without a complete year's data, a parametric Bayesian approach was used to estimate the number of admissions during the missing period. The number of missing admissions was drawn from a Poisson distribution, with the rate parameter sampled in turn from a Chi-squared distribution derived as the posterior distribution corresponding to a non-informative gamma prior.
The extrapolated total number of ICU bed-days occupied by admissions with alcoholic liver disease was calculated by multiplying the extrapolated number of admissions for each year by the mean length of stay in ICU for that year.
Extrapolations were compared to the total population of England and Wales, obtained from the Office for National Statistics.
All analyses were performed using Stata 9.2 (StataCorp LP, College Station, Texas).
Results
Data were extracted from the CMPD for 385,429 admissions to 174 ICUs in England and Wales. The number of ICUs participating and contributing data each year to the CMPD increased over the 10-year period (Table 1). At the time of analysis some data for 2004 and 2005 were still being validated and were therefore excluded. Overall, 174 different ICUs had contributed data at some point.
Case mix of admissions to ICUs in England and Wales with alcoholic liver disease, 1996-2005

APACHE, Acute Physiology and Chronic Health Evaluation; ICNARC, Intensive Care National Audit & Research Centre; ICU, intensive care unit; SD, standard deviation
Percentage of all admissions in the Case Mix Programme Database in that year
In total, 4219 admissions with alcoholic liver disease were identified, representing 1.1% of all ICU admissions in the database. The percentage of admissions with alcoholic liver disease increased steadily from 0.65% in 1996 to 1.35% in 2005. However the age, sex distribution and acute severity of illness for these admissions remained similar (Table 1). Mortality, both in the ICU and in acute hospital, reduced over the 10-year period, but the median length of stay in both the ICU and acute hospital increased (Table 2).
Outcome and activity for admissions to ICUs in England and Wales with alcoholic liver disease, 1996-2005
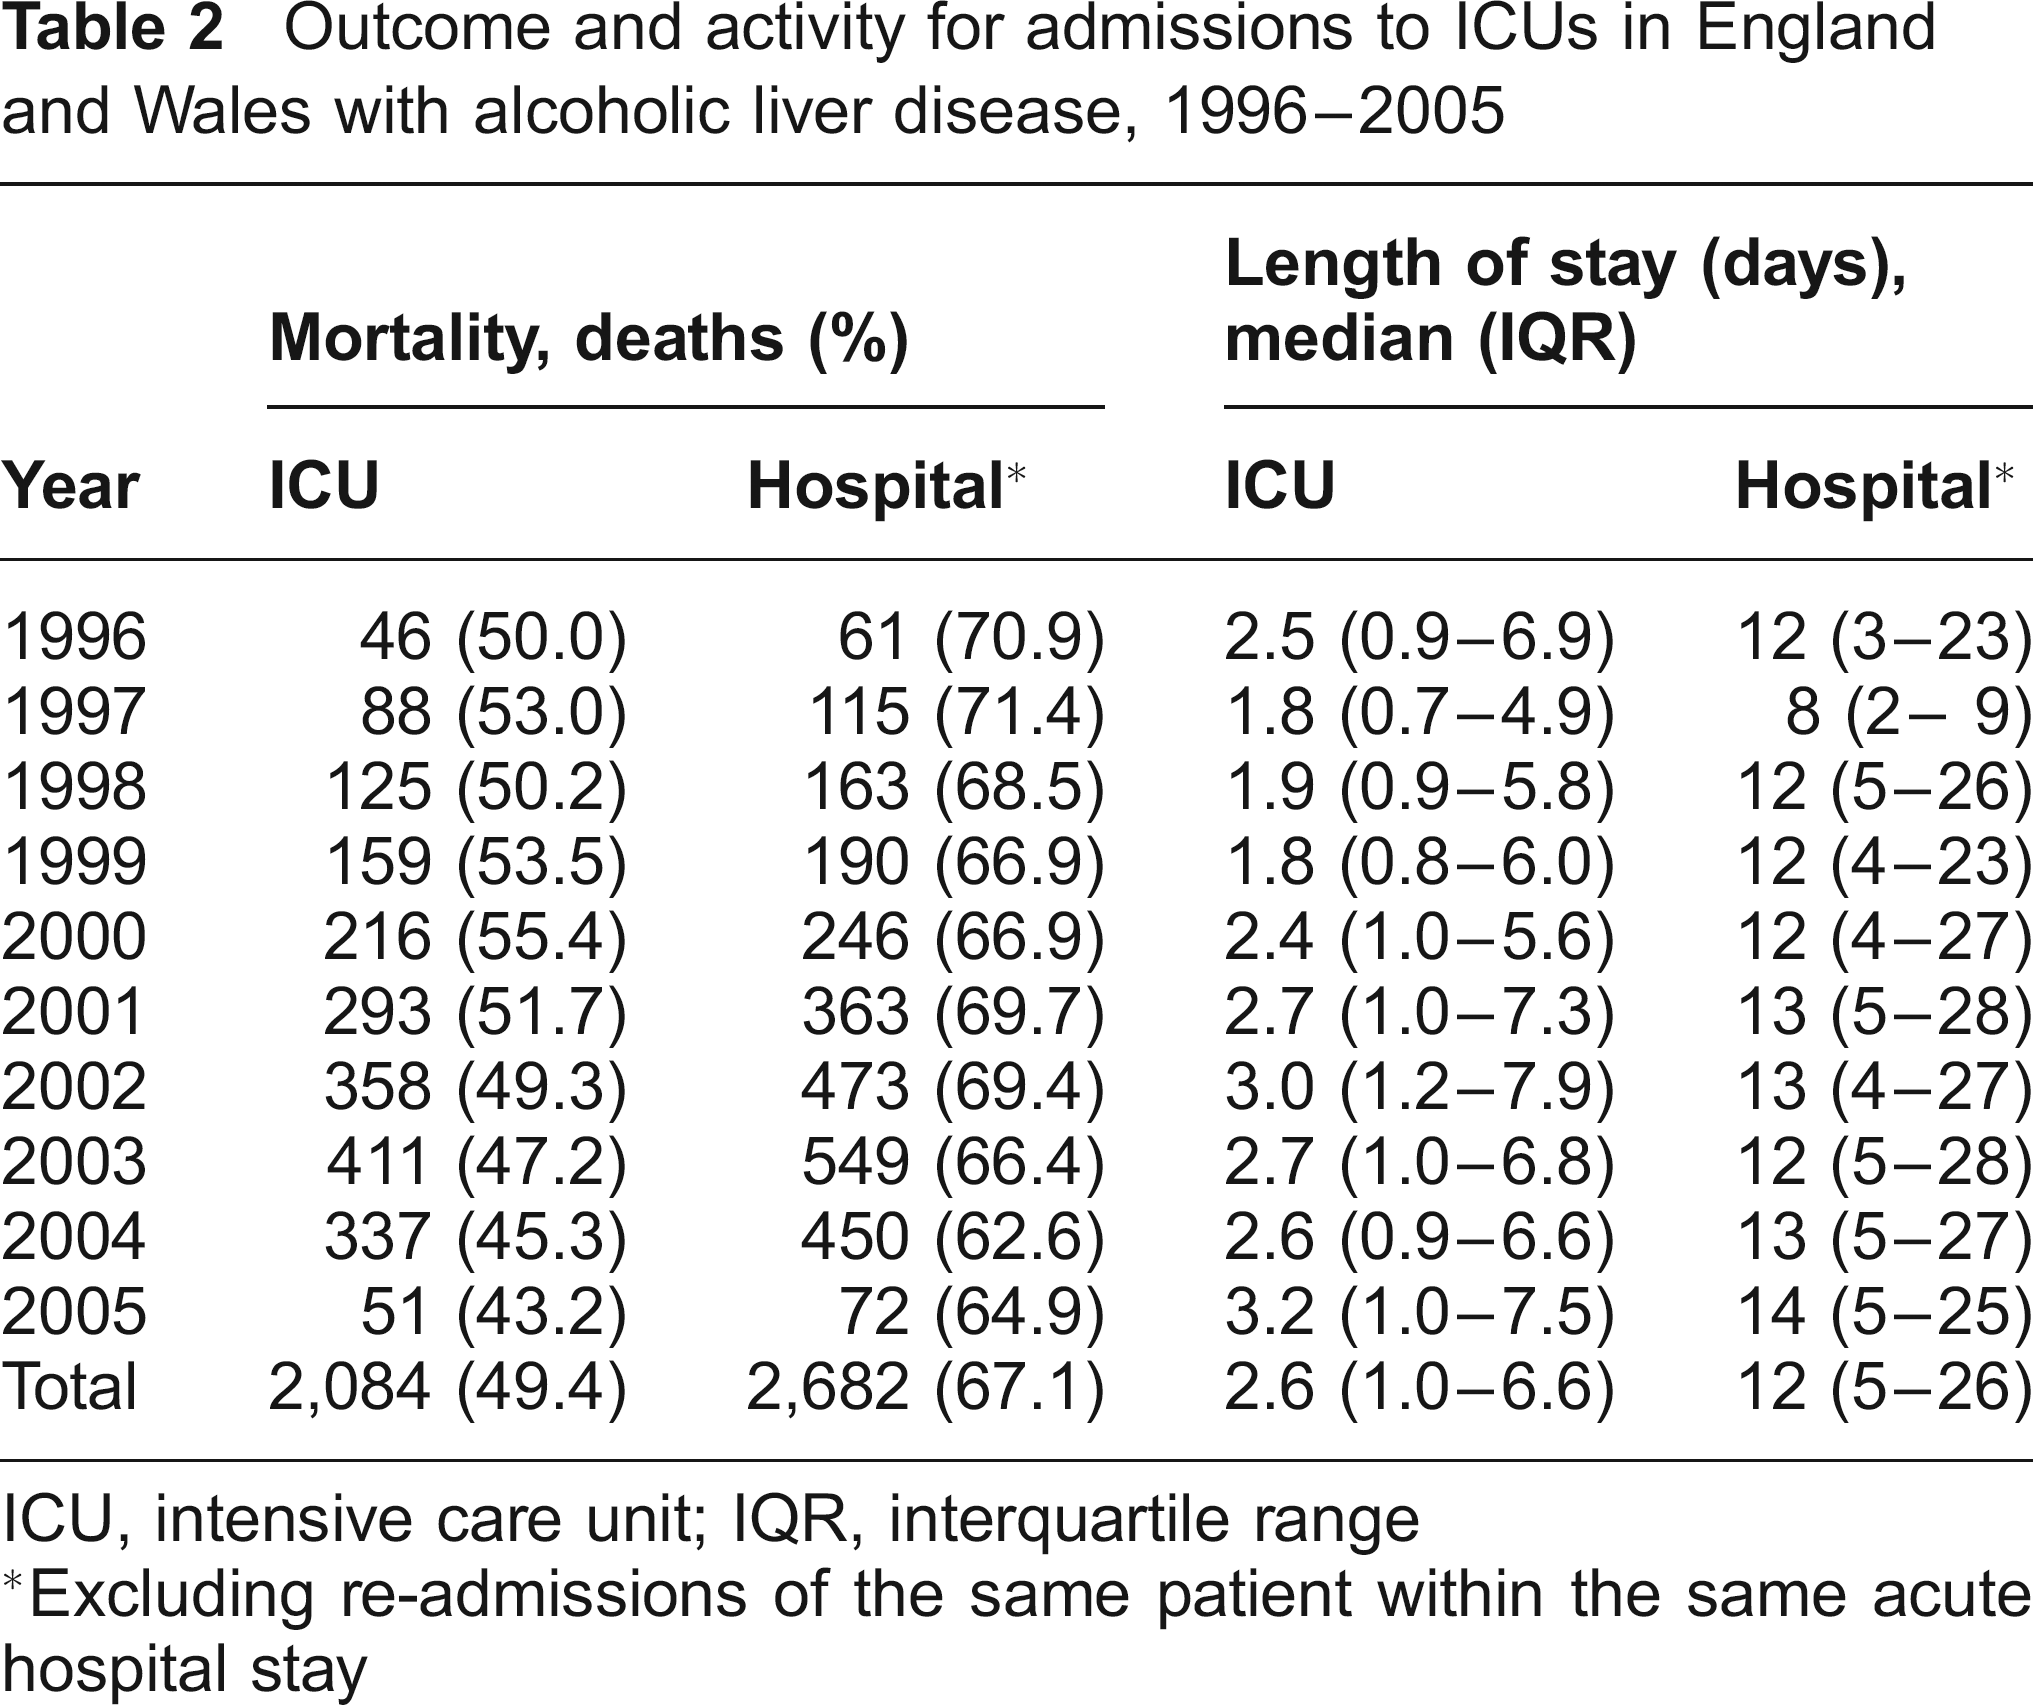
ICU, intensive care unit; IQR, interquartile range
Excluding re-admissions of the same patient within the same acute hospital stay
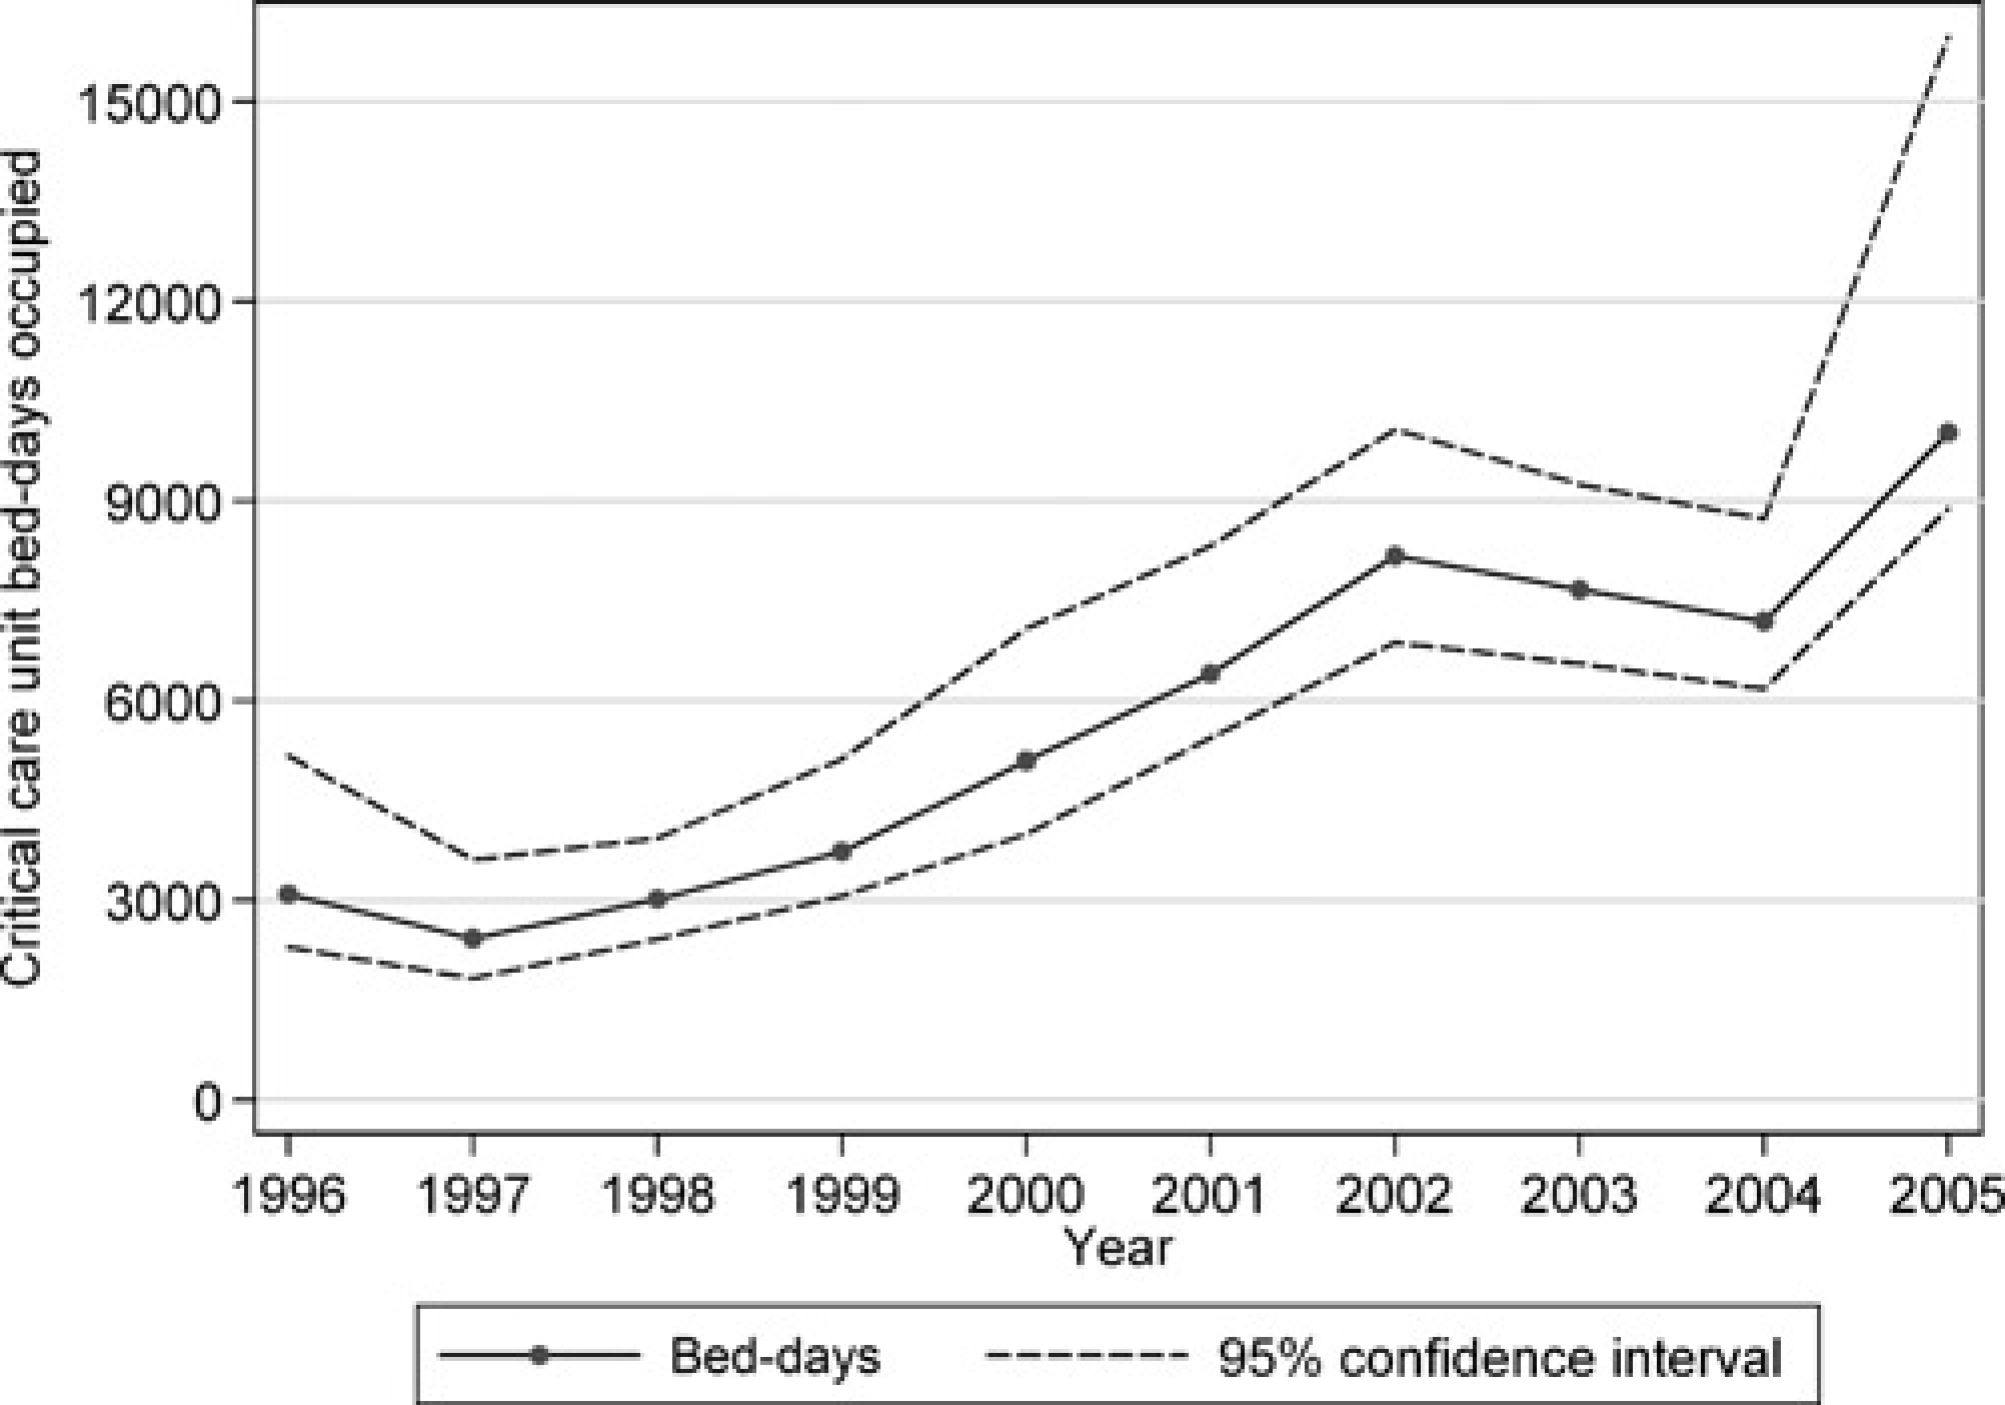
The extrapolated total number of admissions with alcoholic liver disease to all ICUs in England and Wales increased from 550 in 1996 to 1513 in 2005 (Figure 1) and the total ICU bed-days used by these admissions increased from around 3100 to over 10,000 (Figure 2). At an average cost of £1470 for an ICU bed-day (NHS Reference Costs 2005 17 ), this is equivalent to an annual expenditure of £14.7 million.
Extrapolated total numbers of admissions to ICUs in England and Wales with alcoholic liver disease, 1996-2005 Extrapolated total number of ICU bed-days in England and Wales occupied by admissions with alcoholic liver disease, 1996-2005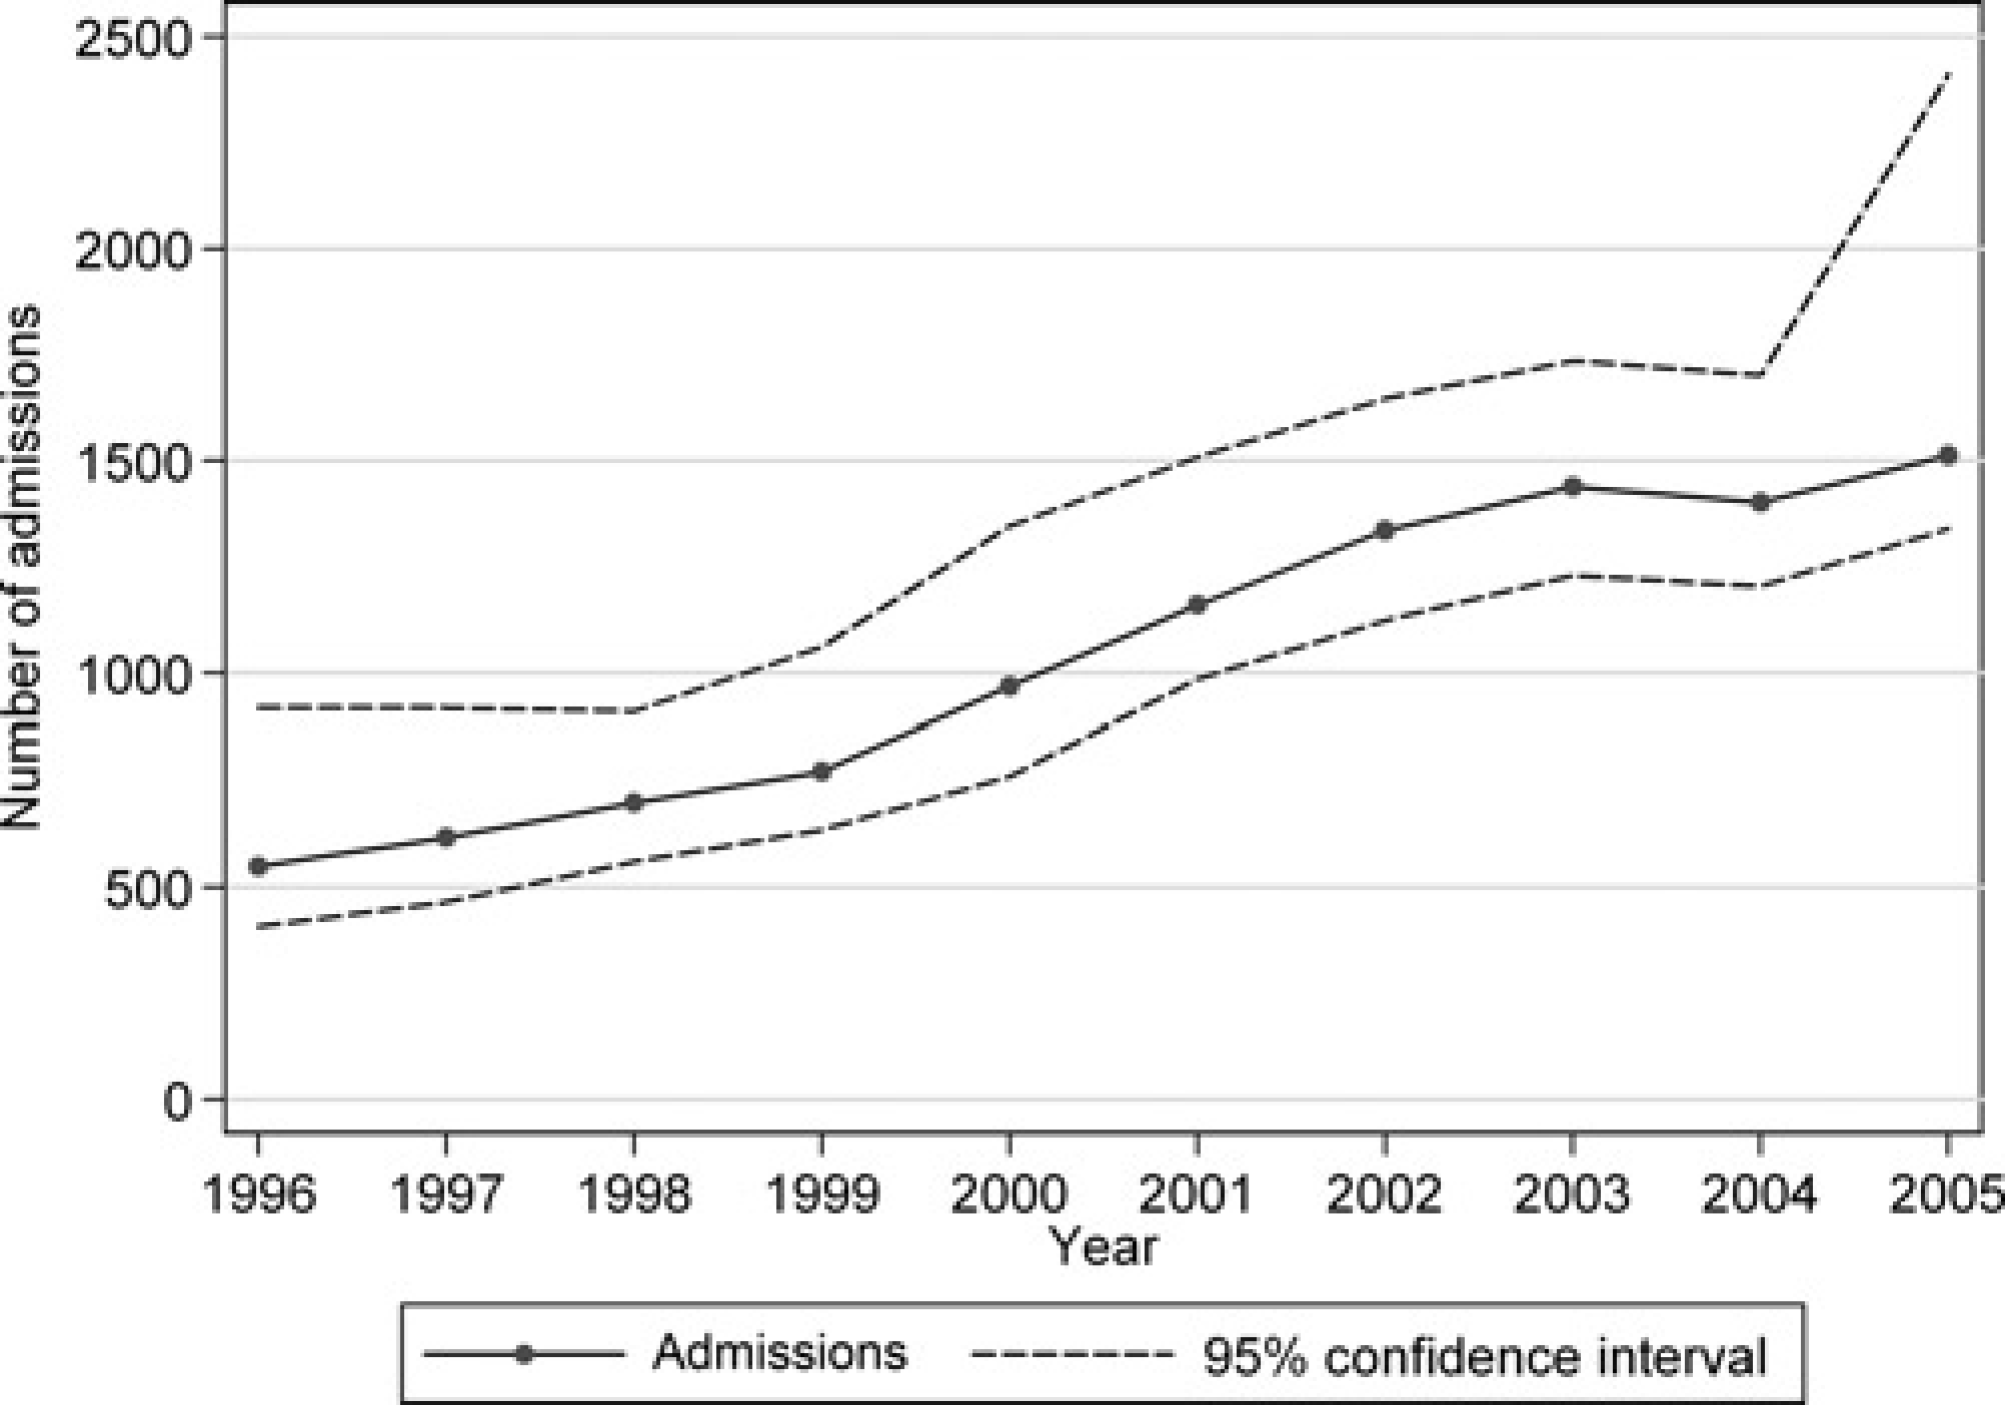
The population incidence of ICU admission with alcoholic liver disease in England and Wales increased from 1.0 per 100,000 in 1996 to 2.6 per 100,000 in 2004 (Figure 3).
Extrapolated numbers of admissions to ICUs in England and Wales with alcoholic liver disease per 100,000 population, 1996-2004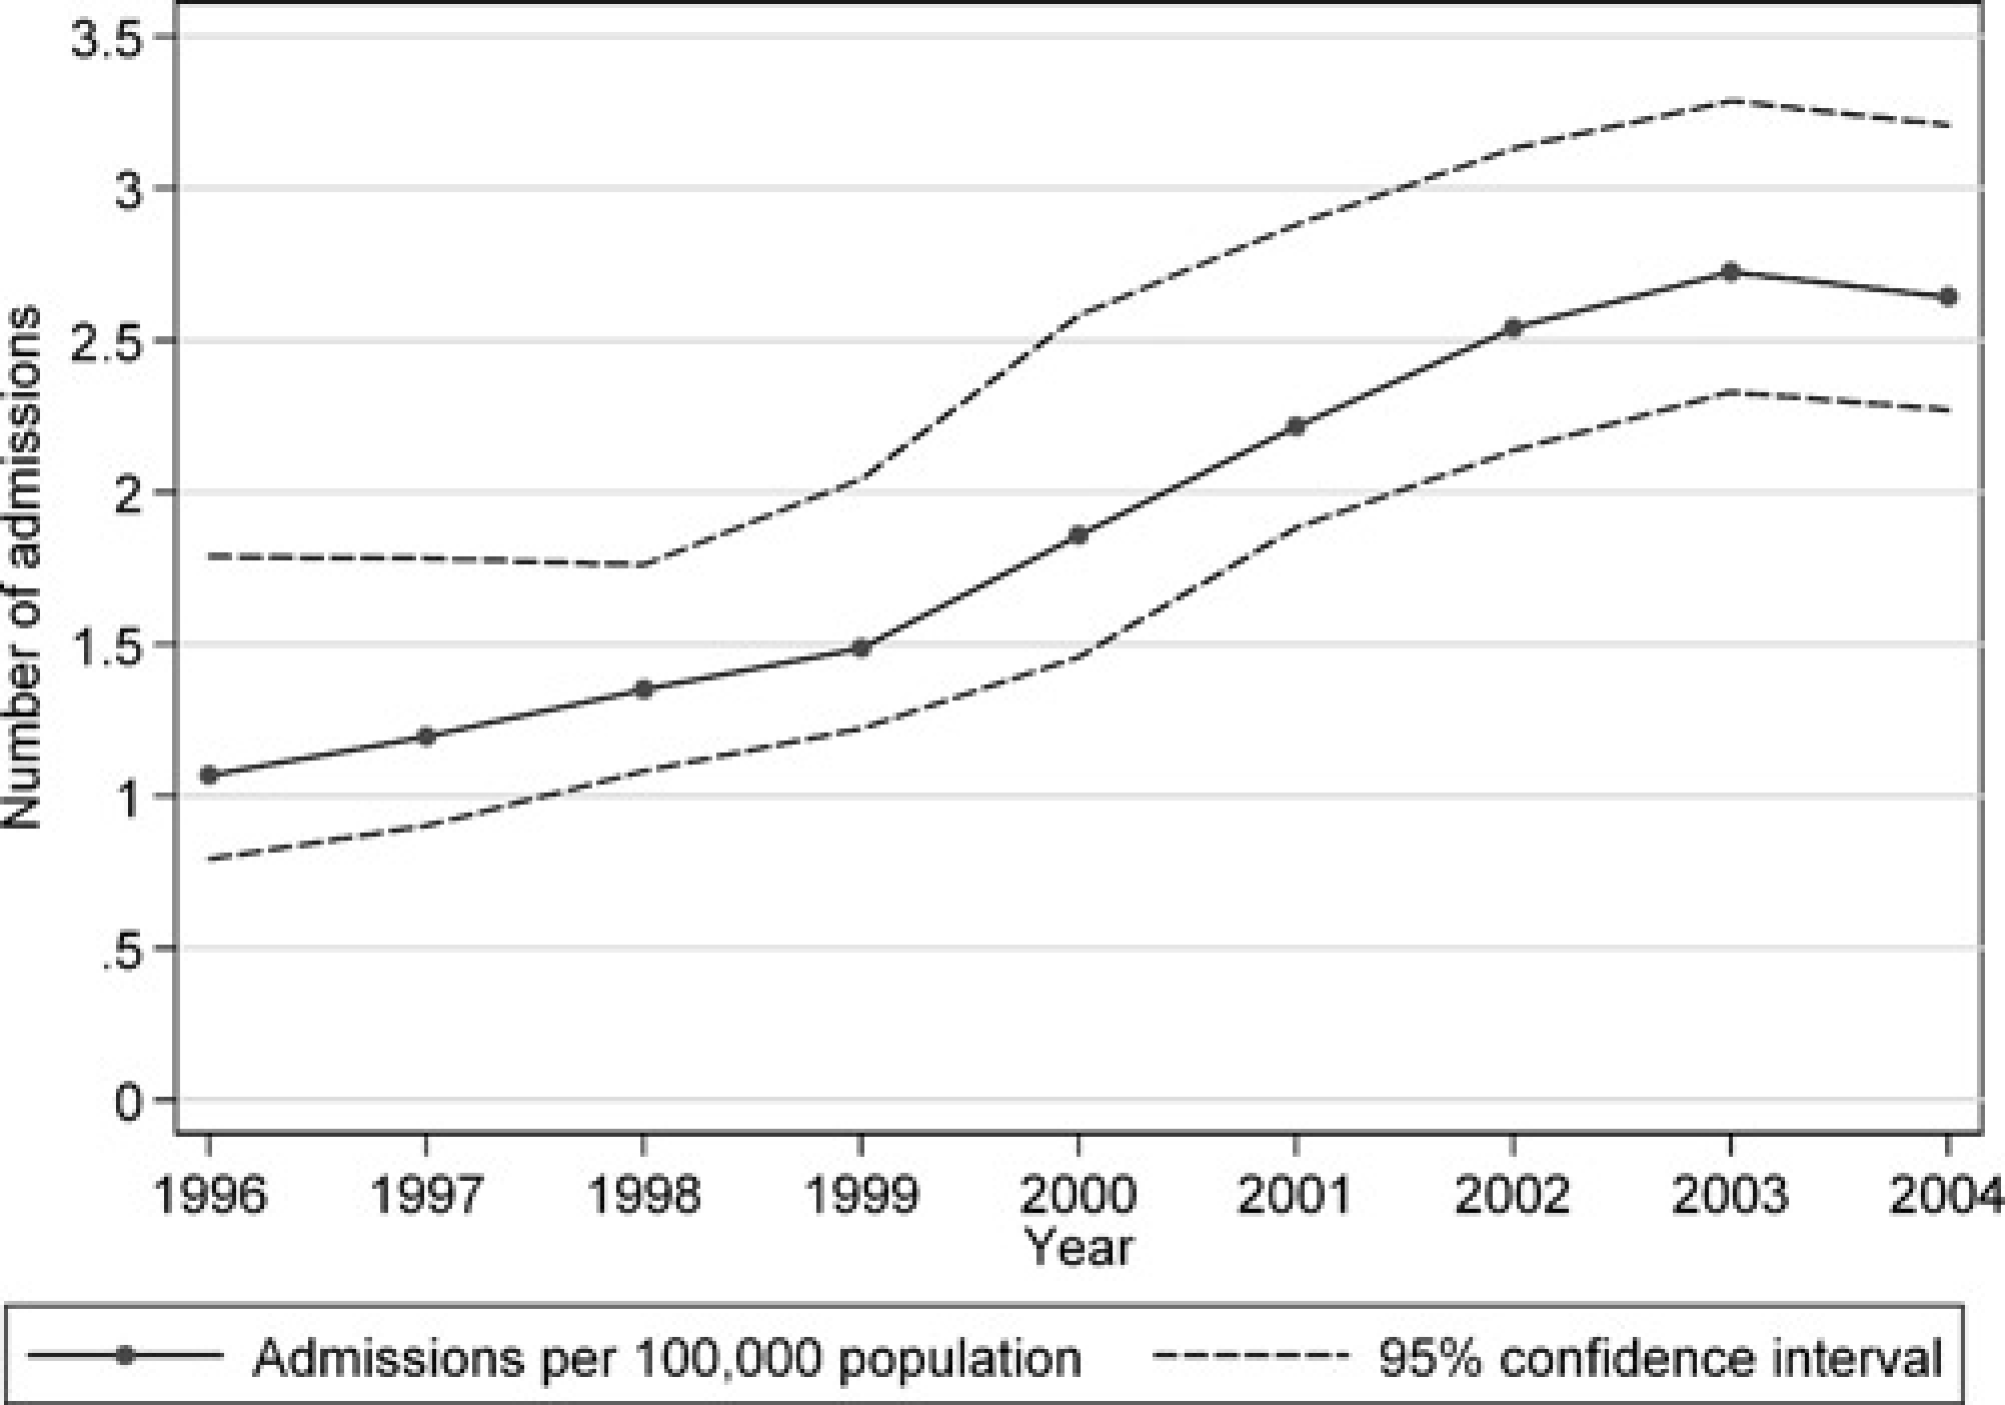
Discussion
The number of admissions to ICU with alcoholic liver disease has increased steadily and tripled over the 10-year period from 1996 to 2005. Mortality for these admissions has decreased despite similar case mix, yet both ICU and acute hospital stay has increased. Estimates based on NHS Reference Costs indicate that current ICU bed-days for admissions with alcoholic liver disease cost £14.7 million per annum.
This study included a large and representative proportion (75%) of ICUs in England and Wales. To account for the proportion of units not included, extrapolated numbers were estimated and were presented with confidence intervals to quantify the uncertainty. Our assumption was that participating units were representative of all units; this assumption is realistic as participating units have been found to be representative in terms of comparators including status of hospital, geographical location of hospital and size of unit. 11
The numbers of admissions with alcoholic liver disease in the CMPD are potentially under-reported as not every admission with alcoholic liver disease will necessarily have this recorded as a primary or secondary reason for admission. It is likely that our results reflect patients admitted with a major acute complication of alcoholic liver disease, and so the true burden on critical care may be even higher. In addition, some reasons for admission may be misclassified, for example, as ‘chronic cirrhosis cause not defined’, but this condition accounts for less than 0.1% of all admissions to ICUs in the CMPD so it seems unlikely that this would have a significant effect on these results. Alcoholic liver disease represents only one aspect of the impact of alcohol on critical care resources; other alcohol-related admissions, for example alcoholic pancreatitis and alcohol-related trauma, exist but are not reliably identifiable in the CMPD.
The burden, in terms of resources, was measured in terms of ICU bed-days and based on NHS reference costs. Individual patient-based costing of ICU stays using treatment data was not possible as these data are not available in the CMPD.
Figures from the Office for National Statistics indicate that the total number of deaths in England and Wales from alcoholic liver disease increased from 2838 in 1999 to 4037 in 2004, a 42% increase in deaths. Over the same period, our extrapolations suggest that the number of ICU admissions with alcoholic liver disease increased from 773 to 1402, an 81% increase in ICU admissions. The increase in ICU admissions with alcoholic liver disease may be due in part to increased critical care capacity, as the number of beds has increased, creating more space to admit more people with alcoholic liver disease. However, if this were the case, we would expect to see changes in the case mix of admissions - as extra admissions are likely to be less sick than the ones that would have been admitted if there was less capacity, changing the overall case mix of these admissions but this did not occur. The most likely explanation is a genuine increase in the underlying prevalence of alcoholic liver disease and this is consistent with the increasing consumption of alcohol, 2 increasing total hospital admissions with alcoholic liver disease 6 and increasing mortality from cirrhosis. 4
While the rapid rise in the number of admissions with alcoholic liver disease is of significant concern, the apparent improvement in outcomes for these admissions is more reassuring. Further research, however, on long-term outcome and health-related quality of life is required to truly interpret these short-term improvements. In addition, better understanding of changes in treatment and management of these admissions, including evidence for the effectiveness of specific interventions, is also required.
Due to the time delay between consumption of alcohol and onset of chronic disease, 7 and the continuing increase in alcohol consumption, 2 we can expect the trend of increasing admissions to ICU with alcoholic liver disease to continue unless there are considerable changes in attitudes towards alcohol. The Department of Health has developed a new policy with the aim of reducing alcohol consumption in Great Britain. The Department aims to achieve this by enforcing laws and licensing powers, reducing alcohol consumption in drinkers that are causing most harm to themselves and creating an environment that promotes sensible drinking. However, in other countries that have reduced the harm caused by alcohol, it has still taken 10 years or more for there to be lower levels of liver cirrhosis.
Further research is needed to provide complete estimates of the size of the problem and the likely increase in resource consumption in all aspects of health care provision, both primary and secondary, as a consequence of the ever increasing rise in alcohol consumption.
