
Abstract
Objectives:
To contribute to current policy debates regarding the devolution of commissioning responsibilities to locally-based consortia of general practices in England by assessing the potential magnitude and significance of budgetary risk for commissioning units of different sizes.
Methods:
Predictive distributions of practice-level mental health care resource needs (used by the Department of Health to set ‘fair-share’ practice budgets) are aggregated to a range of hypothetical, but spatially-contiguous, consortia serving populations of up to 400,000 patients. The resulting joint distributions describe the extent to which the legitimate mental health needs of consortia populations are likely to vary. Budgetary risk is calculated as the likelihood that a consortia's resource needs will, in any given year, exceed its allocation (taken as the mean of its predictive distribution) by more than 1%, 3%, 5% or 10%. The relationship between population size and budgetary risk is then explored.
Results:
If between 500 and 600 consortia are created in England (serving 87,000 to 104,000 patients) then, in order to meet the legitimate mental health needs of their patients, each year around 15 to 26 consortia will overspend by at least 5%, and one or two by at least 10%. The budgetary risk faced by consortia serving smaller/larger populations can be read off the graphs provided.
Conclusions:
Unless steps are taken to mitigate budgetary risk, the devolution of decision-making and introduction of fixed budgets is likely to result in significant financial instability. It will be difficult to reconcile the policy objectives of devolved commissioning, best met through relatively small and fully accountable consortia, with the need for financial stability, which is best met by pooling risk across larger populations.
Introduction
As in other health care systems such as the USA, Australia and New Zealand, government reform of the National Health Service (NHS) in England has sought to bring about more effective clinical engagement in health care management. 1 This is predicated on the belief (supported by some but not extensive evidence)2,3 that this will result in improvements in service quality, patient experience and clinical outcomes, as well as a more efficient use of resources.
In England, particular emphasis has been placed on involving general practitioners (GPs) more closely in the commissioning (purchasing) of services. This has been partly informed by concerns that the considerable autonomy enjoyed by GPs (as independent primary care contractors to the NHS), and an associated lack of financial accountability for treatment and referral decisions, has contributed towards spiralling costs, a perceived lack of cooperation with other service providers and large variations in clinical practice. 4 The new (2010) coalition government's response is to devolve financial control to ‘consortia’ of general practices. In contrast to previous attempts to align local clinical decision making with budgetary responsibility, such as GP fundholding in the 1990s and practice-based commissioning (PBC) introduced in 2004, these consortia are to assume real budgets on a fully accountable basis.
At present the number and size of future consortia is unknown. Indeed, as acknowledged by the government's own consultation document on commissioning, there is a relative lack of empirical evidence on the nature and scale of risk associated with setting and managing devolved budgets for relatively small populations. By quantifying the level of budgetary risk likely to be experienced by GP consortia of different sizes, this paper aims to help redress this gap in the evidence. To that end, it draws on the actual methodology currently used by the Department of Health (DH) to set practice-level mental health budgets, thereby offering a ‘real-world’ perspective on budgetary risk.
Methods
The ‘casemix-based modelling approach’ (developed by the authors to inform mental health budgets for PBC) combines evidence on the resources needed to treat individuals with different casemix-defined categories of mental ill-health (using data provided by the NHS Information Centre's Casemix Service 5 ) with modelled evidence on the likelihood that different ‘person types’ will fall into each of the casemix categories. These ‘person types’ are defined with respect to factors such as age, sex, ethnicity, housing tenure, employment status, receipt of certain benefits, limiting long-term illness and place of residence (which, included as a group-level effect in a mixed effects, or multilevel, multinomial model, is used to capture how the local socio-economic, cultural or physical environment affects the likelihood that individuals will fall into the various casemix categories). The underlying idea is that if one can establish the composition of practice populations in terms of these factors then one can (a) apply the mixed effects multinomial model to generate probabilistic estimates of the number of people in each practice in each casemix category, (b) attach appropriate ‘expected resource needs’ to those probabilistic estimates, and (c) aggregate the results to practice level.
These resource need estimates can be (and for resource allocation purposes are) expressed as ‘point estimates’, but the use of Bayesian methods means that they are underpinned by full predictive resource need distributions. In practice, 500 resource need estimates are generated for each general practice and most will cluster around the distribution's mean. This can be thought of as the level of resource that would, over the long-term, be required to meet the annual mental health needs of each practice's population. But each predictive resource need distribution includes a range of estimates which reflect how the resource needed to treat individuals, as well as the number of people with mental health needs, is likely to vary from one year to the next. In the present context, the significance of this is that the predictive distribution can be used to determine budgetary risk; to quantify, in other words, how likely it is that a practice's mental health resource needs will, in any one year, exceed its allocation (set relative to the mean of that distribution) by a predetermined proportion or amount.
Results
The casemix-based approach to PBRA is innovative and hitherto untested, even if the need estimates themselves exhibited sufficient face validity for use by the DH to set practice-level fair-share allocations. Explicit validation of the methodology is not possible as there is no independent ‘gold-standard’ measure of the prevalence of mental ill-health, let alone of the resources needed to meet the mental health needs of small populations. However, where comparisons can be made with measures likely to proxy, at least to some degree, the mental health needs of populations, positive and statistically significant correlations are invariably found.
The relationship with health service utilisation data (e.g. on the number of people in contact with NHS secondary mental health services 6 or who are registered as having dementia or a psychotic disorder 7 ) tends to be relatively weak, which is as might be expected given known variations in clinical practice. Comparisons with more direct measures of need, such as age-specific estimates of the prevalence of common mental health problems, 8 return r-squared values of between 0.24 and 0.5, though as these address a somewhat different measure of need and are themselves based on a prevalence model derived from an analysis of the 2000 National Psychiatric Morbidity Survey, one would perhaps not expect to find particularly strong correlations. All that can be claimed is that casemix-based estimates are at least consistent with other sources of evidence regarding variations in mental health needs and service use.
The way in which casemix-based estimates of need reflect variations in deprivation is also much as one might expect. As illustrated in Table 1, overall practice-level need estimates are neither particularly strongly correlated with Index of Multiple Deprivation (IMD) scores (as determined by a population-weighted attribution to practices of lower level small output area IMD scores 9 ) nor subject to a particularly steep gradient. But much stronger relationships and gradients are apparent when the focus is on specific age bands. For instance, to meet the mental health needs of people aged 50–59 years, practices in the most deprived decile would require, on average, 3.12 times the per capita resource required by practices in the least deprived 10 percent of practices. With a r-squared value of 0.873 there is, moreover, a very strong relationship between practice-level need estimates and IMD scores. Only for the 85 years plus cohort is deprivation relatively poorly correlated with resource needs, suggesting that by this point in the life course morbidity is dominated by age itself.
The relationship between practice level per capita resource need estimates and Index of Multiple Deprivation scores

While it may initially seem counter-intuitive that the overall relationship between practice-level need estimates and deprivation is so much weaker than that for specific age bands, this actually serves to emphasise the particular strength of the casemix approach; namely, that it is sensitive to both the composition of practice populations and the varying needs of the different types of individual within them. At an overall practice-level, in other words, the generally strong relationship between deprivation and mental health needs is disrupted by the fact that deprivation and demography are correlated (there being, for instance, a correlation co-efficient of -0.428 between practice-level IMD scores and the proportion of registered patients aged 65 years or above).
The resource need estimates generated by the casemix-based approach are intuitively reasonable, albeit impossible to formally verify or validate. Of particular interest in the present context, though, is whether the predictive resource need distributions that underpin those estimates fully capture the extent to which practice-level needs are likely to vary from one year to the next. The problem is that there is simply no empirical basis upon which to test this issue, which must instead be assessed on purely methodological grounds.
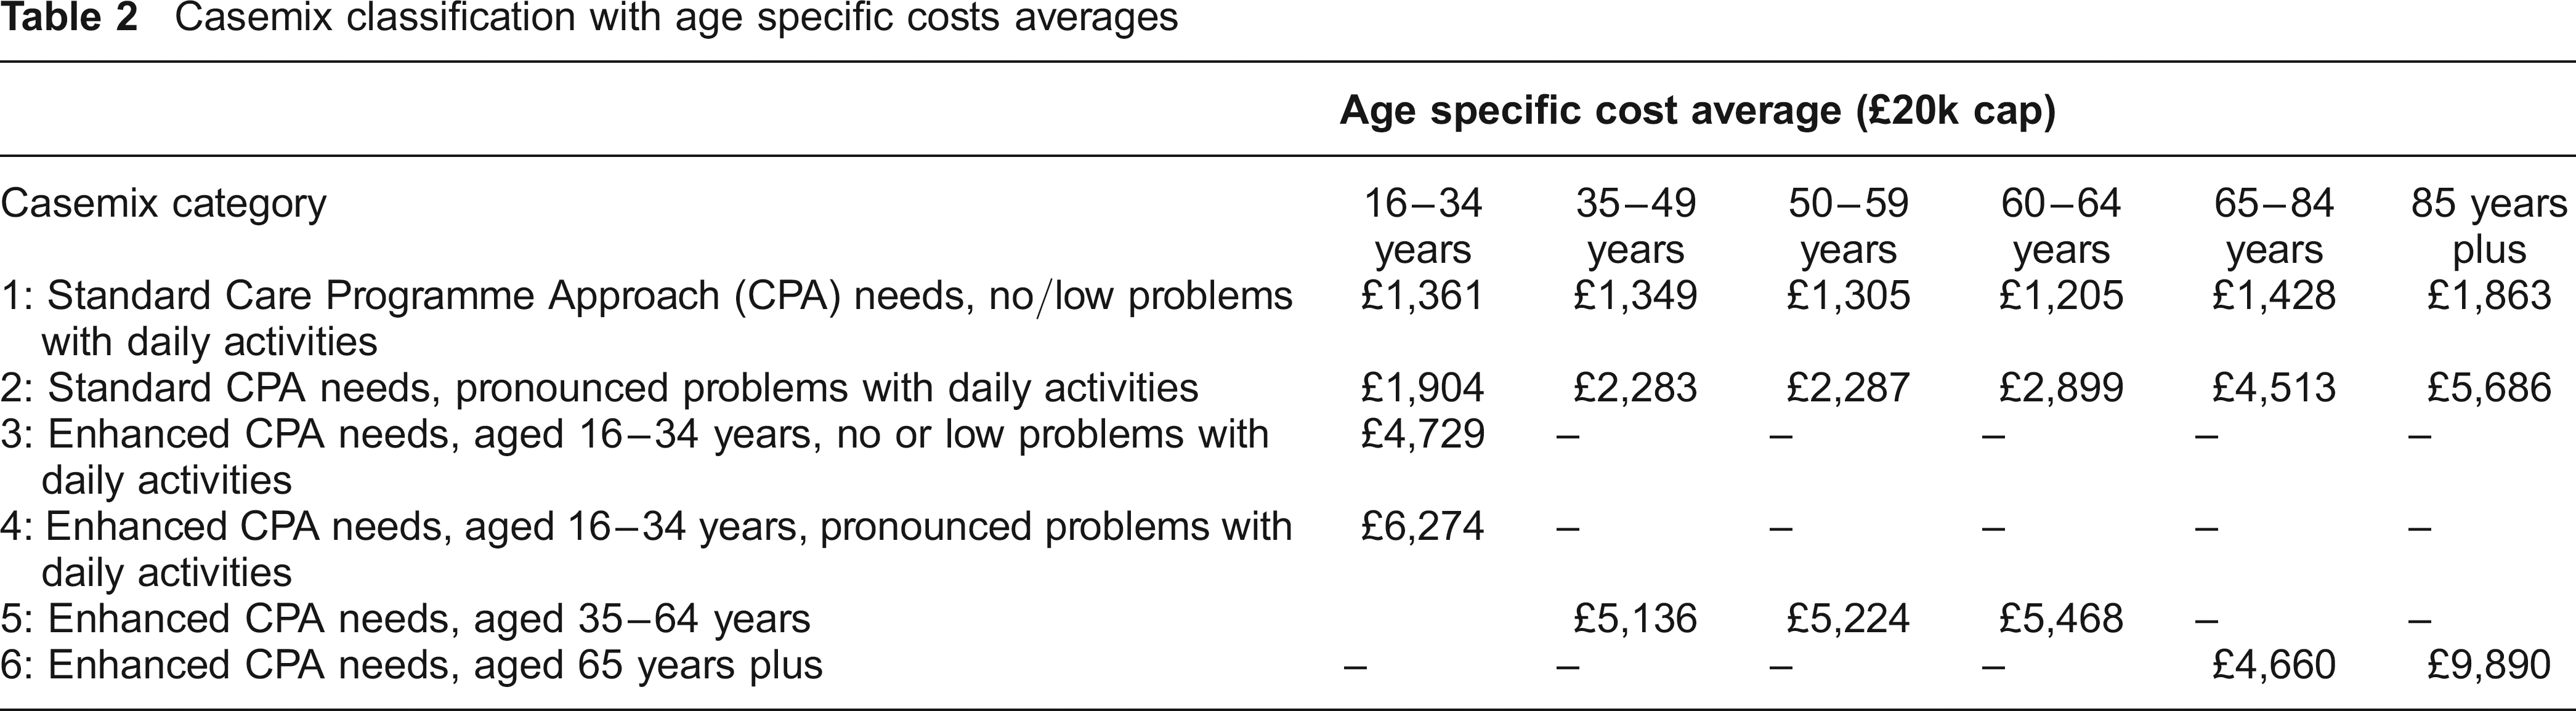
Evidence on variations in the resource needed to treat individuals with mental health needs is drawn directly from the Casemix Service's analysis of service activity. 5 Data on 54,641 patients and 1.2 million activities across inpatient, outpatient and community health settings were collected as part of this study although, as a large proportion (78%) was of inadequate quality, the final dataset comprised only 11,361 valid patients and 32,444 activities. The casemix categories, along with the average (mean) level of resource (capped at £20,000) used by individuals in the six age bands used to model needs, are given in Table 2. Of course what needs to be captured is the variation that lies behind these averages. This is achieved by randomly sampling values from the appropriate set of costs in the casemix dataset. As described below, this is undertaken 500 times for each person type in each practice, resulting in a set of estimates which reflects the variability of costs found in the original casemix study dataset.
Casemix classification with age specific costs averages
Variability in the number of people likely to have mental health service needs is, meanwhile, captured by the models used to estimate how many people will fall into each of the casemix categories. These cover, respectively, the 16–34, 35–64 and 65 plus age bands, reflecting the different combinations of casemix categories into which people in these age bands could fall. Model parameters were derived from an analysis of 42,657 respondents (one per household) in the Health Survey for England (HSE) 2001–06. Unfortunately, as the HSE does not include explicit evidence on whether individuals have mental health service needs nor, if so, into which of the casemix categories those needs would fall, it was necessary to classify respondents using criteria which mirrored, so far as possible, those used in the original casemix classification.
The initial determination of whether an individual in the HSE had mental health needs was based on whether they (a) self-reported a mental health condition, (b) were receiving British National Formulary (BNF) central nervous system drugs 4.1– 4.4 or 4.10 – 4.11, or (c) scored very highly (8 or more) on the 12-item General Health Questionnaire (GHQ12) used by the HSE to detect the presence of non-psychotic psychiatric morbidity. The subsequent determination of casemix category was then based on: their age; whether they had the sort of multiple needs which would give rise to an enhanced needs assessment according to Care Programme Approach (CPA) criteria 10 (e.g. reporting a combination of living alone with a severe lack of perceived social support, unemployment, self-reported ‘very bad’ overall health, multiple limiting illnesses and/or self-reported inability to face problems, overcome difficulties or make decisions); and, whether they were likely to have pronounced problems with daily activities (which was again proxied with reference to a range of HSE questions, this time addressing respondents’ capacity to undertake everyday tasks such as getting out of bed, walking, getting out of a chair and going to the toilet).
Having attached a response variable (i.e. casemix categorization) to each HSE respondent, mixed effects multinomial models with logistic links were then used to model the likelihood that any given individual, defined in terms of the factors noted above, would fall into one of the six casemix categories (or would have no mental health needs). Adopting a Bayesian approach, model parameters were extracted as posterior distributions (of 500 values) rather than as fixed values, again with a view to retaining and using all available information on uncertainty in the production of the final practice-level estimates. By applying these parameter distributions to each ‘person type’ within each practice, and attaching, as described above, resource needs sampled from the appropriate cost distributions, 500 separate resource need estimates for each person type in each practice were generated. Multiply each of these estimates by the number of each person type in a practice, and sum across all person types in the practice, and one obtains 500 independent estimates of that practice's overall mental health resource needs.
This final step requires information on the composition of practice populations expressed in terms of the factors used in the mixed effects multinomial model. As only the age and sex of patients is reliably recorded, a technique known as ‘iterative proportional fitting’ (IPF) is used to ‘microsimulate’ the detailed composition of practice populations by combining GP registration and local socioeconomic data from the 2001 census and other administrative sources. IPF is a widely used and long-established method11–14 of combining separate marginal distributions(i.e. how many males and females, how many people in each age band, how many have and do not have limiting long-term illnesses, etc.) in order to derive a full joint distribution – i.e. one which describes the proportion of individuals in the population with each unique combination of characteristics. The resulting microsimulated population, when aggregated, will match in all respects what is known about the overall characteristics of that population.
The key advantage of working throughout with distributions, though undoubtedly a complex and computationally intensive process, is that it means that all quantifiable sources of variation can be captured and expressed in the final probabilistic estimates of practice-level resource needs. This variation can be represented, as in Figure 1, by plotting the range within which we are, say, 95% certain that the actual level of resource need will fall in any one year. Following Bayesian terminology, this is known as the 95% credible interval.

Adult mental health resource needs: practice level 95% credible intervals
As might be expected, this shows that there is likely to be significant year-on-year variation in practice-level resource needs (in this case with respect to adult mental health needs), but also notable is the extent to which the level of variability differs from one practice to the next. In part this reflects the fact that practices comprise different combinations of person types whose resource needs exhibit varying degrees of volatility, but it also responds to the wildly varying size of practice populations (which reach a maximum size of nearly 40,000 patients). In general terms, the larger the practice the lower the relative level of unpredictability in resource needs, and what is true for individual practices applies equally when resource need estimates are generated for groups of practices. This is illustrated by Figure 2 which plots the 95% credible interval ranges for two PCTs and each of their constituent practices.

Adult mental health resource needs: 95% credible intervals for two primary care trusts (PCTs) and their constituent practices
Of course, what matters in the present context is not estimate uncertainty per se but what it means in terms of budgetary risk. What, in other words, is the likelihood that any given population's mental health resource needs will legitimately exceed its allocation by more than a given percent? Determining this statistic is a trivial task because we have, for each practice, a set of 500 possible resource need estimates. The likelihood that resource needs in any one year will exceed a threshold defined relative to the mean of the distribution – which is used as the basis for setting allocations – can thus be calculated with reference to the underlying distribution. The same principle can, moreover, be applied to the resource needs of hypothetical, but real-world, GP consortia constructed by bringing together adjacent practices into groups of increasing size.
Discussion
While few, if any, of these groups of practices will precisely replicate future GP consortia – which have yet to be announced – the fact that they represent spatially-cohesive units should mean that, like real consortia once established, they will reflect local and regional variations in the sociodemographic geography of England. Each of these hypothetical GP consortia is then given a mental health allocation equal to the sum of its constituent practices’ allocations – each of which is based on the arithmetic mean of its resource need distribution. The likelihood that each hypothetical consortia will overspend is then calculated with reference to the joint probability distribution, which is assumed to be normal with a standard error equal to the square root of the sum of the variances of its constituent practices’ predictive resource need distributions.
The point is that the resulting likelihood estimates are based on plausible combinations of practices and the actual mental health resource need estimates used to determine current practice-level allocations. This, in other words, provides a ‘real-world’ basis upon which to explore the impact of population size on the size of budgetary risk. The four graphs included in Figure 3 thus plot the size of the populations served by each hypothetical GP consortia against the likelihood that, in any one year, they will ‘legitimately’ overspend their mental health budgets by at least 1%, 3%, 5% and 10% respectively (presupposing, of course, that there is no intervention to restrict expenditure when budgets are squeezed or, for that matter, to ‘spend up’ when resources are available due to an unusually low level of legitimate demand). And we use the term ‘legitimate’ advisably, for this concept of ‘overspending’ is explicitly with reference to fixed allocations rather than needs. The point is that in meeting the random variation of legitimate needs GP consortia will, on occasion, either have to overspend or restrict access to health care services.
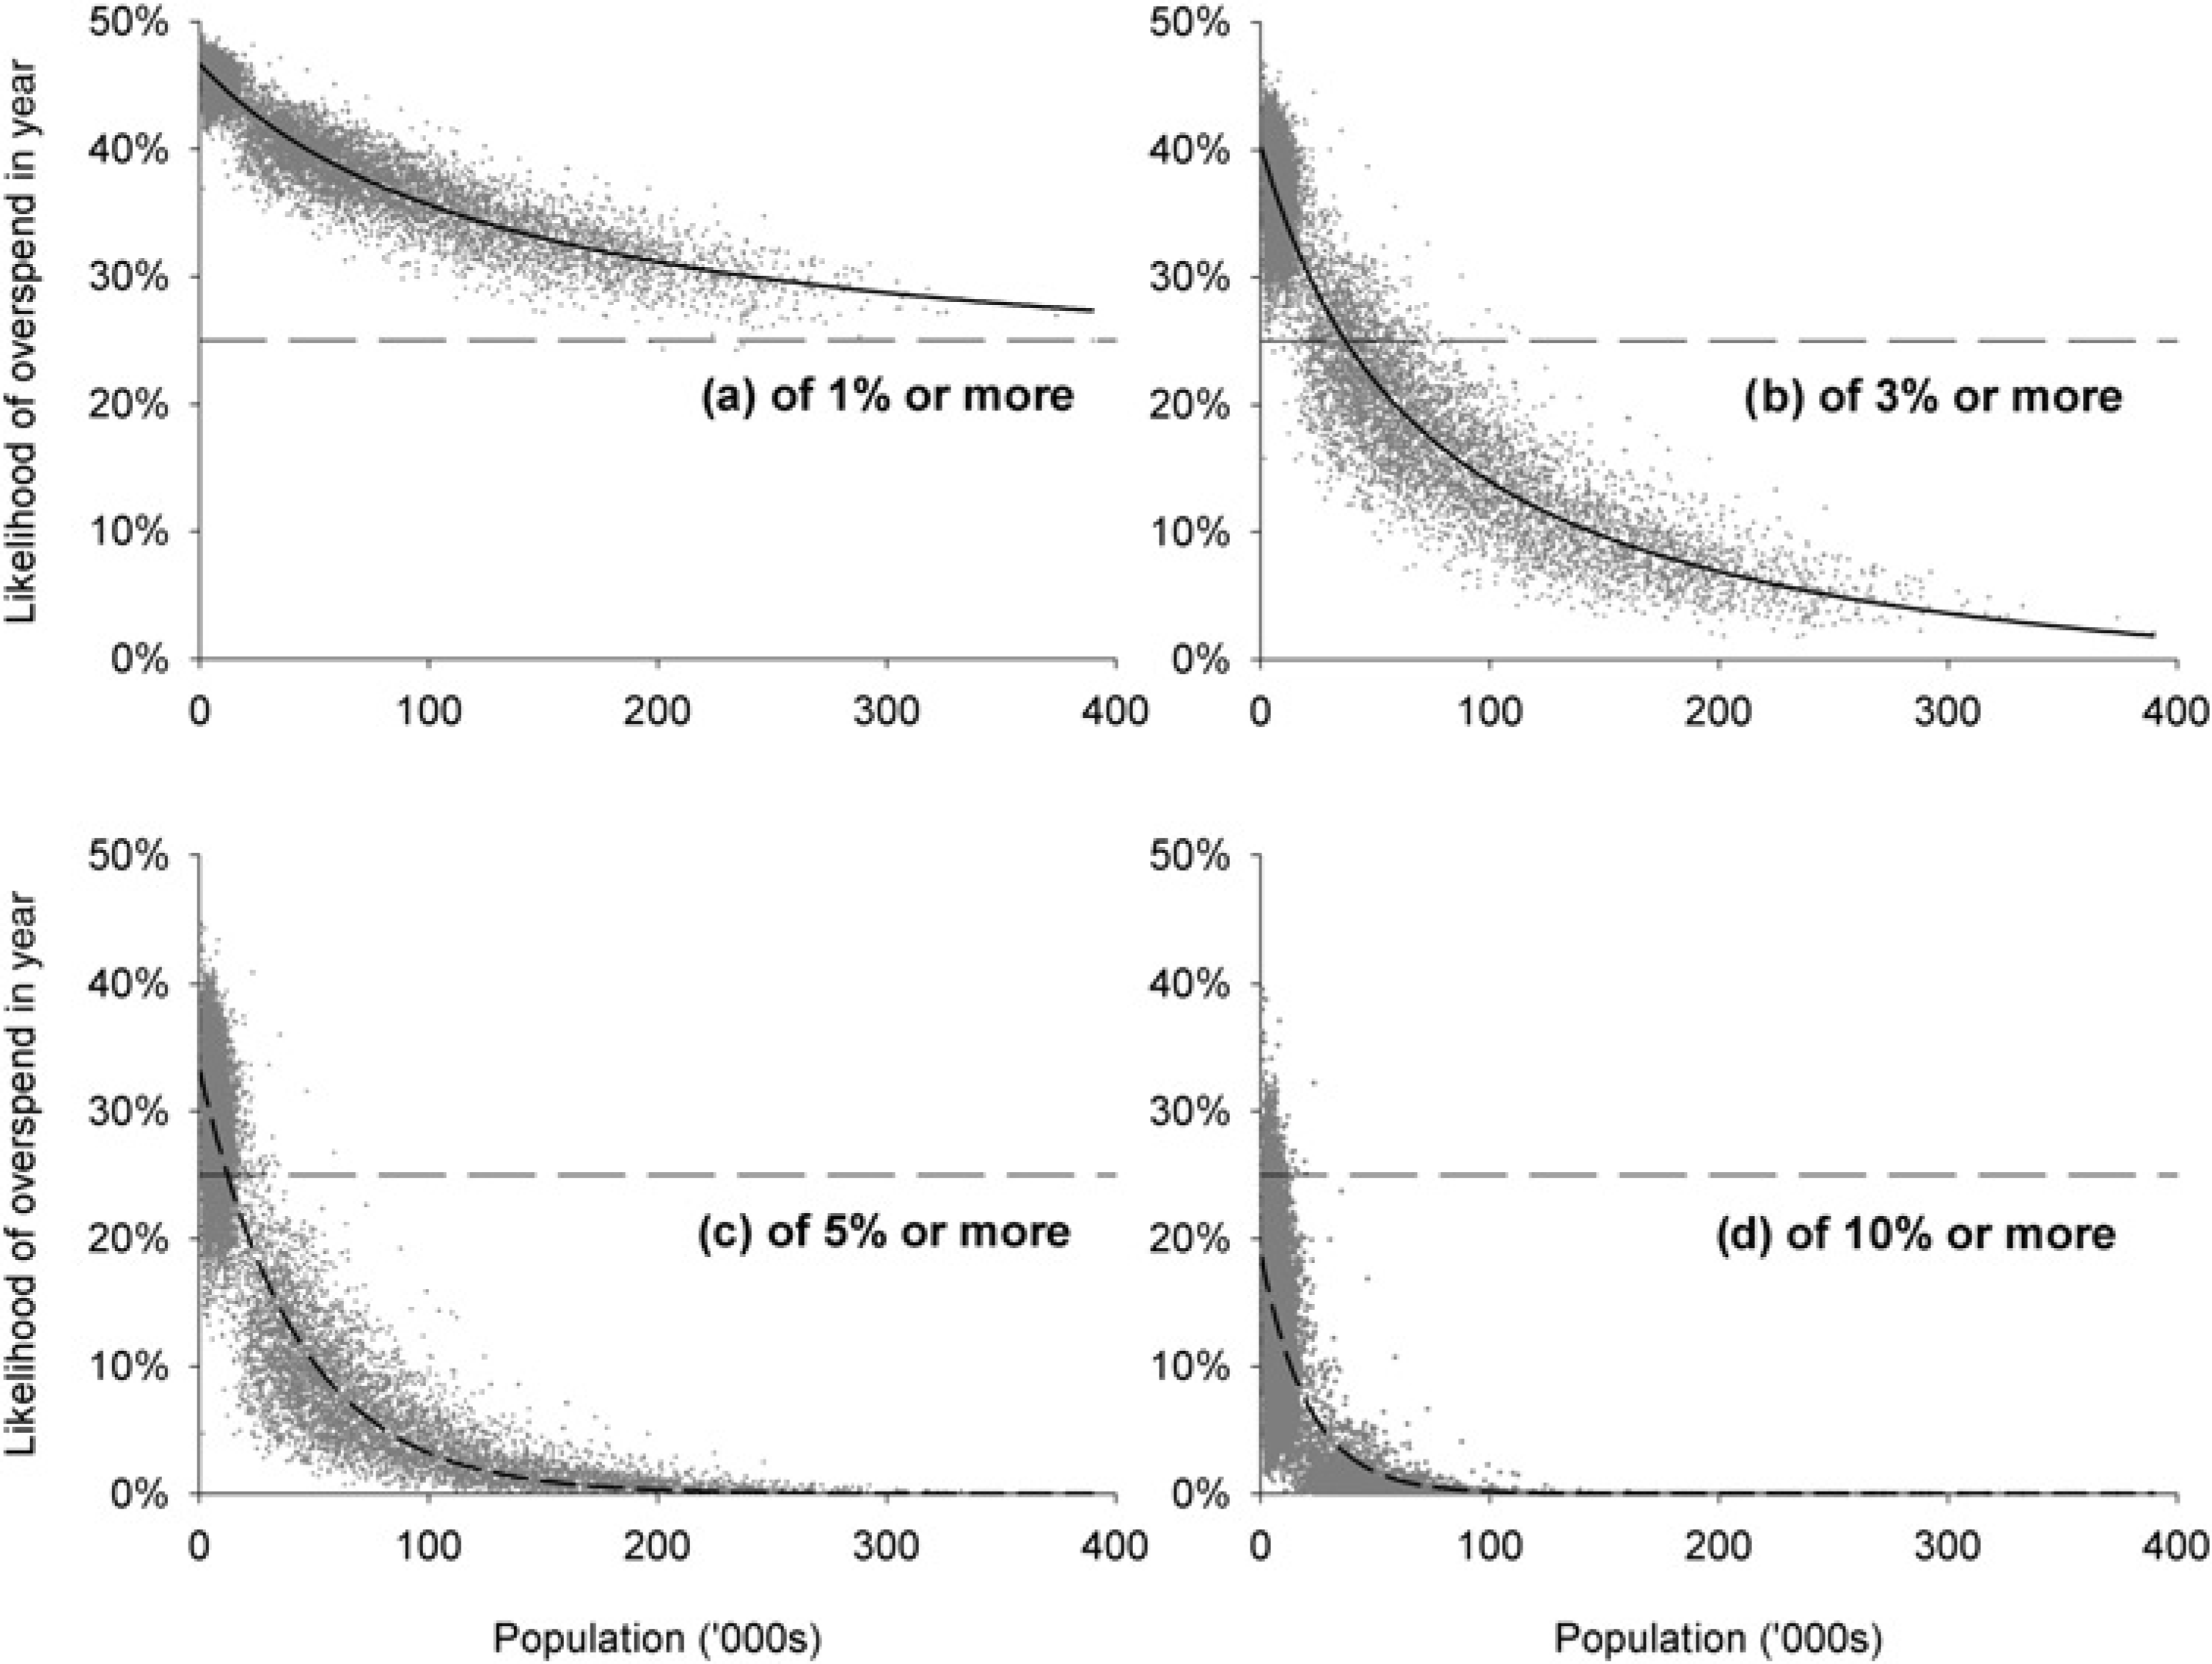
The effect of population size on the likelihood of GP consortia overspending by at least 1%, 3%, 5% or 10%
These graphs offer important insights into the risk that GP consortia of different sizes will need to overspend in order to meet the mental health needs of their patients – and these can be read off the graphs without need for any detailed explanation – but there is only so far that a purely empirical analysis can take us. What really matters is what is deemed to be an ‘acceptable’ level of risk and this, in turn, will depend on as yet unknown policy decisions. For instance, if GP consortia are to have complete financial autonomy – and are to be fully responsible for any overspends – then the DH will need to take a very conservative view with respect to the size of GP consortia. In this respect it is worth noting that if the widely touted number of between 500 and 600 GP consortia emerge (which, by implication, will serve, on average, between 104,000 and 87,000 patients) then one would expect that each year, other things being equal, between 15 and 26 consortia will overspend by at least 5% each year in order to meet the legitimate mental health needs of their patients. One or two consortia each year will overspend by at least 10%. If fixed budgets are taken to mean a fixed ceiling on expenditure then the only response available to potentially overspending on mental health services will be for consortia to restrict expenditure or, alternatively, draw upon resources allocated with respect to the acute, maternity and prescribing sectors. The fact is that, with these odds, we can be fairly certain that some people in some areas will find access to treatment being tightly regulated. A ‘postcode lottery’ is inevitable – albeit one that responds to random fluctuations in demand rather than any systematic misallocation of resource.
The significance of this paper is that it provides real world (albeit hypothetical) evidence of the level of budgetary risk likely to be experienced by GP consortia of different sizes. In general terms the findings concur with those of several other studies which show that, because the relative size of variation of needs around the long-term average is population dependent, a risk pool of at least 100,000 patients is needed to bring the level of financial risk down to an acceptable level.15,16 However, even at this threshold, a significant number of consortia would need to overspend in order to meet the legitimate mental health care needs of their patients.
Without the introduction of strategies to mitigate budgetary risk, the introduction of fixed budgets is likely to result in significant financial instability. A number of such strategies are available,17–19 such as retrospectively reimbursing consortia for high cost individuals. In the Netherlands, for example, sickness funds are compensated for the higher costs of high risk individuals by receiving funds from a common ‘risk equalization pool’ which covers around 50% of total expenditure. Another option is to ‘layer’ the management of risk, e.g. by developing risk sharing agreements between consortia or placing certain conditions and/or procedures that are associated with particularly high health care costs into a higher level risk pool such as that to be managed by the new NHS commissioning board. The problem, of course, is that this can increase administrative costs while at the same time diffusing decision-making and accountability and potentially remove incentives to commission more cost effective packages of care.
Such options should therefore be evaluated and implemented before fixed budgets for GP commissioning are put in place, with the understanding that the policy goal of devolving decision making to the local level may, in practice, introduce more risks than benefits.
Footnotes
Acknowledgements
This work was funded by the NHS National Institute for Health Research's Policy Research Programme (Reference 0700051). The views expressed are not necessarily those of the NIHR/Department of Health. Data were drawn from the Office for National Statistics, 2001 Census: Standard Area Statistics (England and Wales) [electronic file]. ESRC/JISC Census Programme, Census Dissemination Unit, Mimas (University of Manchester). Census output is Crown copyright and is reproduced with the permission of the Controller of HMSO and the Queen's Printer for Scotland. Health Survey for England data for 2001 to 2006 inclusive were obtained from the UK Data Archive. Additional geographical identifiers (MSOAs) for all respondents were supplied by the National Centre for Social Research (NatCen) and made available to us for use in their ‘Safe Haven’.