




Abstract
Objectives
Choice of provider was introduced in Sweden in 2001. Our aim was to describe the scope and character of patient flows and to analyze any differences between patients who chose to move outside of their home county (movers) and those who did not (non-movers) with regard to age, sex, waiting time and level of need.
Methods
Use of cataract operations between 2005 and 2008 based on data from the National Cataract Register. Data were analysed using descriptive statistics, odds ratios and multivariate regression analysis to compare movers and non-movers. Information on contracting between county councils and providers in other counties was obtained from a survey.
Results
Only 4% of cataract patients were treated by a provider outside their home county. Patient flows were mainly determined by contracts between county councils and providers, and only 1% were considered to be ‘true’ movers (i.e. patients who were not part of any special contracting agreement). Movers differed from non-movers in that they were on average younger, had less serious visual problems and had shorter waiting times.
Conclusion
Though patient flows are minor in scope, the possibility of changing provider has probably been important in tackling long waits in some counties. However, the reform may threaten the equity of health care use.
Introduction
As in many other countries, the Swedish health care system has been subject to market-oriented reforms in recent decades. 1 One important aspect of Swedish health care reform has been the opening of administrative borders to widen the choice of provider with the aim of making providers more competitive and meeting patients' wishes. The intention was also to reduce differences in waiting times throughout the country. It is argued that the reform can promote more efficient use of resources, since providers with short waiting times are considered to have the capacity to take on more patients and thus shorten long waiting lists at other providers.
It has, however, also been argued that this reform threatens the equity of health care utilization and the basic principle that care should be given according to need. Some studies have shown that younger, healthier, better educated and well-situated citizens are more likely to use the opportunity to exercise choice.2–8 These include theoretical works looking at choice from a health systems approach and examining the factors that influence patients' choice. Most use interviews or questionnaires to ask citizens or patients if they would like to change provider and under what circumstances they would do so.
In Sweden, the National Board of Health and Welfare has studied the flow of in-patients between county councils 9 and there are some studies on how the reform has been implemented. 10 However, there is no study focusing on the effects of patients' choice in terms of the scope and characteristics of patients who have exercised choice.
Choice in Sweden is built on an agreement between the state and the Federation of County Councils, finalized in 2000, 11 in which patients can apply for care within or outside their home county. However, if the patient wants to cross the county border for specialist care, this must be in accordance with the same regulations for referrals as in the home county. In cases where the costs are greater, there must also be a confirmed agreement to pay from the home county council, for both out-patient and in-patient care. Highly specialized care at regional hospitals is not included in the agreement; this type of care has long been regulated by special regional agreements between the county councils. Another stipulation is that the patient must pay any extra travel costs of going outside their home county.
Another reform that is connected to the choice of provider is the maximum waiting time guarantee. Since 2005 this guarantee has stated that a patient will get a GP visit within seven days and a first visit to a specialist within 90 days, and that the time between decision to treat and treatment will not be longer than 90 days. 12 If waiting times exceed these limits, the patient will be helped to change provider, within or outside their home county. In such cases, the home county must also pay any extra travel costs.
Other reforms have addressed the rules for establishing private providers, the number of which has increased considerably, especially in primary care, but also for some specialist care. The majority of new providers have been set up in the bigger cities which has led to geographical differences in the opportunity to choose a provider. In some clinical areas, such as cataract care, problems with long waiting lists have opened up a market for private providers to offer certain procedures to county councils in the form of special agreements. Hence, patients on the waiting list can not only choose to change provider by themselves, they can also be offered the option by their existing local provider.
The aim of this study was to describe patient flows between Swedish county councils and to analyze whether movers differ from non-movers with regard to age, sex, waiting time and need.
Methods
We chose cataract care since there is a national registry which gives us especially good conditions to study patient movement. Long waiting times and the fact that cataract care is a planned treatment are also important factors that can be particularly influenced by the reform. While it was once an exclusively in-patient procedure, today almost all operations are performed as day cases. For most patients, the operation involves minor risks, and the expected outcome is nearly complete restoration of vision. In many patients, cataract is bilateral. In 2008, 40% of the patients who received surgery in Sweden had already undergone surgery in the other eye. The number of cataract operations in Sweden increased until 2002 and thereafter slowly decreased until 2009 when there was a marked rise in the number again:13,14 84,500 in 2009; 91,200 in 2010, a rate of 9700 per million population.
Cataract operations were performed by 53 providers, 43 public and 10 private. Among the 21 county councils, 13 had one or two providers, five had three providers and the remaining three had more than five providers within their area. The private providers are almost exclusively funded by the public system through annual contracts. Patients are free to choose among all public financed providers, public or private. Patients only pay a small fee, the major costs are covered by county council taxes.
The National Cataract Register, establised in 1992, is administered by the Swedish Ophthalmologic Society 15 and all providers - both public and private – participate (covering 98% of operations). We included all cataract operations registered in the NCR during 2005–2008 (n = 293 608).
To identify the ‘movers’, each patient's home county code was matched with the county code of the hospital where they had a cataract operation. The home county code was missing for 864 patients. The variables used in the analyses were; sex, age, waiting time, first-eye or second-eye operation, visual acuity in the better eye, and ocular co-morbidity.
The distribution of categorical data was compared between movers and non-movers using x 2 tests. In order to test differences in age t-tests were carried out. Odds ratios (ORs) from logistic regression analyses were analyzed to estimate the association between the chosen variables and being a mover or a non-mover. All of the chosen variables were adjusted for in the logistic regression analysis.
A survey of providers asked if they had any formal agreements with a county council to perform a certain number of operations for patients from another county, in order to separate movers into those who changed provider by themselves and those who were directed to another provider by their home county.
Results
The distribution of these variables among the patients who had a cataract operation in 2005–2008 is presented in Table 1. Descriptive data on visual acuity are presented for categories including persons presenting a visual acuity <0.3, 0.3–0.5, and >0.5, as well as for the median. Over the period there was a decline in the number of operations and an improvement in patients' pre-operative condition. There were more second eye operations, and a rise in the proportion of patients with visual acuity better than 0.5. A major change in waiting times occurred between 2005 and 2006, when the mean waiting time dropped from five to three months.
Characteristics of patients undergoing cataract surgery

Patient flows
In 2005, 5.3% of the patients crossed a county border to have an operation. The following years saw a steady decline in the proportion of movers, to 3.4% in 2008 (Table 1). In the majority of the counties, only a few patients moved, though a few counties ‘exported’ or ‘imported’ substantial numbers of patients (Figure 1). From 2005 to 2008, there were 12,824 movers, giving a mean rate of 4%. In 16 of 21 counties, the proportion was less than 4%. The proportions in the other five counties were 5%, 5%, 10%, 14%, and 45%. In the last of these, most operations were according to an agreement with one of the neighbouring counties. Similarly, the other two counties with a high proportion also had agreements to buy a certain number of operations.
We identified only 2871 patients (1%) who probably changed provider without any underlying agreement.
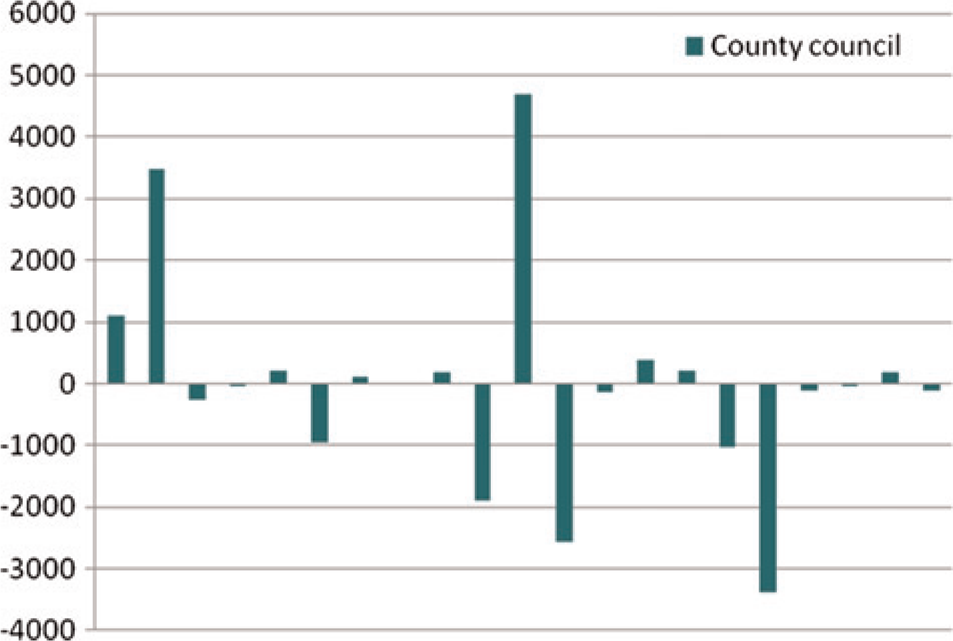
Import (+) and export (-) of patients among the county councils (2005–2008)
Comparison between movers and non-movers
There was no significant difference between men and women in moving frequency. However, as shown in Table 2, differences were more evident when comparing the percentage of men among the movers and non-movers. Movers were also younger and had less serious illness, with both better visual acuity and less co-morbidity. However, the groups did not differ in terms of whether the operation was the patient's first or second cataract operation.
Comparison of movers and non-movers

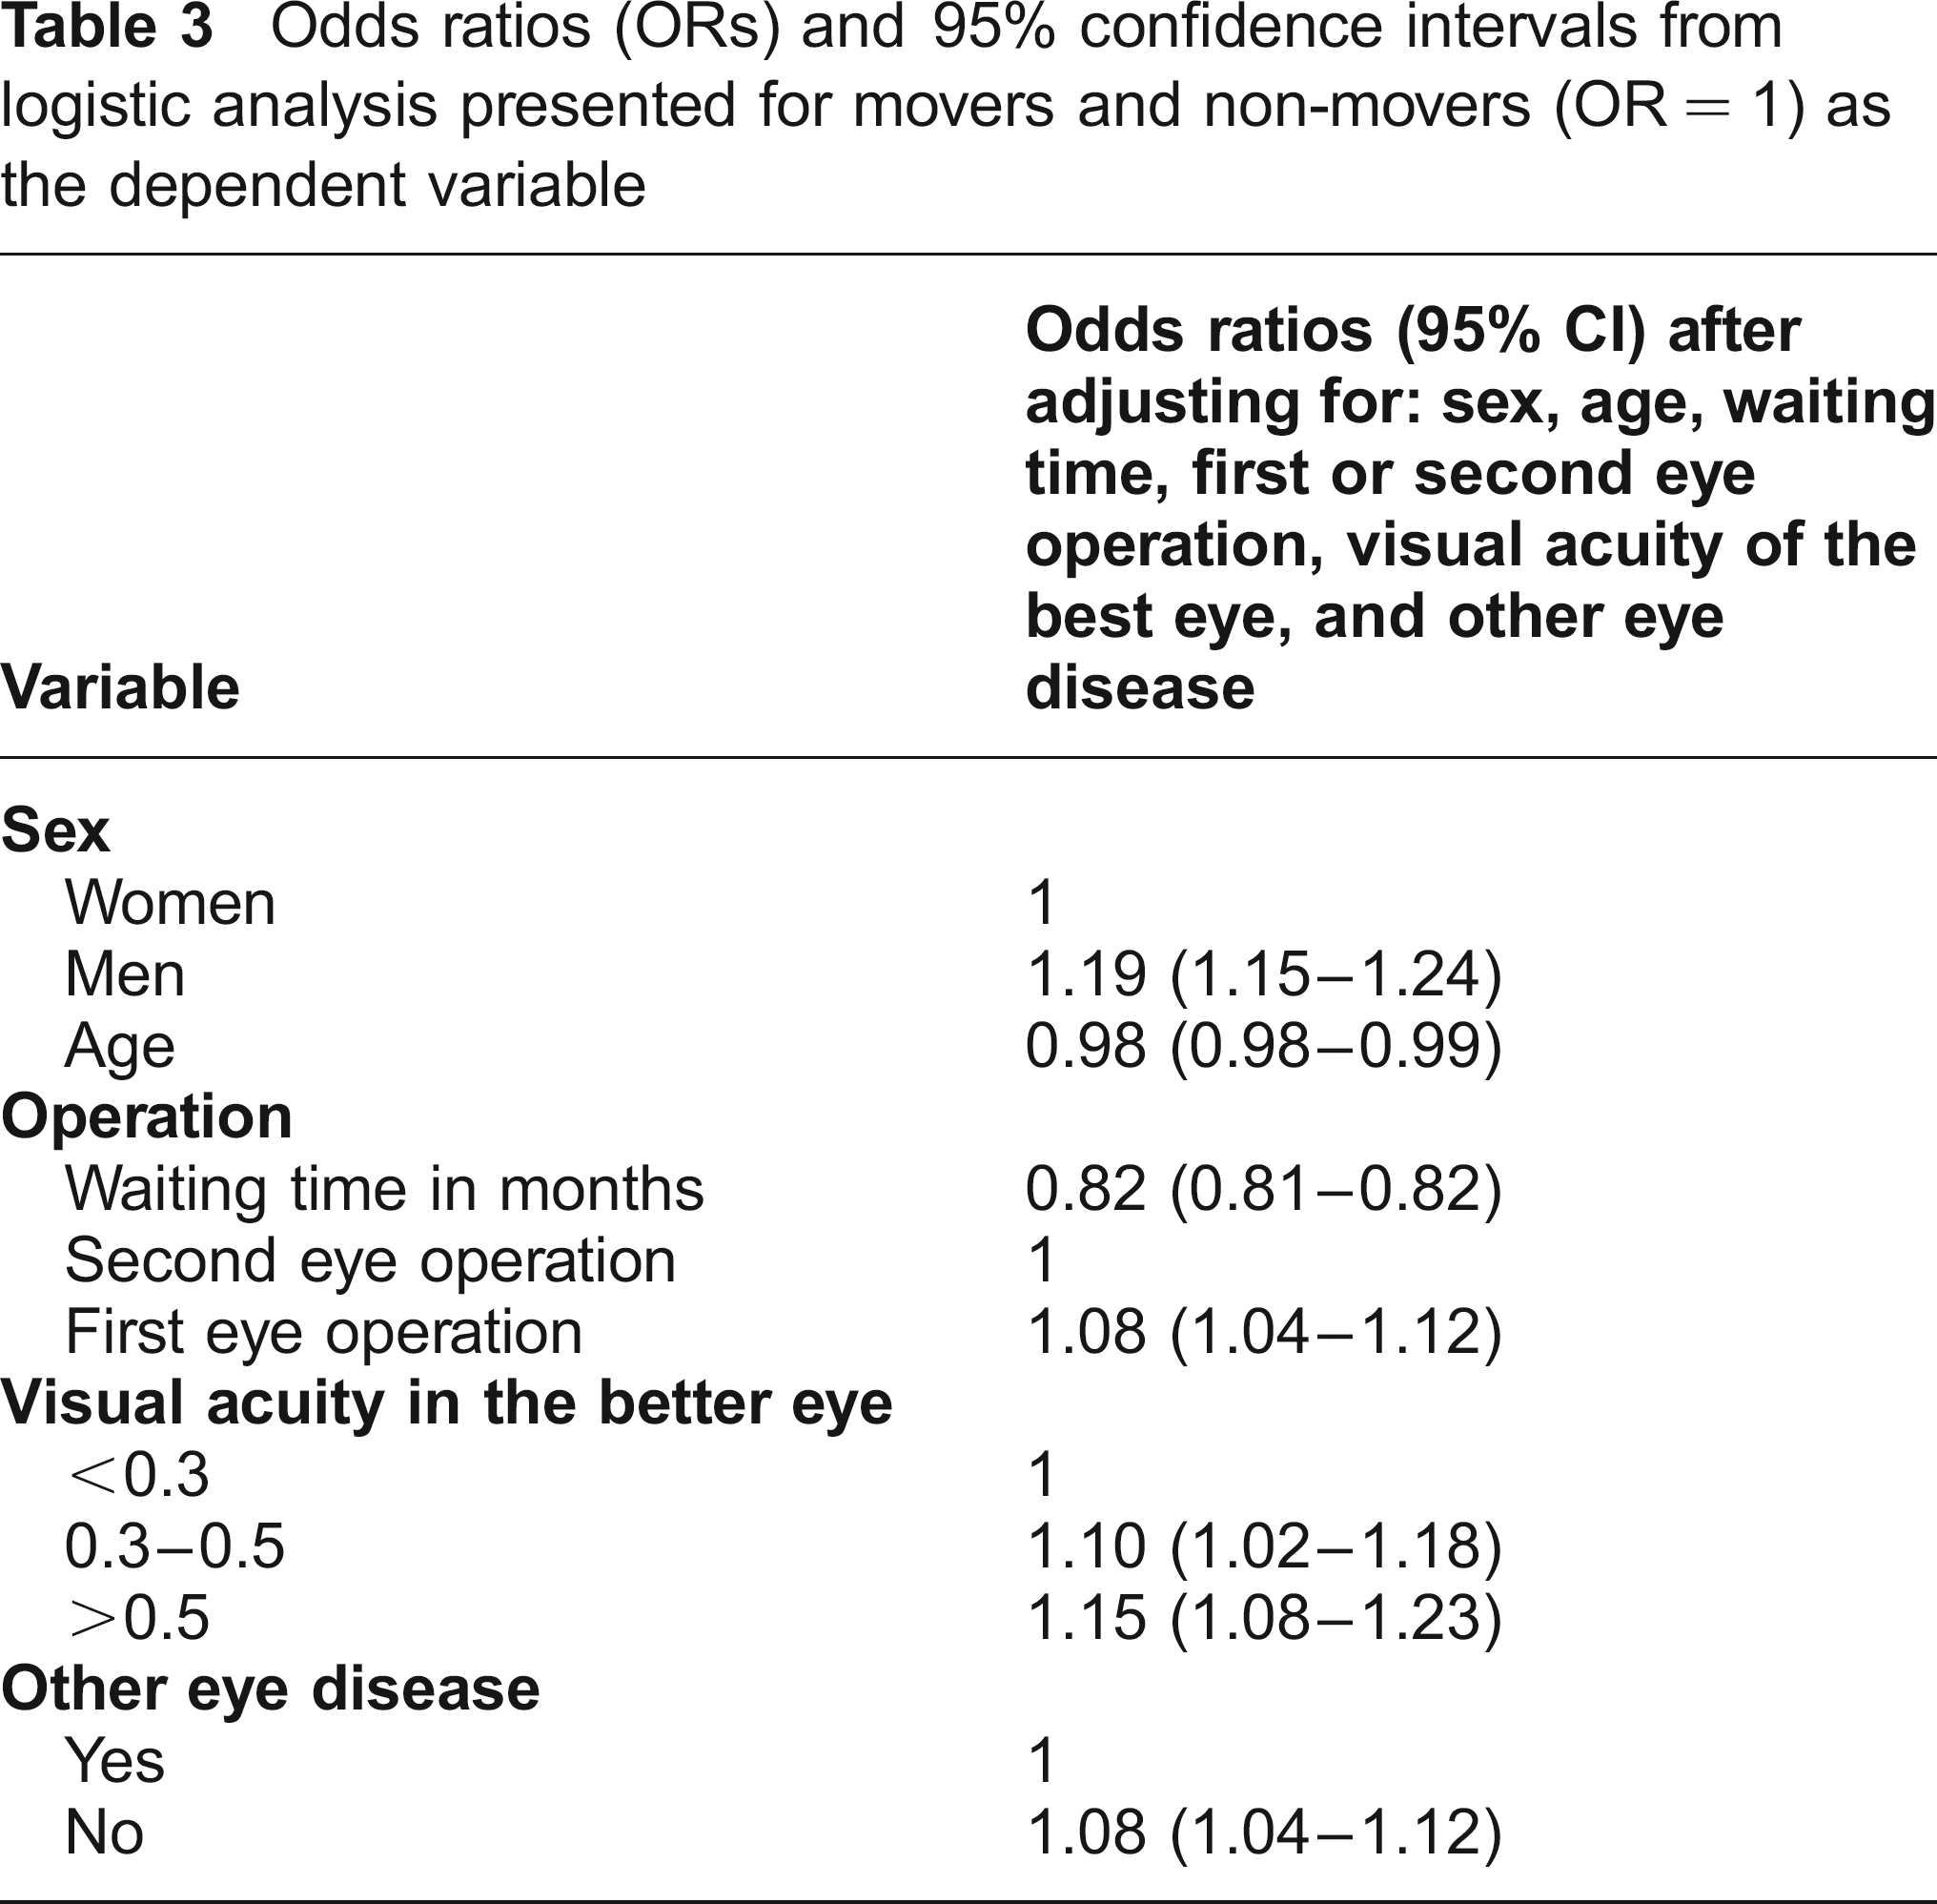
As shown in Table 3, the differences between the two groups remained after adjustment for all the independent variables. First-eye operations became more common among the movers after the adjustment.
Odds ratios (ORs) and 95% confidence intervals from logistic analysis presented for movers and non-movers (OR = 1) as the dependent variable
Discussion
Only a small proportion of cataract patients used the opportunity to go to a provider outside their home county. Patient flows were, to a substantial degree, governed by contracts between county councils and providers. Only 1% of patients were considered as ‘true’ movers who were not part of any contracting agreement. Movers tended to differ from non-movers in that they were younger and had less serious visual problems.
The greatest difference between the two groups was waiting time. Movers' median waiting time was markedly shorter than that of the non-movers. However, there are uncertainties about the registration of waiting time. Patients who had been on the waiting list at one provider did not necessarily have this time included in the report from the second provider that performed the surgery. It is possible that movers experienced shorter waiting times as a result of changing provider.
There was also a major change in waiting times during the study period. The renewal of the waiting time guarantee in 2005 in combination with the introduction of a priority system (NIKE)16,17 is probably the main reason for the decrease in 2006. If waiting time contributes to the choice of provider, then the drop between 2005 and 2006 might explain the downward trend in patient flow.
Waiting time is probably one of the more important factors for patients' choice, but studies have shown that patients also take other factors into consideration. 18 A British study found that 30% of people stated that they would always choose their home hospital, even when treatment at an alternative site would be both quicker and of higher quality.2,21 There are also studies showing that many patients do indeed decide not to travel, and that patients make a different judgement regarding willingness to travel when they are faced with a medical problem.3,7 When patients become ill, they are increasingly likely to wish to rely on a trusted health practitioner to choose their treatment. 8
According to other studies, information on choice seems to be a fundamental factor in a patient's decision to change provider. The degree to which patients elect to choose depends on the degree of participation in clinical decisionmaking and differences in the level of support and resources required to make an informed choice. 4 The data used in the present study do not include any information about patients' knowledge of the alternatives. However, other Swedish studies have shown that doctors have relatively limited knowledge about rules such as the maximum waiting time guarantee, and hence do not always inform the patient of the option to choose another provider. 19 A recently published questionnaire study of the Swedish population's awareness of the waiting time guarantee showed that most citizens over the age of 18 years (92%) said that they had heard about the guarantee, but only 30% knew its content. 20 Information about actual waiting times is not easy to obtain, for either doctor or patient. Poor information and knowledge about the alternatives is thus a possible explanation for the relatively small number of movers.
It has also been anticipated that patients choose a provider based on waiting times, due to their perception of urgency. 4 However, we cannot confirm this association, as the movers in the present study had better visual conditions than the non-movers. One reason for this apparent discrepancy could be that the more seriously affected patients are prioritized and hence already have a short waiting time. 17
It has also been shown that while travel time for treatment matters it is not the most important factor.2,22 It is clear that as travel time increases or travelling becomes more difficult, patients are less willing to take up an offer of treatment. The data in our study are in line with this conclusion, since the patient flows showed a strong connection between neighbouring county councils.
We were not able to include patients' level of education in the present study. This is a significant weakness, since one of the criticisms of the choice reform has been that it may threaten equity. Other criticisms of increased choice are that it would be difficult to control and would become expensive for some county councils with long waiting lists. However, our study gives no basis for concluding that patient mobility is uncontrolled. On the contrary, most of the mobility was the result of agreements between county councils and providers. Finally, we cannot gauge the degree to which our observations of cataract care can be generalized.