




Abstract
Objectives
To determine how levels of case finding differ between general practices in England by level of population socioeconomic deprivation.
Method
Observational analysis of data from the Quality and Outcome Framework in England for 2005/06. It covered 8339 primary care practices. Reported prevalence and estimated prevalence for coronary heart disease, chronic obstructive pulmonary disease, stroke and hypertension were compared.
Results
The gap between estimated and reported prevalence increased with population deprivation and was higher among practices in more deprived areas (defined as Spearhead areas) for all four conditions after adjustment for practice level variables.
Conclusions
There is some evidence of unmet need in areas of social deprivation. Existing financial incentives in the Quality and Outcome Framework may be insufficient to promote active case finding by practices serving deprived populations.
Introduction
On coming to power in 1997, the Labour government in the UK was committed to reducing health inequalities and gave it significant policy attention throughout its period in office. The Coalition government elected in 2010 has reiterated the commitment to reducing health inequalities. 1 The Labour government aimed to reduce by at least 10% the gap in life expectancy between those areas that were in the poorest quintile with the worst health and deprivation indicators in England, known as ‘Spearhead areas’, and the population as a whole. There were 70 Spearhead areas in November 2004, which mapped onto 62 Primary Care Trusts (PCTs). A 10% reduction in inequality meant reducing the relative gap in life expectancy from 2.6% in 1995/97 to 2.3% in 2009/11 for males, and from 1.8% to 1.6% for females. Despite significant improvements in the life expectancy of the most socially and economically deprived, the gap between the poorest and the richest has actually widened and the targets have not been achieved. 2
Policy documents have repeatedly identified primary care as having an important contribution to make to reducing health inequalities. 3 The National Support Team used analysis of Quality and Outcome Framework (QOF) data with PCTs and GPs in Spearhead areas as a key mechanism for reducing inequalities by ensuring identification of unmet need. Secondary prevention of conditions such as heart disease and stroke has been estimated to account for a significant proportion of the gap in life expectancy. 4
If general practice is to contribute to reducing health inequalities, practices in deprived areas must identify people with or at risk of disease in their population (case-finding) and then manage and treat them effectively. We aimed to understand whether the extent to which practices identify such cases varied by practice deprivation. We used data on reported and estimated prevalence of cases. Estimated prevalence data has only recently become available for all practices in England. Previous analysis has focused on local authority level data. 5 This study is part of a larger study looking at the impact of QOF on public health and health inequalities. 6 We hypothesize that deprived practices, will have higher levels of unmet need i.e. a larger gap between community (estimated) prevalence and practice (reported) prevalence.
Methods
This is an observational study using secondary data from a range of sources: QOF data (2005/06); General Medical Services (GMS) data (2005 and 2006); and estimated prevalence models published by the Association of Public Health Observatories. Practice level variables were constructed and linked using practice identifiers.
Deprivation scores for each practice were obtained from a dataset which assigned each practice a level of deprivation based on the postcodes of the practice population and Indices of Multiple Deprivation (IMD 2004). The dataset is an anonymized, non-disclosive dataset. (More detail on the methods used for constructing the variables in the dataset can be found elsewhere.) 7 This method is superior to assignment on the basis of the location of the practice. However, the deprivation scores may be vulnerable to misattribution. They may not truly reflect the actual practice population as they are derived from data on small geographical areas (super output areas). Practices were then divided into quintiles of deprivation using the income domain only because the inclusion of the health domain from IMD 2004 may lead to the possibility of mathematical coupling, where the relationship between IMD 2004 and other markers of health is predicated by measures of health being on both sides of the correlation equation. 8
We used the Spearhead status of the PCT in which the practice was located as a measure of area deprivation. Spearhead status was designated to local authorities (and their corresponding PCTs) that were in the bottom fifth nationally for three or more of the following five indicators: male life expectancy at birth; female life expectancy at birth; cancer mortality rate in under 75s; cardiovascular disease mortality rate in under 75s; and the IMD 2004. Our analysis used aggregated data to indicate deprivation level (i.e. Spearhead status and IMD income quintiles) while inferences are drawn at the practice level. Practice-level deprivation is likely to be measured with error because of this. In addition, as there is more variation in deprivation among individual practices, a possible impact of using aggregated deprivation levels is to cause relationships to be underestimated.
The primary outcome variables (dependent variables) were differences between estimated and reported prevalence for coronary heart disease (CHD), chronic obstructive pulmonary disease (COPD), stroke and hypertension. Estimated practice-level prevalence figures were available for four clinical conditions also in QOF (CHD, hypertension, stroke and COPD) from the Association of Public Health Observatories. 9 These disease prevalence models are based on data from Health Survey for England. They use multinomial logistic regression to predict the disease prevalence from factors such as the age, sex and ethnicity distribution of the population. Details of the methods have been reported elsewhere. 10 The number of patients on the disease registers for each of these conditions within QOF was used to calculate reported prevalence. We estimated reported prevalence using the largest available denominator for the indicators for that disease similar to the methodology employed in other studies. For each practice we calculated the difference between recorded prevalence and estimated prevalence for these four conditions.
The main independent variables were practice level deprivation (IMD 2004 income quintile), Spearhead status, and other practice characteristics: GP caseload (number of patients/full-time equivalents); number of GPs per practice; the country of qualification of GPs (UK/non-UK); the type of contract held by the practice (Personal Medical Services [PMS] or General Medical Services [GMS]) and the age distribution per practice (proportion of those aged ≥65 years old). Approximately two-thirds of practices have signed up to the new GMS contract, and although participation is voluntary, the vast majority participate in the QOF (99.6 percent). Around a third of practices have PMS contracts which are held locally by the PCT. Though initially it appeared that these practices might be allowed to negotiate their own pay-for-performance schemes, PMS practices are also subject to the QOF.
We conducted descriptive analysis and regression modelling using STATA IC 10. Multivariate regression models were employed to analyse the extent to which socioeconomic status of the practice population, as well as various practice characteristics, were associated with the differences in prevalence. Data from the QOF for 8339 primary care practices in England for 2005/06 were analysed; 343 (4%) practices with a list size of less than 1000 patients were excluded as they were likely to be newly formed or about to be closed.
Results
Looking across the four conditions the absolute differences between reported and estimated prevalence were greatest for hypertension and least for stroke (Table 1). The relative differences (i.e. absolute difference as a percentage of the estimated prevalence) were higher for hypertension and COPD.
Estimated and reported (QOF 2005/06) prevalence for selected clinical conditions and the difference between the two (%)
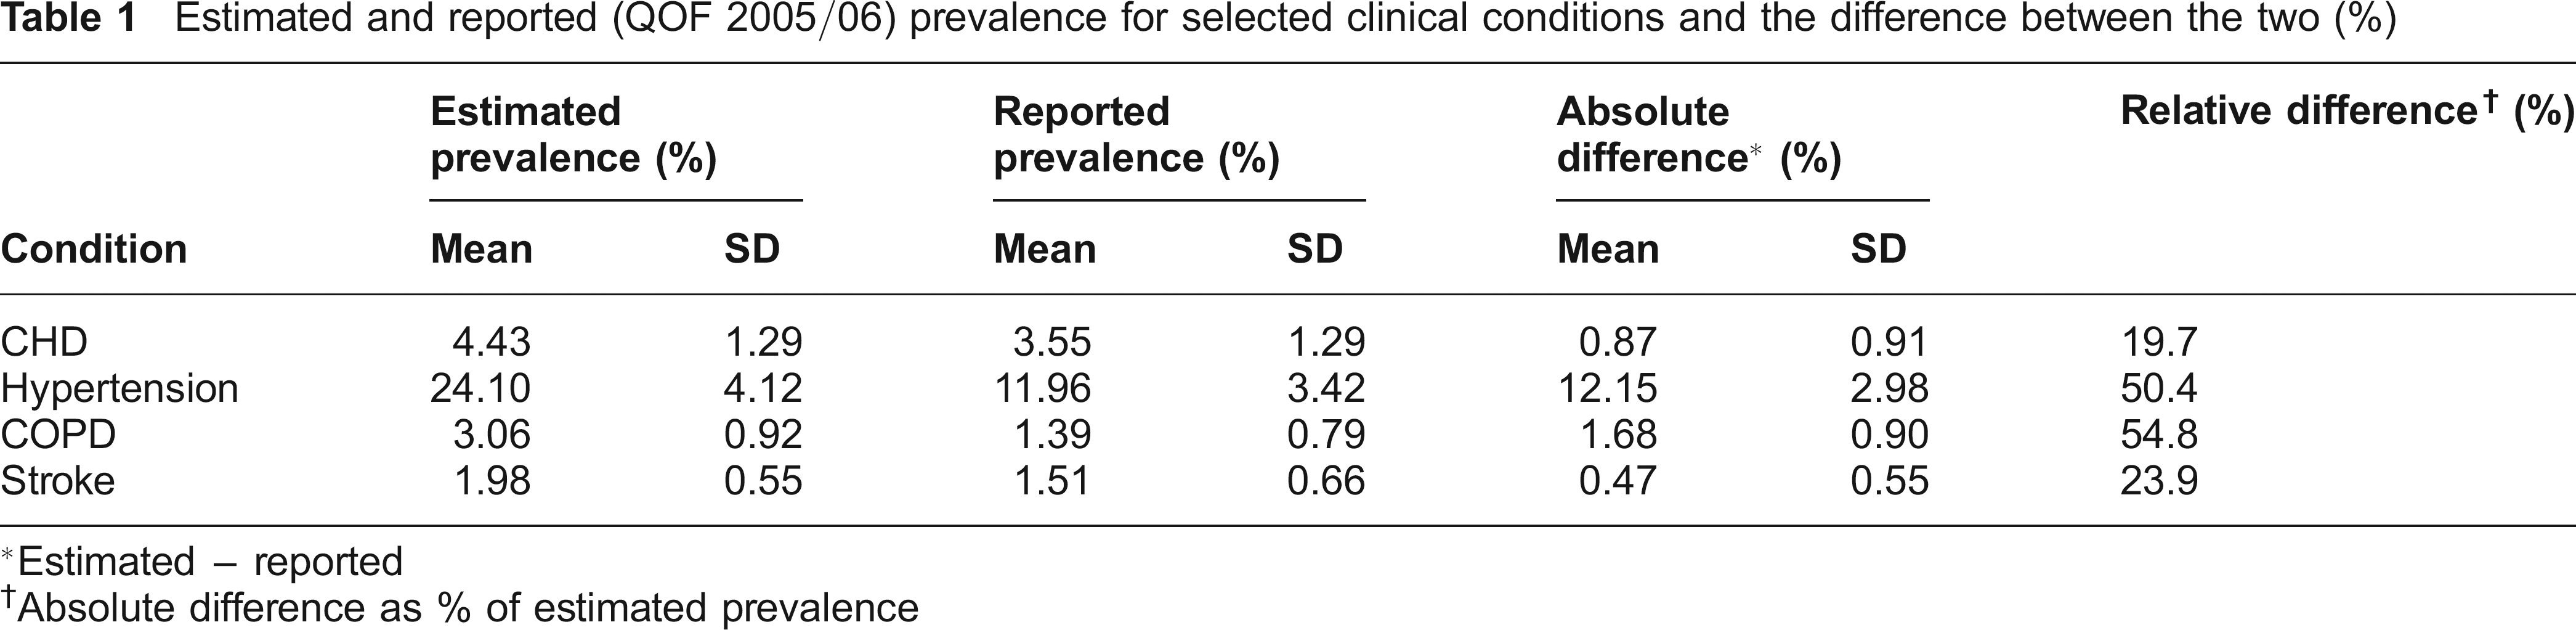
Estimated - reported
Absolute difference as % of estimated prevalence
The gap between estimated and reported prevalence was greater in practices in Spearhead areas for CHD, COPD and stroke. However, the relationship was reversed for hypertension (Table 2). The gap was also greater in practices in the most deprived quintile for CHD, COPD and stroke. For hypertension, the difference in the gap between the most and the least deprived quintiles was not statistically significant.
Mean difference in estimated and reported (2005/06) prevalence (%) by IMD income quintile and Spearhead status of PCTs

We also examined which practice characteristics were associated with differences between estimated and reported prevalence. The direction and significance of correlations varied depending on the condition (Table 3). For CHD, COPD and stroke, larger differences in prevalence were associated with a larger GP caseload, a smaller proportion of GPs who did not qualify in the UK, and smaller practices. These are attributes more commonly found in the least deprived practices. The opposite was true for hypertension, where larger prevalence gaps were associated with a higher proportion of GPs who qualified in the UK, larger practices, smaller caseloads and practices with a greater proportion of elderly patients. The PMS status of practices made little or no difference.
Summary of univariate correlations between difference in estimated and reported prevalence and various practice level factors
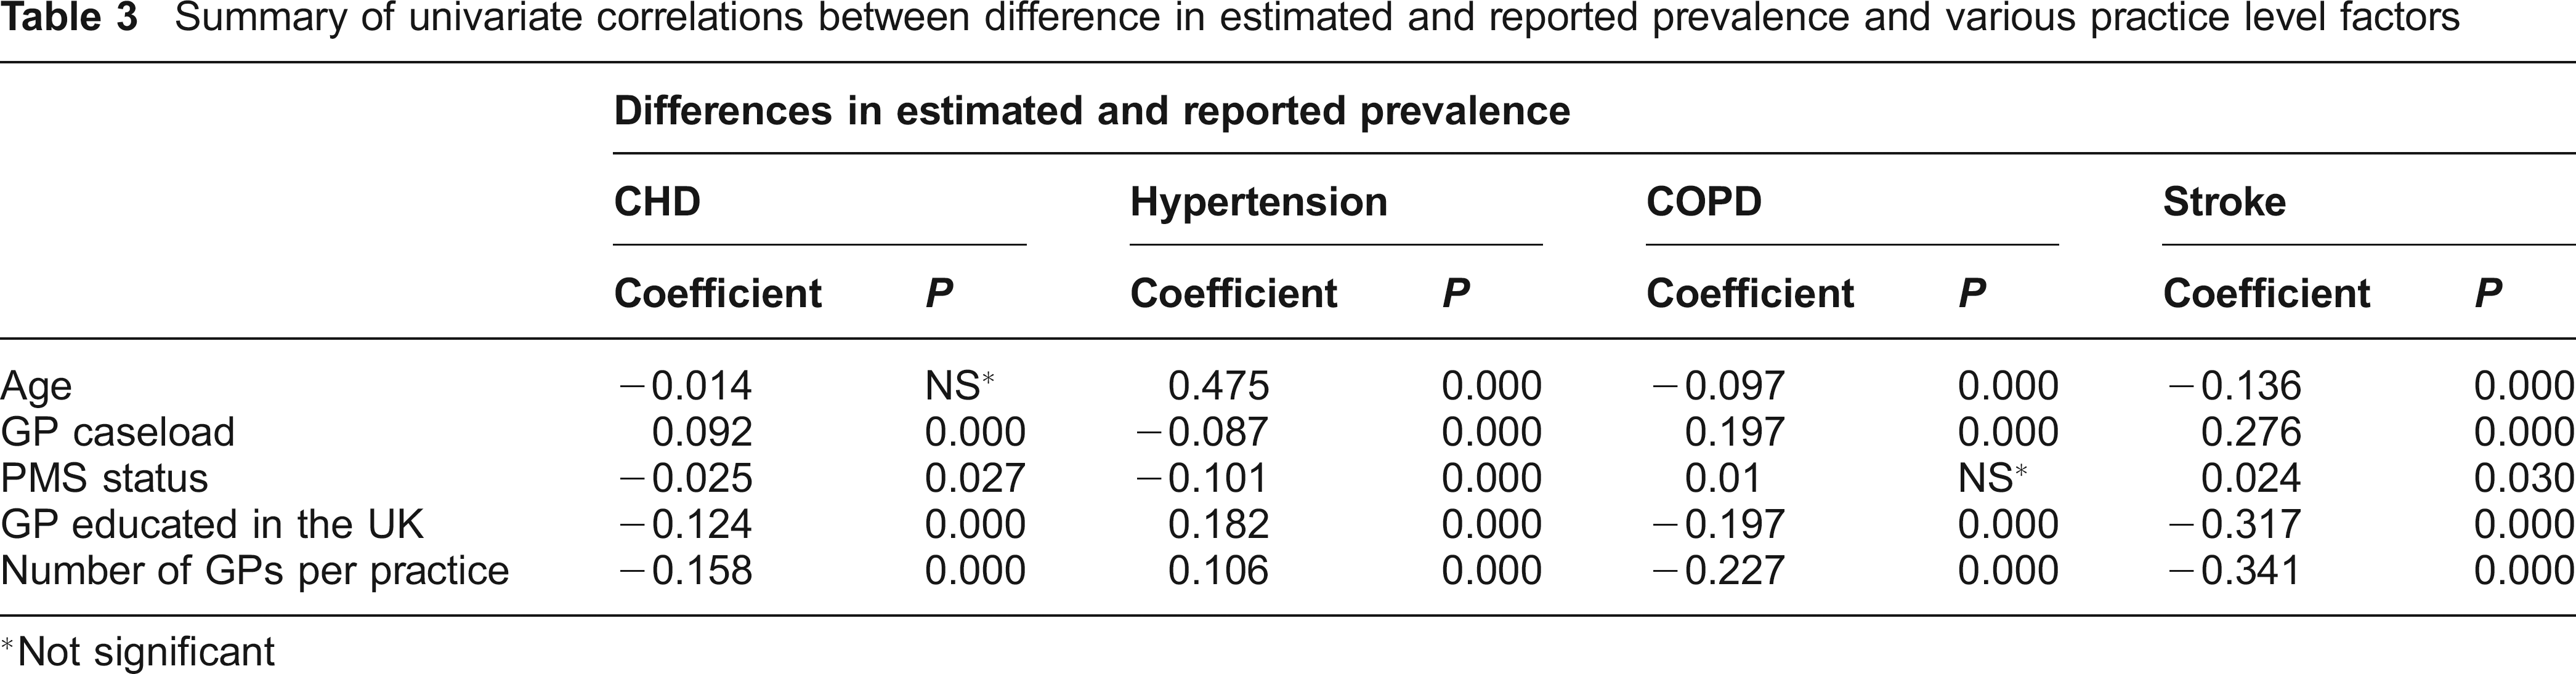
Not significant
We then examined the relationship between the difference in estimated and reported prevalence and deprivation in multiple regression models, adjusting for the impact of practice characteristics. PCT's spearhead status (Table 4) and the IMD income quintiles of the practices (Table 5) were used to indicate deprivation level. After adjusting for the practice-level factors, the gap between estimated and reported prevalence increased with population deprivation and was higher among practices in the Spearhead PCTs for all four conditions. The relationship between the gap in estimated and reported prevalence and income quintiles varied depending on the clinical condition: for COPD and stroke, there was a gradient with the gap increasing with deprivation; for CHD and hypertension the relationship was not linear but the gap in the most deprived quintile was significantly larger than the gap in the least deprived quintile. Because these practice characteristics are also associated with deprivation, some of the relationship found in the univariate analysis all but disappeared in the multivariate analysis. The relatively small R 2 in these regression models suggested that much of the gap between estimated and reported prevalence might be explained by factors other than the ones captured in the model.
Relationship between difference in estimated and reported prevalence (QOF 05/06) and PCT's Spearhead status, adjusted for practice-level factors
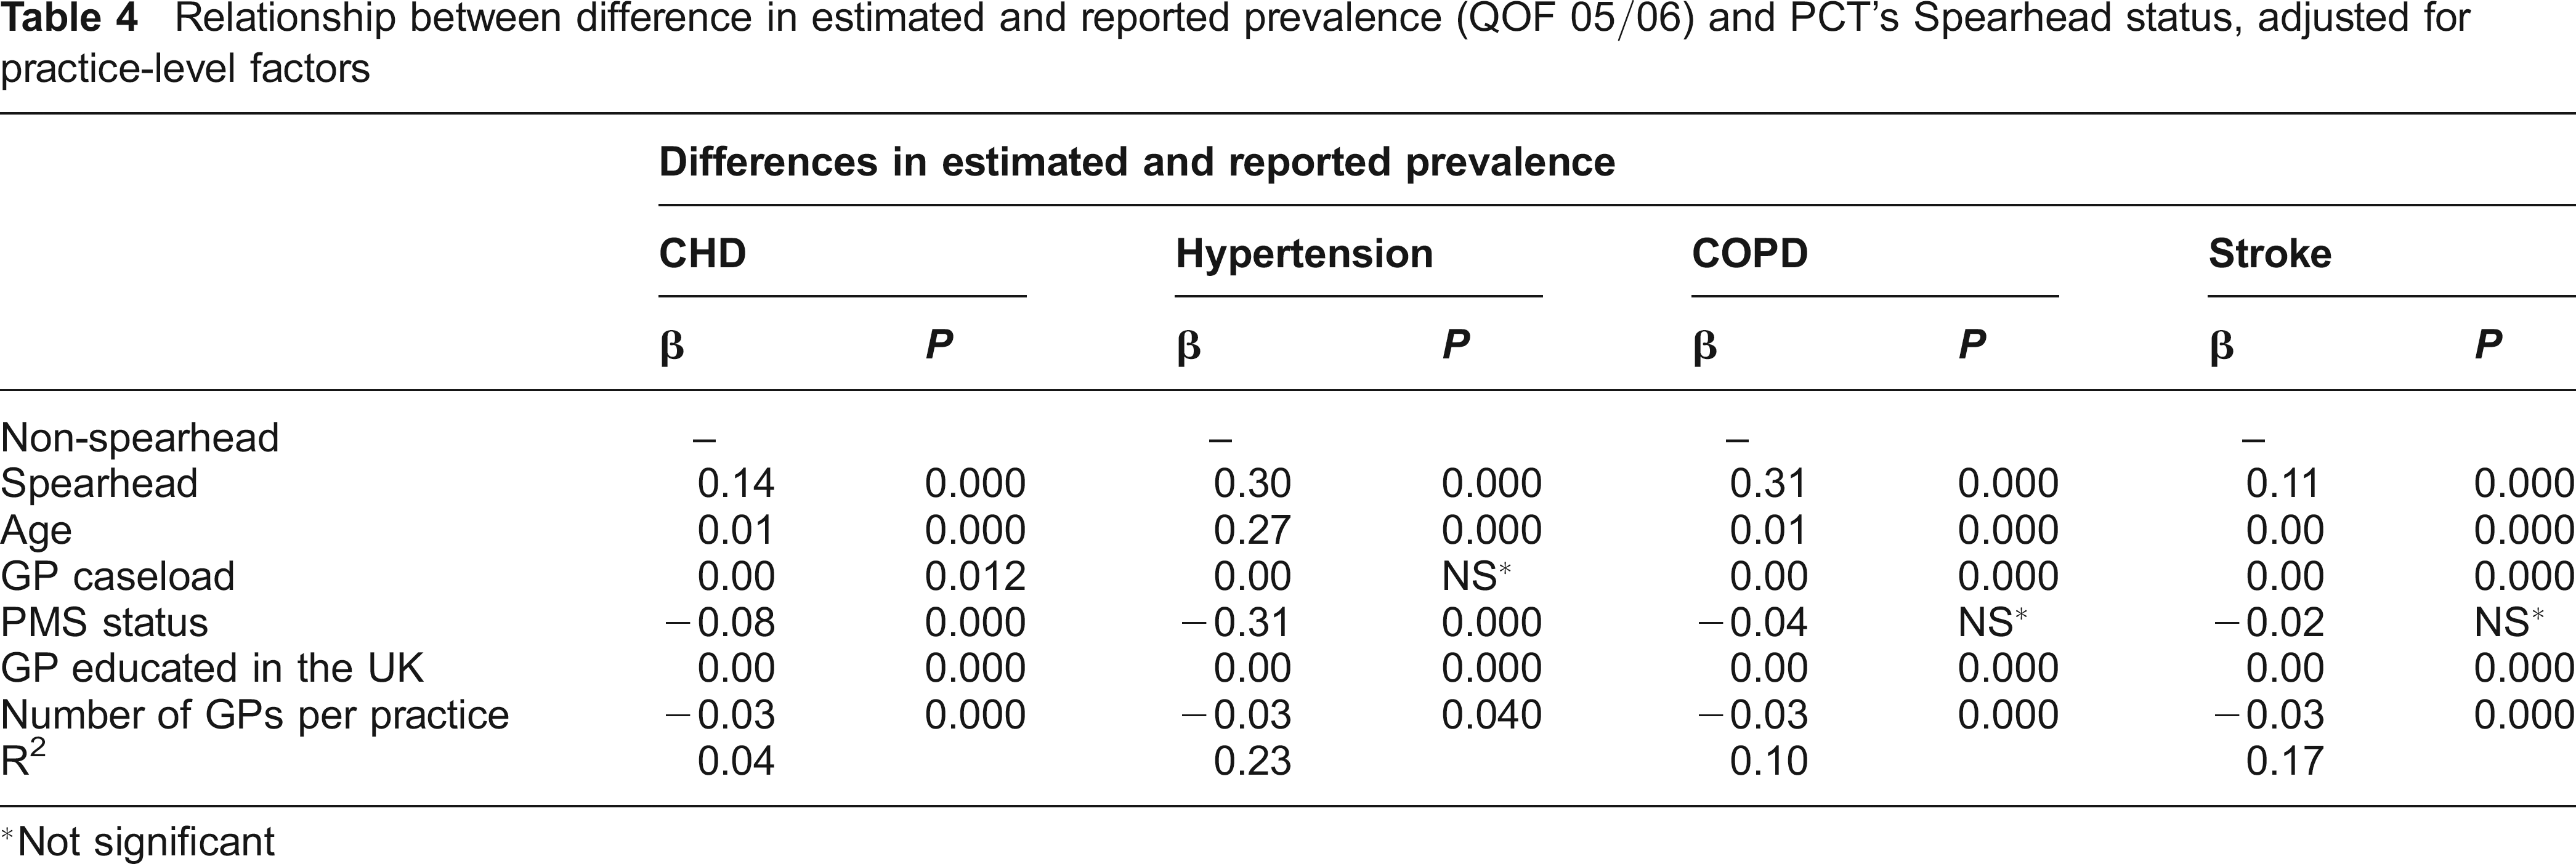
Not significant
Relationship between difference in estimated and reported prevalence (QOF 05/06) and income quintiles (IMD 2004), adjusted for practice-level factors
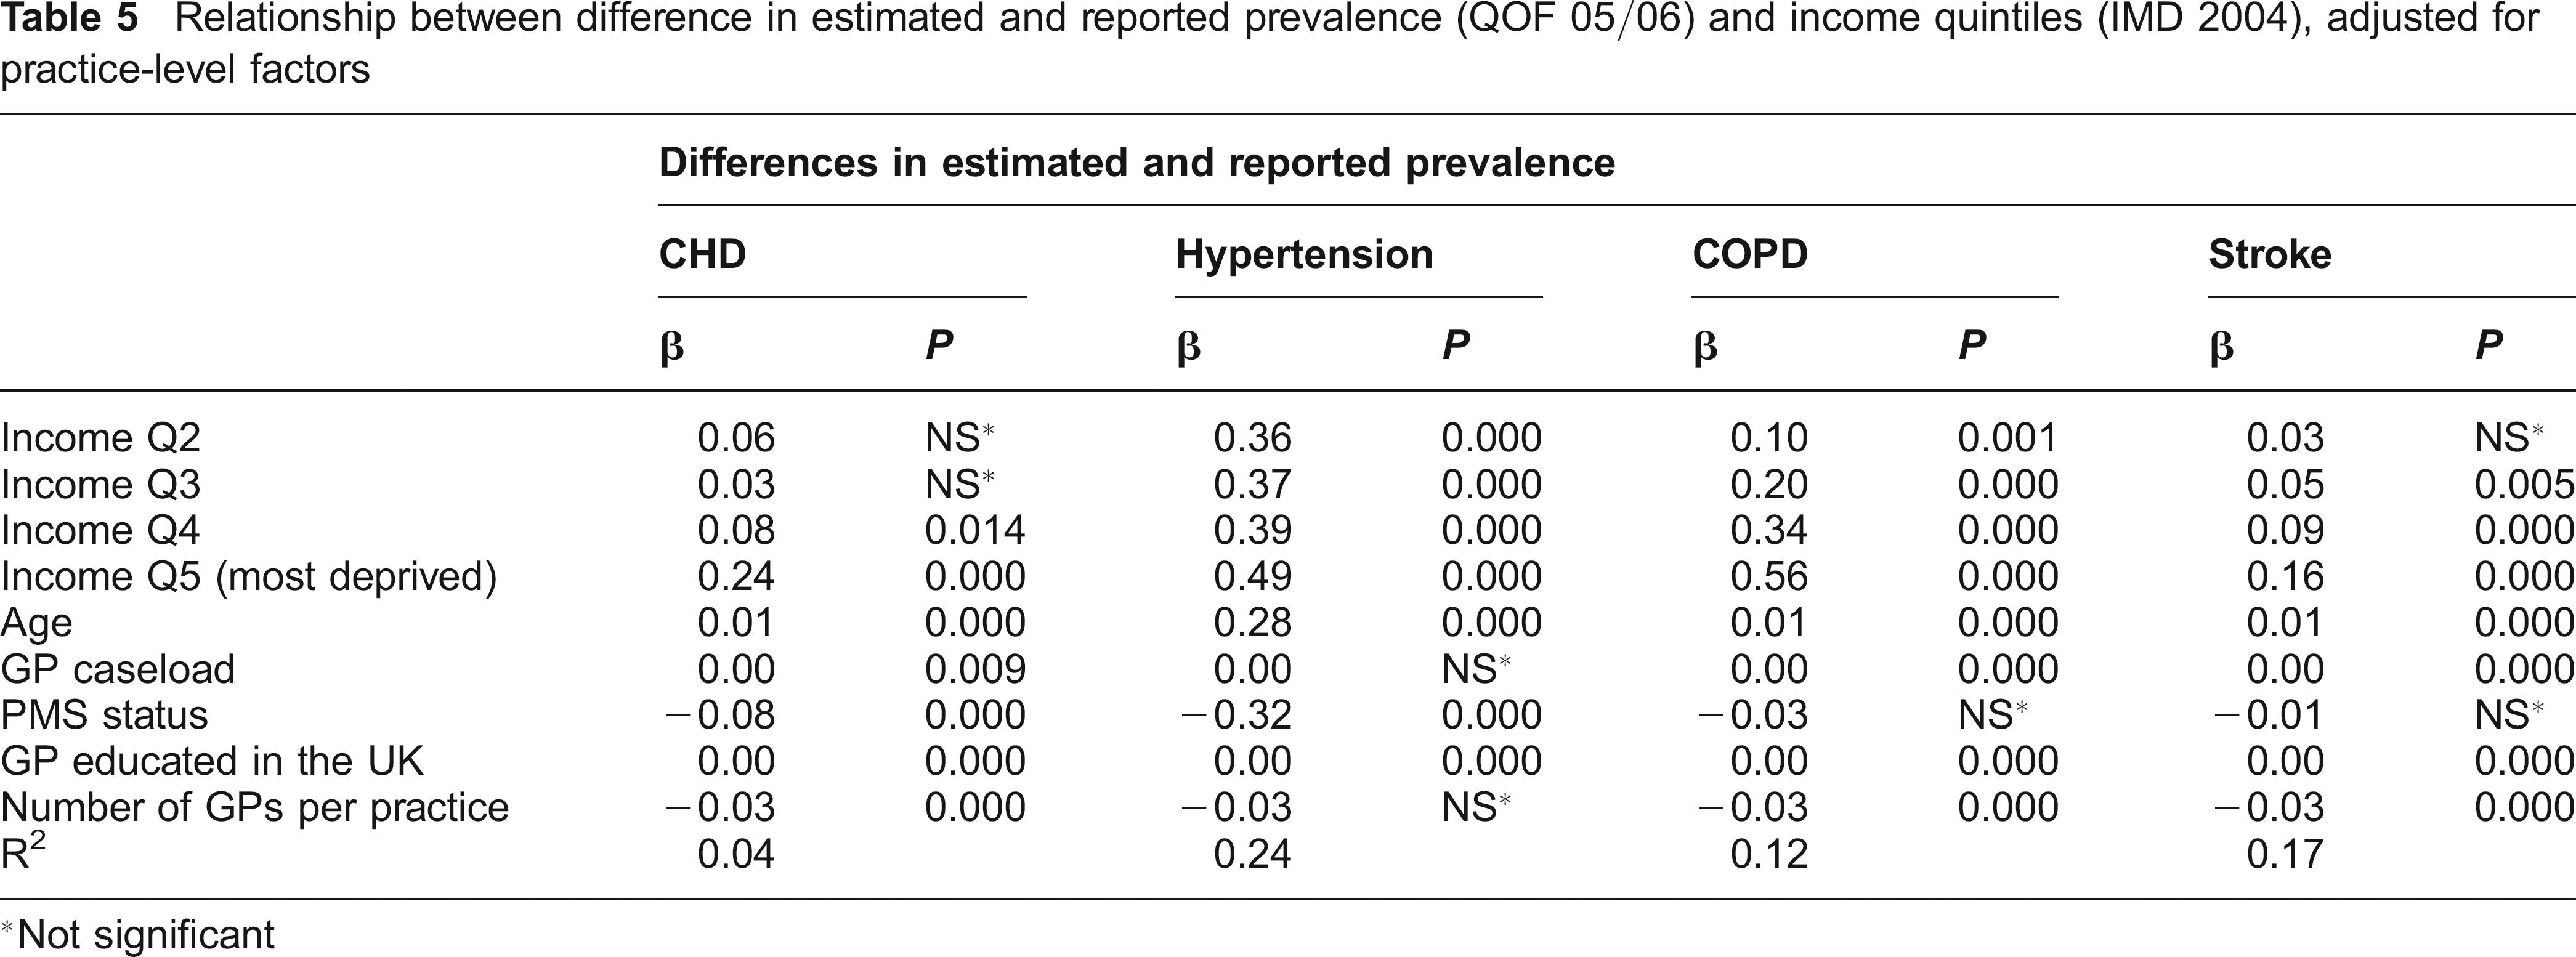
Not significant
Discussion
The differences in the gaps of estimated and reported prevalence by condition suggest that some conditions are more difficult to identify and diagnose. Patients with these conditions may present at their GPs later, if at all. Given that hypertension can be asymptomatic and patients may self treat, it is perhaps not surprising that these patients are more likely to remain unrecorded by GPs. Management of stroke in primary care will usually follow an acute episode and therefore is unlikely to be unrecorded. Anyone unidentified by GPs is likely to be the result of poor communication from secondary providers rather than a lack of case-finding. Identification of patients at risk of stroke is likely to be more variable.
Our findings suggests that for three conditions (CHD, COPD and stroke), deprived practices and areas are failing to identify all cases within their practice. This evidence of unmet need in areas of deprivation suggests that incentives in QOF may be insufficient to promote active case finding by deprived practices. Under identification of disease in these practices and areas means poorer people are more likely to be missing out on effective treatments and not benefitting from secondary prevention. This in turn may be contributing to the persistence of health inequalities by income. Our finding that larger practices, with more UK qualified doctors and smaller case-loads have smaller differences in prevalence may also suggest that well-organized practices may be more systematic in their approach to case finding (as well as able to achieve better QOF scores).
Differences between recorded and estimated prevalence may be due to the accuracy of the estimation model rather than actual differences. While modelled prevalence figures may provide an indication of completeness of disease registers, they are based on a limited number of modelled variables. However, data on differences in prevalence such as that presented here should be considered by commissioners and practices if they are to take their responsibility for population health seriously. Clinical Commissioning Groups will need analytical tools and access to public health data at practice level to assess local population needs, not just those of the registered population, and ensure these are being met.
Until changes introduced in 2009/10, payment per point scored on the clinical indicators within QOF was not linear but calculated using the square root of prevalence. Practices with very low prevalence (less than 5% of the maximum prevalence) were treated as if they had higher prevalence, thus rewarding them more generously. This meant that practices with higher disease prevalence, particularly smaller practices, received a lower level of remuneration per patient than practices with low prevalence. As well as penalising practices in deprived practices, which are more likely to be small and have high disease prevalence, this system was also seen to reduce the incentives to fine cases. 11
Research is needed to track whether differences in prevalence by deprivation fell following the decision to drop the use of a square root formula for calculating the cash due per point in clinical domains in 2009/10. Further qualitative research is needed to understand whether it is simply the lack of incentives for case finding or whether there are other barriers to active case finding by deprived practices.
The underlying explanation for the observed differences in prevalence may be due to differences in health seeking behaviours. Despite care in the NHS being free at the point of use there is long established evidence of inequalities in access to and utilization of care. 12 There are likely to be a range of complex factors at play which explain this. The current system of exception reporting, whereby patients are excluded from the denominator used to calculate QOF achievement if they were sent at least three invitations in the preceding 12 months but did not attend, ‘protects’ practices against non-attending patients. Unfortunately, due to the lack of availability of data on the reasons for exception reporting, it is not possible to examine whether this was a greater problem in deprived practices or areas. Practices serving deprived populations need be given incentives and resources to reach out to these individuals.
Footnotes
Acknowledgements
We acknowledge the feedback on early findings from other members of the project team and Advisory Group and thank the National Institute for Health Research Service and Delivery Organization Programme (ref no: 08/1716/207) for funding. The views expressed are not necessarily those of the NHS, the National Institute for Health Research or the Department of Health.