




Abstract
We investigated the feasibility of a mobile-phone based system for patients with type 2 diabetes who had recently commenced insulin therapy but remained poorly controlled. The system was evaluated in a feasibility study in a general practice setting with 23 patients over six months. A total of 22 patients successfully completed the study and used the system for a mean of 217 days (range 162–376). Blood glucose control improved, as reflected by a mean decrease in HbA1c of 0.66% (P = 0.05), with the mean insulin dose increasing by 17 units (P = 0.006). Blood glucose monitoring compliance was high, with readings available for 6.2 days per week, although use of the mobile phone decreased during the study. On average, the mobile phone diary was used for 3.5 days per week. Insulin dose adjustments were made throughout the study by all patients, but not as frequently as would be expected for the degree of hyperglycaemia observed.
Introduction
In the management of type 2 diabetes, the addition of insulin injections to treatment with oral anti-hyperglycaemic agents is often important. Insulin initiation can restore good glycaemic control, reducing the risks of microvascular and macrovascular complications. 1 However, patients may be reluctant to commence insulin treatment for various reasons, including anxiety about needles and injections, perception of disease progression or treatment failure, or concern about treatment side-effects such as hypoglycaemia and weight gain. 2 Frequent support and reassurance are required to overcome these barriers, and typically involve clinic visits or telephone calls to exchange blood glucose information and receive dose adjustment advice from a nurse with experience in the management of diabetes. Use of telemedicine techniques to upload blood glucose readings and information about patient-led adjustments of insulin dosage offers potential benefits.
We have conducted a feasibility study of the use of a mobile-phone based system by patients with type 2 diabetes who had recently commenced insulin therapy but remained poorly controlled. Preliminary results from this study, including descriptions of the patient and telehealth nurse experiences, have been reported elsewhere. 3
Methods
Patients were recruited from large general practices (those with a list size exceeding 6500) in Oxfordshire. Eligible patients were identified according to their most recent HbA1c value. HbA1c is a measure of glycaemia over the lifespan of the red blood cells, typically 120 days. The target value in the UK is 7.5% or less for people with diabetes. Patients with an HbA1c exceeding 7.5% who were treated with a basal insulin regimen that had been commenced within the previous 12 months were identified from the practice records and invited to participate in the study. (Basal insulin has a long-acting activity profile, with a blood glucose lowering effect lasting throughout the day.) Patients unable to use a mobile phone for visual or sensory reasons, or who were unable to self-monitor their blood glucose, were excluded from the study. The study duration was six months, with clinical assessments at baseline, three months and study exit. The study was approved by the appropriate ethics committee.
All patients who agreed to participate in the study received the intervention and were provided with a mobile phone (Nokia 6300) with pre-loaded software (t+ Medical, Abingdon, UK), a blood glucose meter (OneTouch Ultra) and a Bluetooth cradle to link the meter to the phone. The mobile phone application presented the patient with an electronic diary, with questions as shown in Figure 1. The first question asked the time since the patient's last meal (0–1 hour, 1–2 hours, 2–4 hours, 4–8 hours, or more than 8 hours) to allow assessment of blood glucose levels in the context of post-prandial response. A duration of eight hours or more since the previous meal was considered to indicate a fasting state. Blood glucose readings were then downloaded from the meter via a Bluetooth connection, and the most recent value was shown on the phone screen. The patient was then asked to assess their expected degree of physical activity, and finally a colour-coded time-series of previous blood glucose readings was shown. The patient was invited to select an appropriate dose of insulin and to enter this in the diary, which was then automatically transmitted to a server while additional feedback was shown to the patient.
Phone diary screens (a) to (e)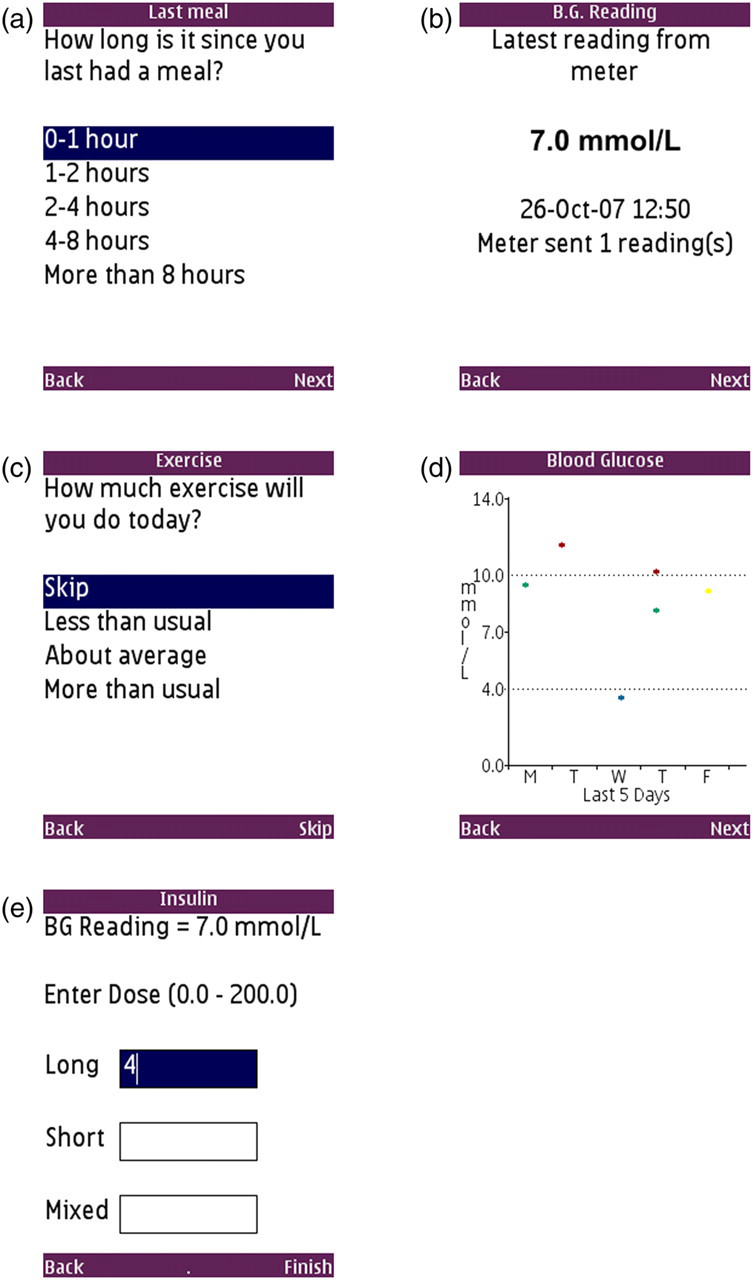
Patients were instructed to measure their fasting blood glucose each day prior to breakfast and use these values to adjust their insulin dose using a self-titration algorithm, 4 increasing the dose by 2 units every three days if two of the previous three days' fasting readings exceeded 6.7 mmol/L, provided that no reading was below 4.0 mmol/L.
A specialist diabetes nurse reviewed the patients' data every two or three days using a secure website, and contacted the patient if any of the following conditions were met:
Blood glucose readings were not received for three or more days; There were seven or more days with fasting blood glucose above 7.5 mmol/L; There was a single hypoglycaemic blood glucose reading below 4.0 mmol/L; Any other situations which were of concern, at the nurse's discretion.
The nurse provided general advice, motivation and assisted with technical problems. The nurse could also contact the general practice staff so that they could give appropriate medical advice and suggest any necessary dose modifications in addition to those already made by the patient.
Study outcomes
The primary outcome of the study was the change in HbA1c observed between baseline and six months. If a patient withdrew from the study, their baseline HbA1c measurement was carried forward, indicating no change in HbA1c due to the study. The mean change in HbA1c was assessed using a two-tailed paired t-test at the 5% level.
Phone-use compliance was measured for each patient as the proportion of days within a defined period (either six months to examine compliance over the duration of the study, or in weekly windows to assess trends over time) when the phone software was used at least once. Similarly, the blood glucose monitoring compliance indicated the proportion of days with at least one blood glucose reading; fasting reading compliance indicated the proportion of days when a fasting blood glucose reading was identified in the phone diaries; and insulin recording compliance showed the proportion of days for which insulin doses were recorded on the phone.
The changes in glycaemia during the study were evaluated by calculating the mean and SD of the blood glucose readings for all patients for each week-long period. A linear regression applied to the series of mean values illustrated the glycaemic trend.
The change in insulin dosage was found as the difference between the daily dose recorded at baseline and six months. As with the HbA1c measurements, this was evaluated using a two-tailed paired t-test at the 5% level. The insulin doses recorded daily on the phone were used to assess patients' responsiveness to increasing their insulin dose, by evaluating the number of days on which they titrated their doses as expected. However, it was necessary to pre-process the doses recorded on the phone to remove extraneous day-to-day variation introduced by variable recording patterns, as explained below.
Direct analysis of the insulin doses recorded by the patients on their mobile phone was not possible due to variable patterns of recording the individual doses. In general, such variation was caused by a combination of factors, including patients not recording an insulin dose on a given day or recording an insulin dose multiple times. In addition, for patients on a twice-daily insulin regimen, some variation was caused by their recording only one of the two doses and by patients switching between entering the two doses separately and recording the total dose in one diary. Pre-processing was therefore necessary to remove this variability before analysis.
A linear interpolation between the clinically-recorded doses provided a daily estimate of the injected insulin dose. The number of doses actually entered on the phone each day was scaled by the ratio of the expected daily dose over the total dosage recorded on the phone, providing an estimate of the number of doses which would be expected each day. This estimate was relatively consistent for each patient. The recorded doses were then filtered depending on whether the patient generally recorded once or twice a day by selecting the median dose entered in each 12- or 24-hour period. Any transient artefacts were removed by applying a three-point median filter to the resulting series. Although this method may filter out some valid transients from the insulin data, for example when the dose is increased one day and reduced the following day, such a procedure was required to remove the large variations which are observed as a result of the variability in recording patterns.
Results
Baseline patient characteristics
After six months there was a mean reduction in HbA1c of 0.66% (95% CI: −0.002, 1.32; P = 0.05) in the 23 patients. The reduction was 0.69% (95% CI: −0.001, 1.38; P = 0.05) for the 22 patients who completed the study.
Compliance
The 22 patients who successfully completed the study used the system for a mean of 217 days (range 162–376).
A high level of blood glucose monitoring compliance was observed, with a mean of 89% of patient-days (SD 12) containing at least one blood glucose reading. The phone-use compliance was much lower at 50% of patient-days (SD 30).
The monitoring compliance was 43–100%, with 21 of the 22 patients demonstrating a compliance of 75% or higher. However the phone-use compliance was 2–100%. The two patients with the lowest phone-use compliance (2% and 6%) demonstrated very high rates of glucose monitoring (97% and 86%).
The differences in the two indices of compliance are summarised in Figure 2. As some patients finished the study before 182 days had elapsed, compliance in the final weeks would be expected to decrease. The weekly compliance was adjusted by averaging the compliance over the number of patients still in the study, rather than the full 22-patient cohort – this is also shown in Figure 2. With this adjustment, the blood glucose monitoring compliance remained constant throughout the study (with a small decrease over six months of 0.09 fewer days per week containing a blood glucose reading), whereas phone-use compliance decreased considerably over the same period (by the equivalent of 2.1 fewer days per week of phone-use). This suggests a decreasing dependence on the mobile phone as the titration progressed, which is not surprising as patients reach a steady-state dose of insulin and glycaemic control once titration is completed.
Variation in blood glucose monitoring and phone-use compliance during the six-month study. A linear trend line is also shown for each series. The dotted lines beyond week 23 indicate the weekly averages calculated for all 22 patients, whereas the solid lines are adjusted for the number of patients still in the study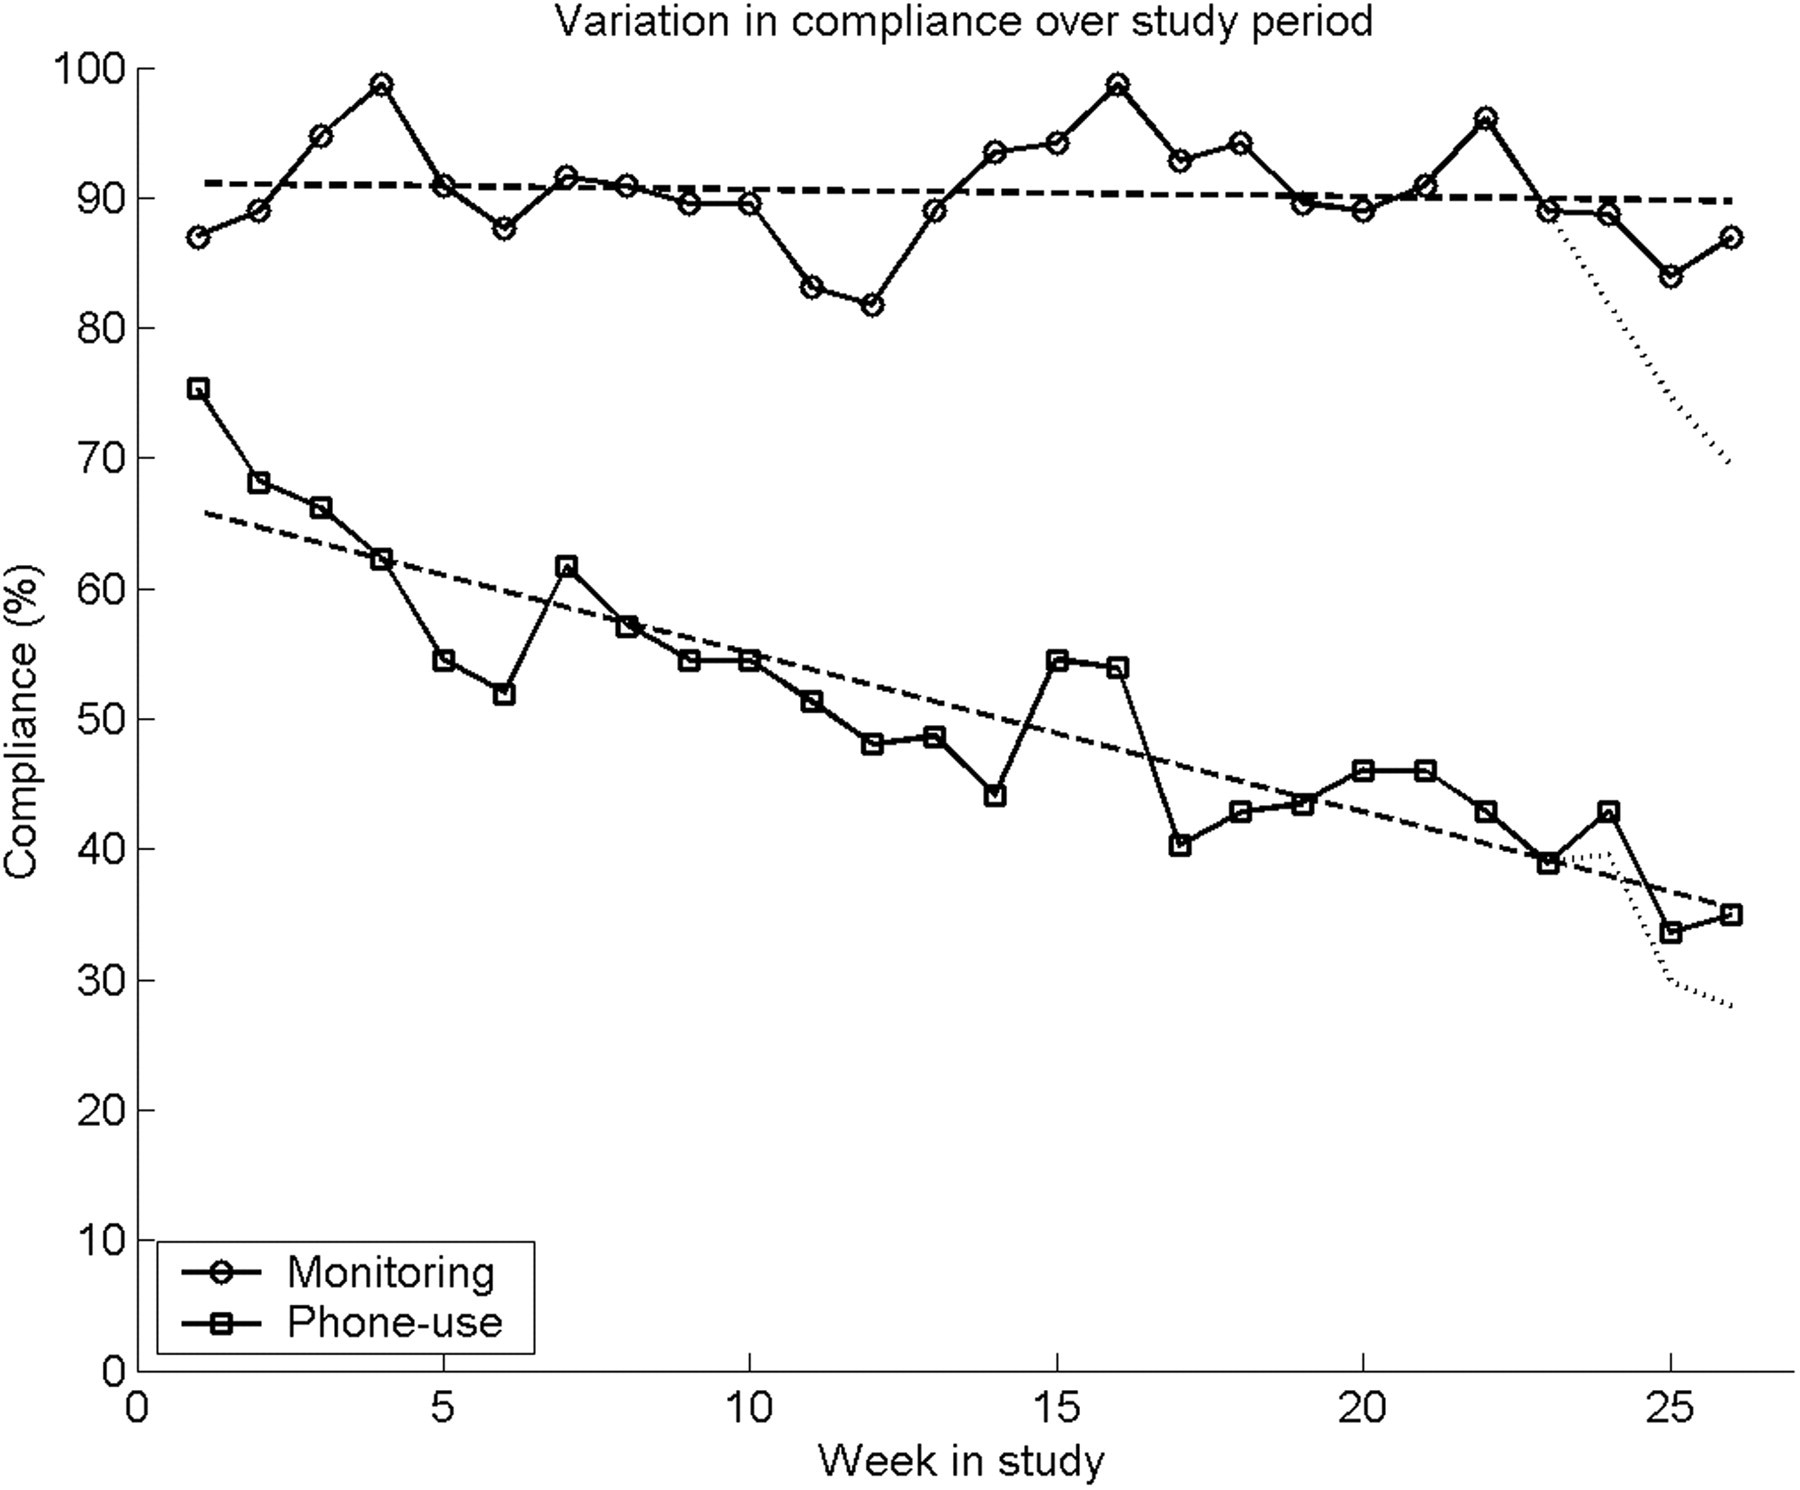
In addition to the blood glucose readings, other data collected via the mobile phone were the daily insulin doses and fasting blood glucose (FBG) readings. Whether or not a reading was classified as a fasting reading was inferred from the diary question about the time elapsed since the last meal. It was necessary for a diary to be completed at the same time as the fasting blood glucose was measured (along with the choice of ‘eight or more hours’ in response to the question ‘How long is it since you last had a meal?’), whereas the insulin doses could be entered in the diary at any time of day and not necessarily at the actual time of injection. As both the insulin and FBG data were extracted from the phone diaries, the compliance rates associated with these were limited by the phone-use compliance described above. The insulin-recording compliance closely matched the phone-use compliance, at 45% (SD 34), indicating that on nearly every day that the patients used the phone they would record their insulin dose. However, the fasting-reading compliance was much lower at 30% (SD 27).
Glycaemia
The weekly mean blood glucose values are shown in Figure 3a, along with a linear regression based on the mean values. The regressed blood glucose decreased by 1.7 mmol/L, from 10.5 to 8.8 mmol/L over the six months, and a slightly larger decrease (2.1 mmol/L) was observed between the actual values for weeks 1 and 26, from 11.3 mmol/L (SD 5.3) to 9.2 mmol/L (SD 3.4). The reductions in both mean and SD indicate an overall improvement in glycaemic control and stability.
Variation in blood glucose (a) and fasting blood glucose (b) during the six-month study period, averaged across all patients. Mean values shown with error bars of one SD. The broken line is the linear regression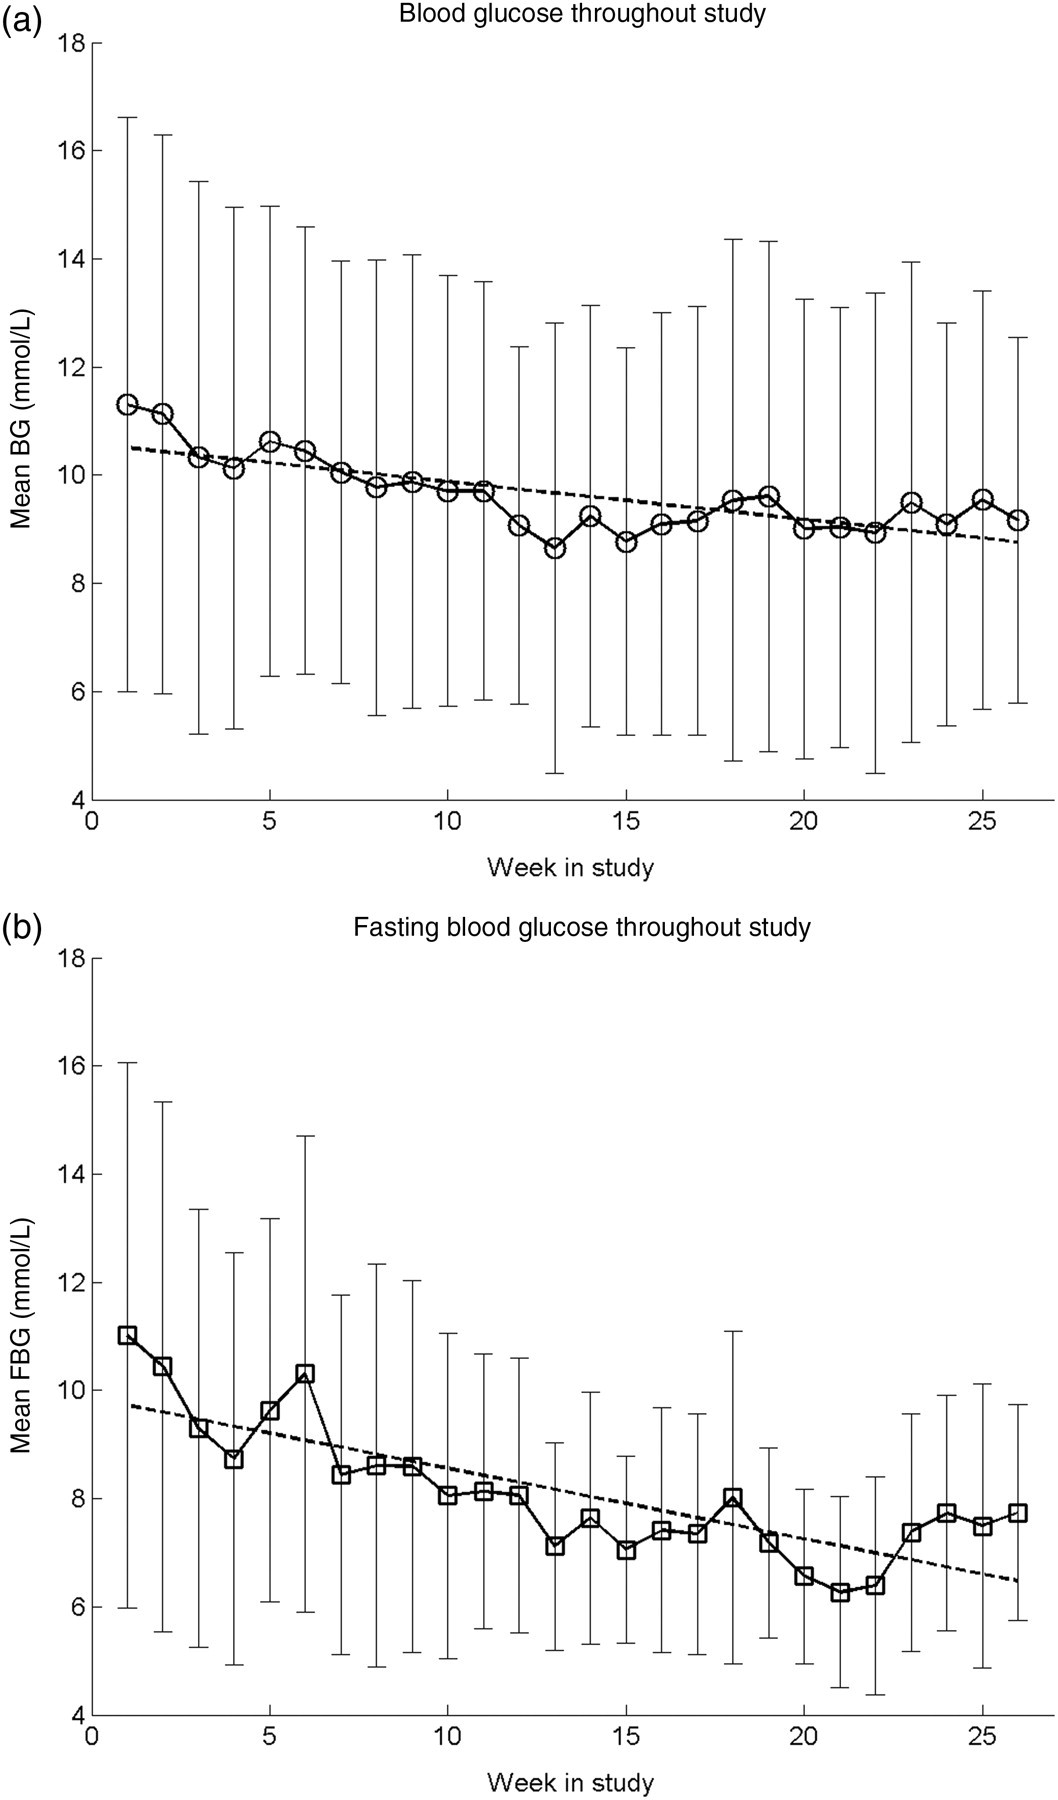
The fasting blood glucose readings are summarised in Figure 3b. A decrease in the fasting blood glucose trend of 3.3 mmol/L, from 9.7 to 6.5 mmol/L was observed, which is in good agreement with the decrease (3.3 mmol/L) between the first and last weeks, from 11.0 mmol/L (SD 5.0) in week one to 7.7 mmol/L (SD 2.0) in week 26. This was achieved without any apparent increase in the occurrence of hypoglycaemia. Over the duration of the study, 2.4% of the submitted fasting blood glucose readings were below 4 mmol/L.
Insulin dosage
The changes in insulin dose for each patient are illustrated in Figure 4, showing the baseline dose, three-month interim dose and final dose after six months. An increase of 10 units (95% CI: −0.6, 21; P = 0.06) was observed after three months, increasing further to 17 units (95% CI: 5.5, 28; P = 0.006) by the end of the study.
Clinically reported daily insulin dosage at study entry, and follow-up after three and six months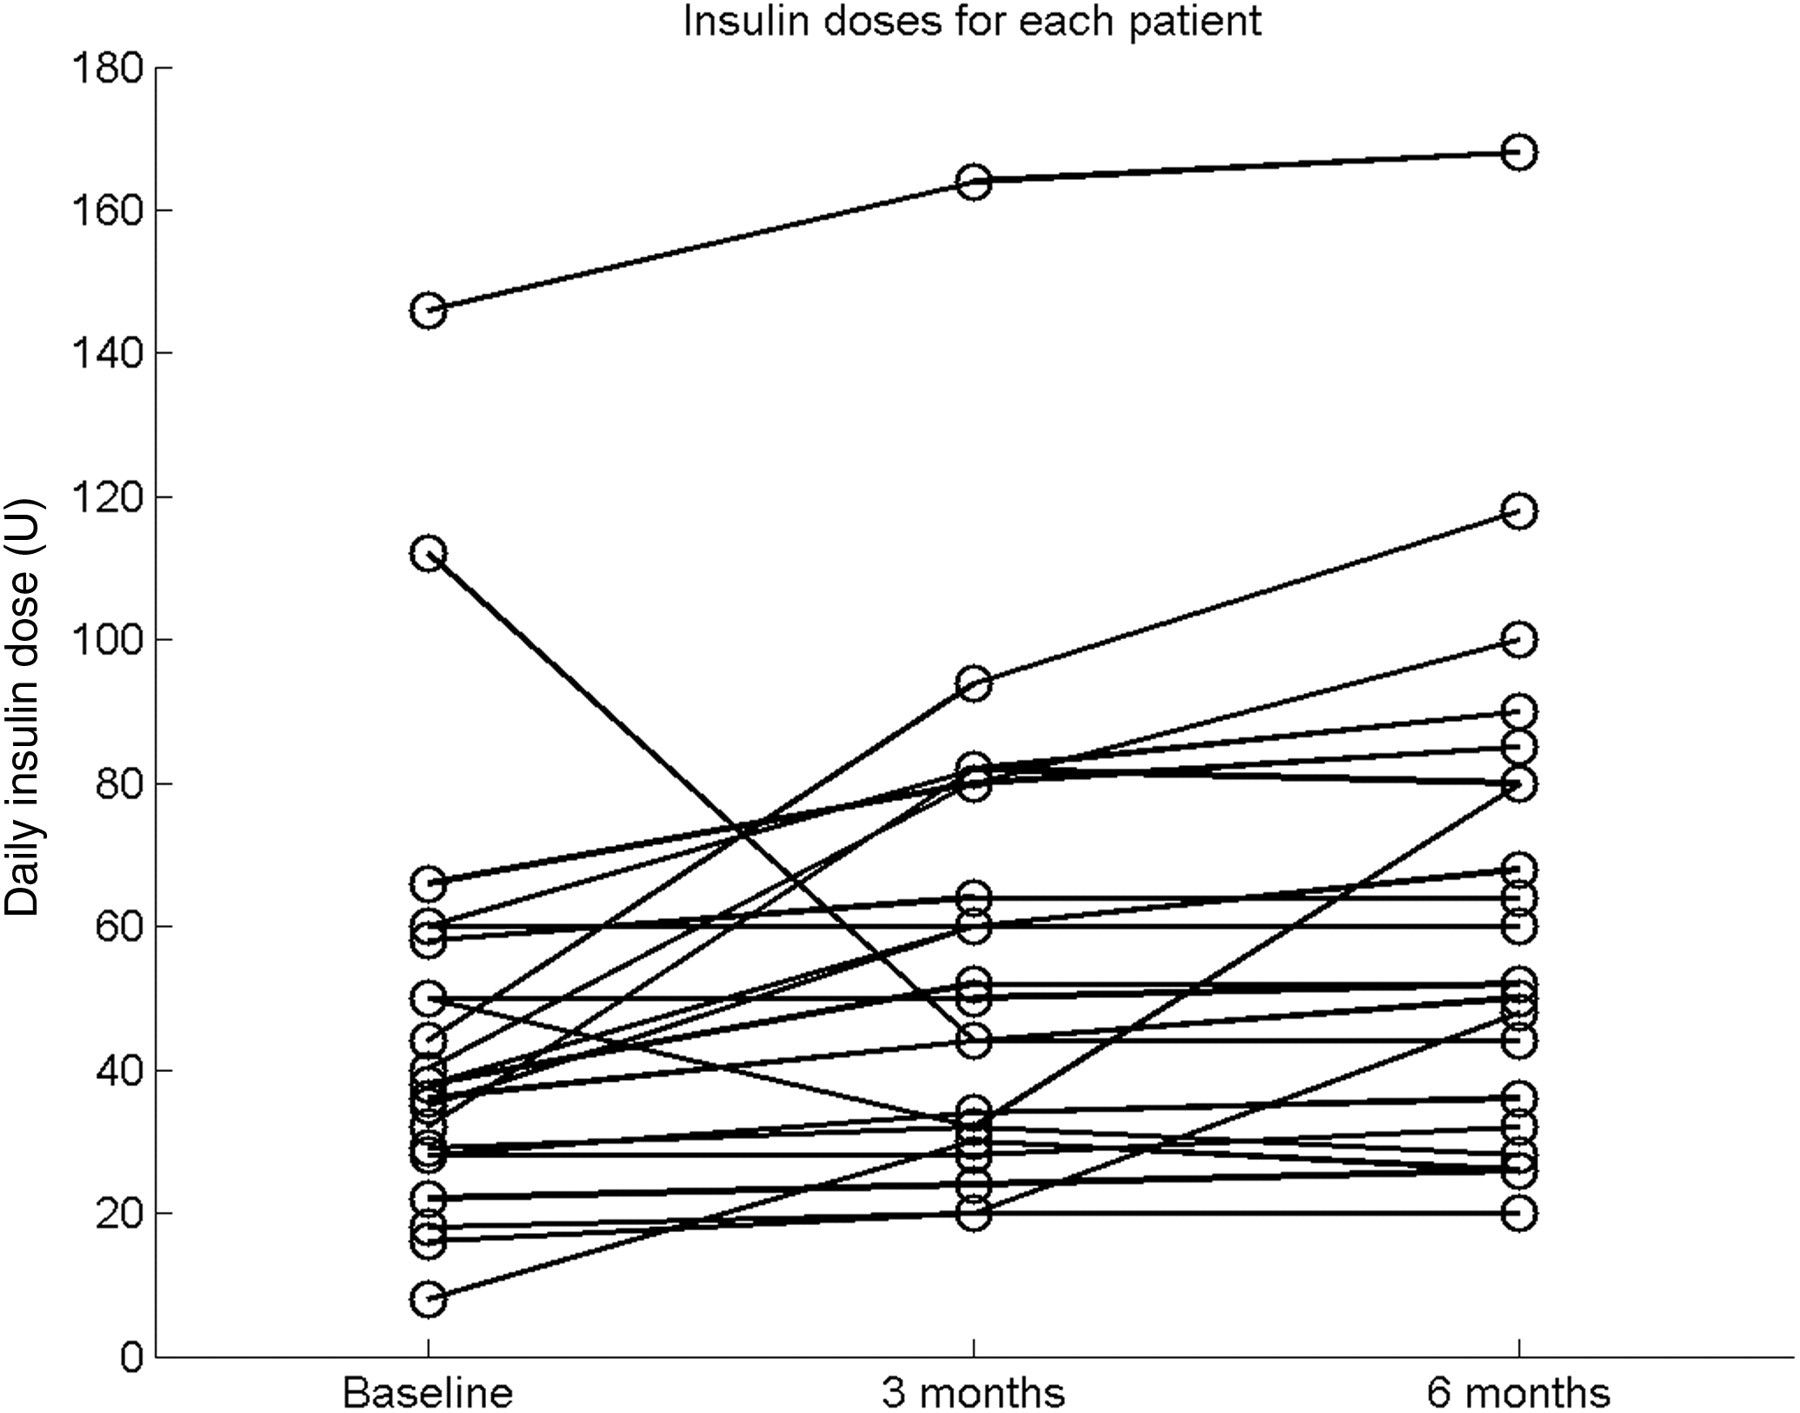
The apparent daily total insulin doses recorded using the mobile phone software varied by as much as 136 units from one day to the next. The filtering process described previously was used to remove this variation due to changes in recording behaviour, as illustrated in Figure 5.
Demonstration of pre-processing of phone-recorded insulin doses. From the top, are shown the daily insulin dose recorded on the phone (top), the filtered doses using the expected number of doses per day (middle), and finally the doses calculated after applying a three-point median filter (bottom). In each plot, the dosage recorded in the clinical notes are also shown with circular markers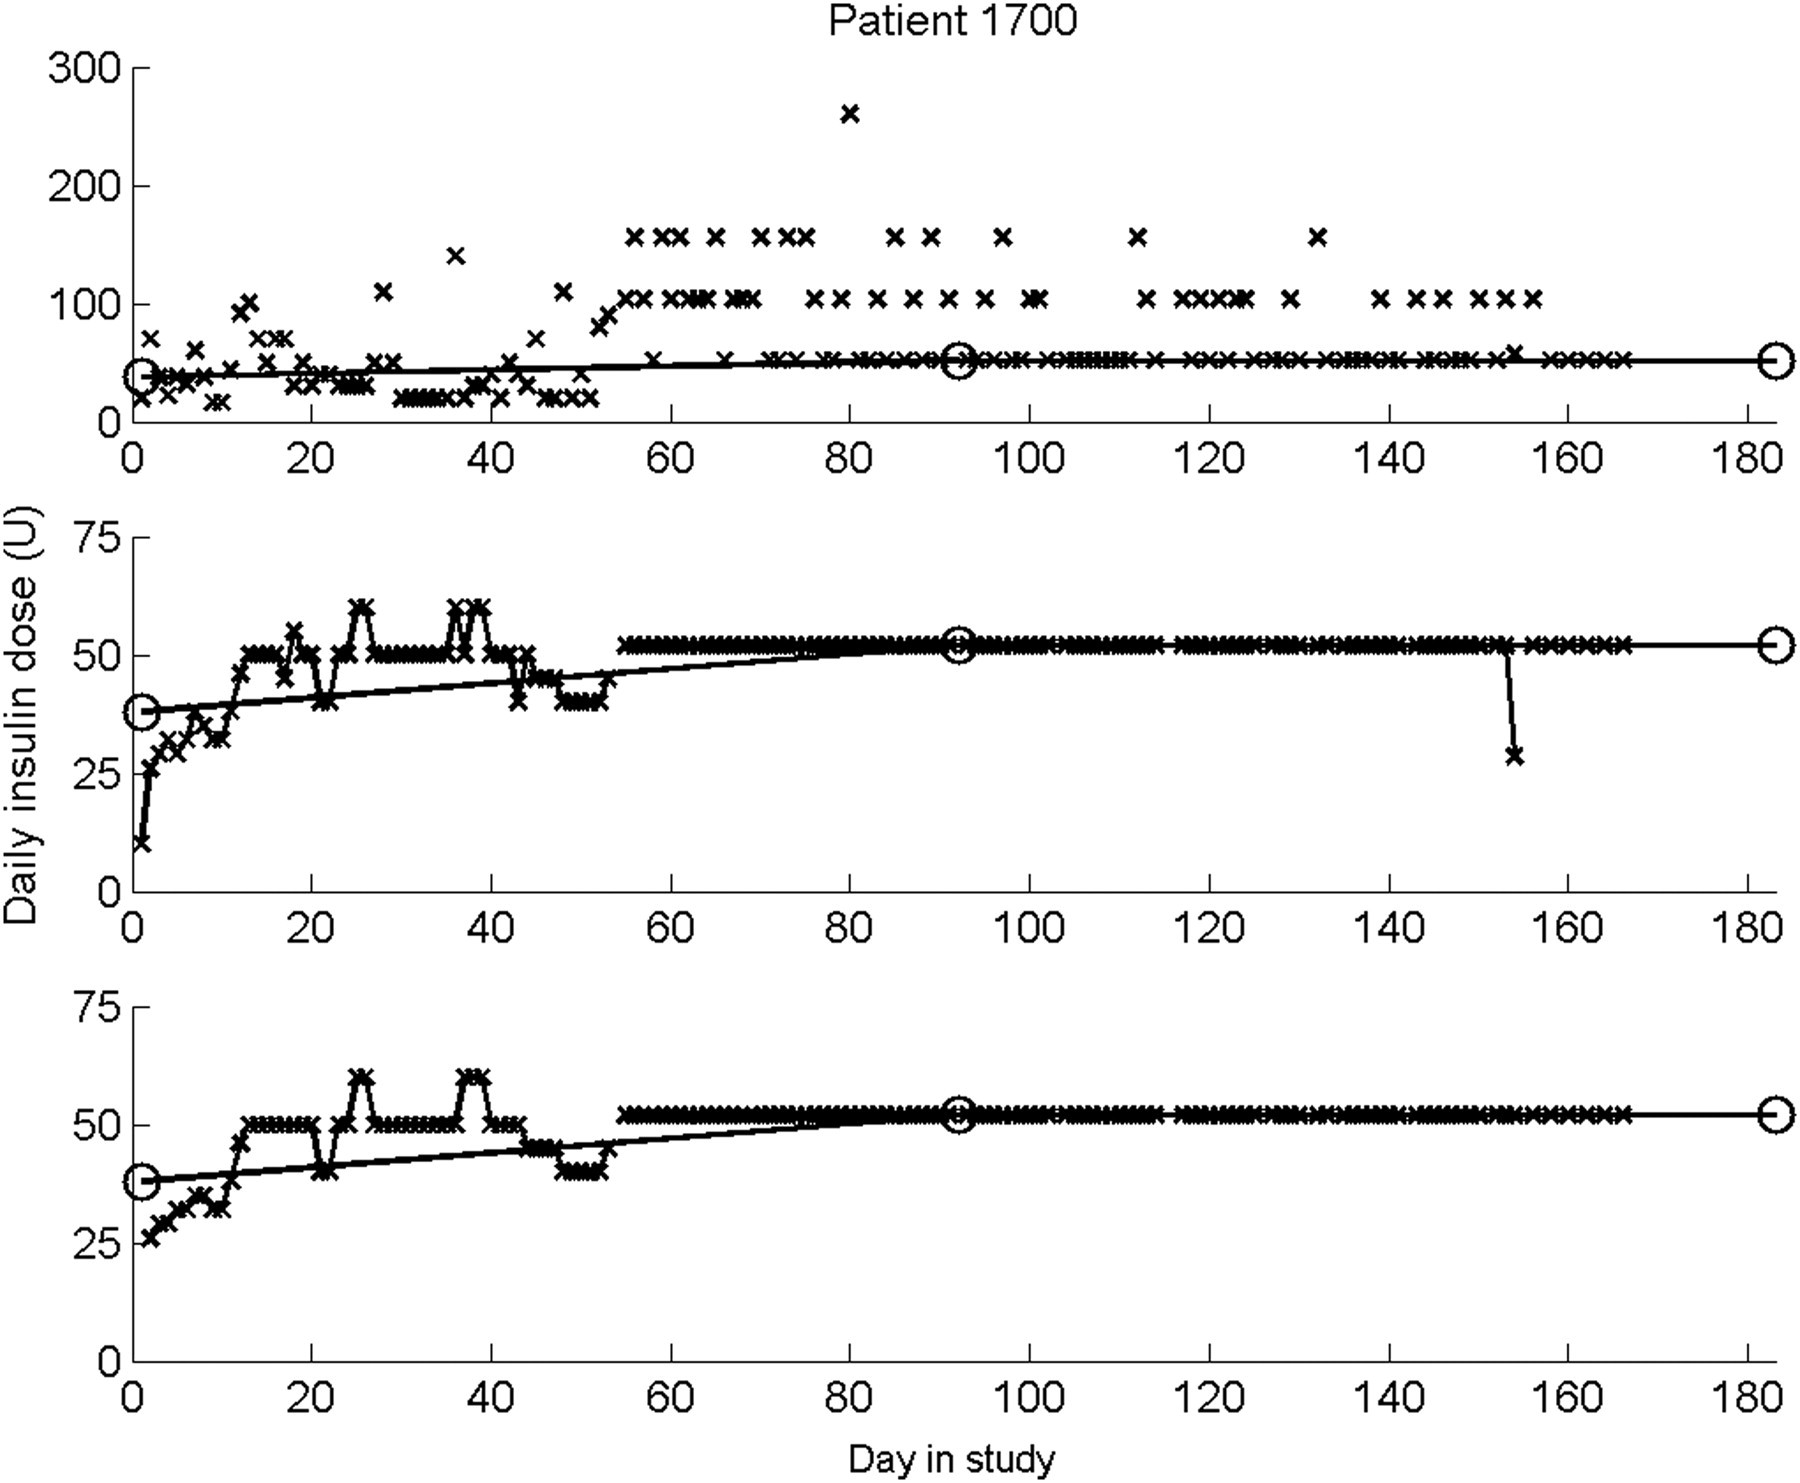
Insulin dose adjustment
Frequency of actual and expected increases in insulin dose
Although dose decreases were not expected, there were a number of occasions on which this was observed (see Table 2). Conversely, a dose increase would have been suitable in over half of the included days, although only 40 increases from one day to the next were actually observed (7 + 2 + 1 + 2 = 12 occasions when no change was suggested; 17 + 4 + 5 + 2 = 28 occasions when a 2 insulin unit increase was suggested).
Discussion
The mobile-phone based system was used in a feasibility study of insulin dose optimisation by 23 patients (with one withdrawal) and was associated with a decrease in blood glucose of 1.7 mmol/L and a decrease in fasting blood glucose of 3.3 mmol/L. There was a mean increase in insulin dosage of 17 units. The glycaemic improvement was a decrease in HbA1c of 0.66% after six months. The lack of a control group was a limitation of the study, and therefore the efficacy of the intervention needs to be confirmed in a randomised controlled trial.
Despite these promising results, the use of the mobile phone as part of the intervention needs to be reviewed critically. Blood glucose (and fasting blood glucose) levels improved during the study (Figures 2 and 3), with a consistent level of monitoring compliance but with decreasing phone usage. This indicates that glycaemic improvement may have continued despite a reduced use of the system. Possible explanations include a reduced need to adjust dosage; a reliance on titrating using one or more recent fasting blood glucose values rather than three consecutive readings as specified by the study protocol; and a learning effect from use of the system. Intervention by the study nurse is also likely to have played a key role in improving HbA1c by providing support and advice, and affecting lifestyle factors beyond the insulin treatment.
Frequencies at which dose adjustments were performed, based on prior fasting blood glucose (FBG) readings and recorded insulin doses
Frequency of fasting glycaemic conditions under which patients increased their insulin dose, made no change, or increased the dose. The two fasting readings were selected from the preceding 7-day period
The top section of Table 4 shows the conditions under which patients increased their insulin dose, with the greatest frequency (75/106) occurring when both previous fasting readings were hyperglycaemic. This confirms that the correct conditions were generally present when the patients increased their dose. However, under these conditions, they did not always increase the dose, as there were many more occasions (577) when the dose remained unchanged, as well as eight occasions when the dose was decreased despite the elevated readings. Of the four occasions when both fasting readings were hypoglycaemic, no dose decreases were instigated. However, 34 decreases were observed in total, eight of which, as stated above, should have led to a dose increase. The general lack of observed dose increases is indicative of patient reluctance to increase their dosage, as previously mentioned, usually relating to anxiety about hypoglycaemia and weight gain.
An alternative analysis is to consider insulin data as per the protocol (that is, available on the same day and the previous day) but to relax the FBG criterion from an AND condition (as in the protocol: FBG readings on the same day AND the previous day AND two days prior) to an OR condition (FBG readings on the same day OR the previous day OR two days prior). On this basis, 78% (24+37+40+9+6+15/125+44) of all such dose adjustments were made with at least one fasting blood glucose reading within this period (see Table 3). This suggests that patients generally did adjust their insulin dose according to their recent fasting glycaemia within the previous three days, but not strictly according to the protocol which was probably too demanding.
The dosage adjustments throughout the study are shown in Figure 6 for two patients. These adjustments can be classified as rapid sequences of adjustments or slower adjustments over a longer period. For example, the patient in Figure 6a showed an initial stable period, which was followed by three dose increases in a short period, and then followed by a further three over a longer period. Similarly, the patient in Figure 6b went through a slow adjustment stage, rapid adjustments, and then another period of slow adjustments before stabilising at the maximum dose. These periods of rapid dose titration are likely to be patient-led, as frequent contact with the study nurse was not part of the protocol.
Demonstration of insulin titration, showing daily fasting blood glucose readings (with action limits at 4.0 and 6.7 mmol/L shown as dashed lines) and insulin dosage (solid line)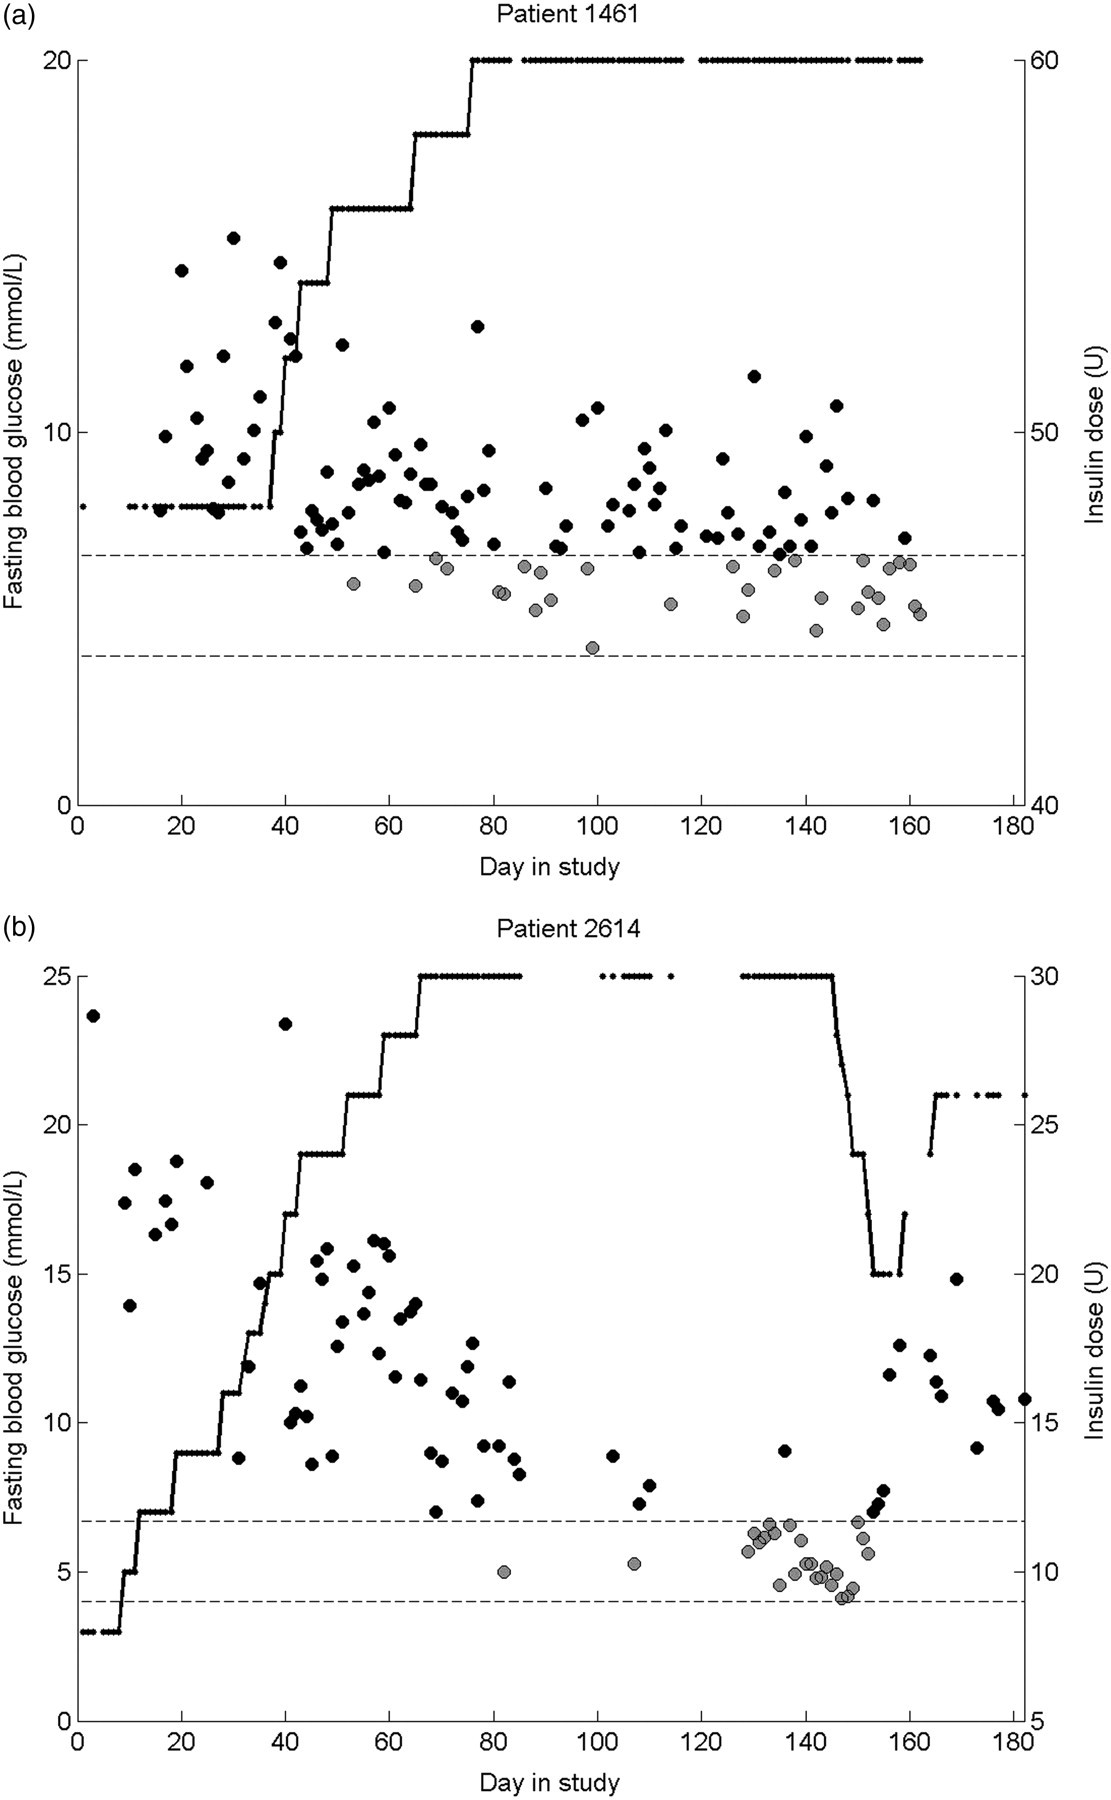
The lower than expected number of dose adjustments requires explanation, however. This may be related to how feedback was presented to patients on the mobile phone handset, as this was not consistent with the titration instructions. The graphical feedback used colour-coded bands of glycaemia, with normoglycaemic limits at 4 mmol/L and 10 mmol/L for all patients. The protocol-specified threshold for increasing the dose (6.7 mmol/L) was, therefore, within the green normoglycaemic range, and consequently patients may not have increased their dose because of this. This is exemplified by one patient who ceased to increase the insulin dose when the fasting glucose fell below 10 mmol/L, but remained above 6.7 mmol/L. Recalculating Table 4 using a hyperglycaemic limit of 10 mmol/L increases the percentage of cases for which there was compliance with the protocol-specified dose increases in the presence of two hyperglycaemic readings from 11% to 21%. However, 77% of these cases still did not result in a dose increase, indicating that there was a reluctance to increase the dose, independently of the visual feedback which may have introduced an element of confusion.
The use of telemedicine techniques in diabetes management has been well reported in the literature, and many studies have contained elements of blood glucose monitoring, insulin dose reporting and clinician-led treatment adjustments. 5 – 12 However, relatively little focus has been given to the area of patient-led insulin dose adjustments. In type 1 diabetes, the use of bolus dose calculations to determine an appropriate dose of short-acting insulin to match the carbohydrate content of a meal has been examined, 13 , 14 although this has little relevance to the adjustment of long-acting basal insulin in type 2 diabetes as explored in this study. The protocol for a web-based intervention for such basal adjustments has recently been described. 15 Fasting blood glucose readings are entered into an online patient diary, and dose adjustment advice is presented to the patient to increase their dose by 2 units after two consecutive days with fasting blood glucose readings raised above 7 mmol/L (or by 4 units if both readings exceed 10 mmol/L). Dose reduction advice is given when fasting readings fall below 4 mmol/L. As with the bolus dose calculations, each individual dose adjustment was directed by the telemedicine system. This contrasts with the method employed in the present study, in which general advice was given at the start of the study. This strategy was selected to encourage patient self-management through the interpretation of their glycaemic state and the adjustment of their own dose, rather than allowing patients to rely on an automatically-generated dose suggestion. Such a self-management strategy was also employed in the patient-led arm of a study comparing clinician-led versus patient-led dose adjustments of basal insulin. 4 Patients were seen in clinic every six weeks for 24 weeks, with additional telephone calls every two weeks. In the patient-led arm, fasting blood glucose decreased from 9.4 mmol/L to 6.1 mmol/L, and there was a corresponding insulin dose increase from 24 units to 45 units. The magnitudes of these changes are very similar to those reported in this study (although the change in HbA1c is larger, with an improvement of 1.2% in the patient-led titration group), but there was less frequent contact between patient and clinicians in our study protocol, thereby imposing less of a demand on health-care resources.
The results obtained in the present study are promising, with glycaemic improvements and dose escalations similar to other patient-led titration methods which have involved much more frequent clinician contact. A randomised controlled trial of patient-led insulin dose titration is now required to confirm the efficacy of this intervention.
In conclusion, use of the mobile-phone based system reported here supported the optimisation of insulin dose and was associated with improved glycaemic control. Patient self-titration was evident, although the strategies to achieve this may not have strictly followed the titration protocol, as demonstrated by the many adjustments made without the requirement for three fasting blood glucose readings from three consecutive days being met. Despite this, there remained a general reluctance to increase the insulin dose in the presence of hyperglycaemia. Additional support and encouragement may be required to overcome the barriers to dose optimisation.
Footnotes
Acknowledgements
The work was supported by the NIHR Biomedical Research Centre, Oxford (which also funded ML and JT) and the NIHR School of Primary Care Research. Technical support was provided by t+ Medical (Abingdon, UK). Professor Tarassenko was a founder director of t+ Medical and has a minority shareholding in the company. He played no part in the conduct of the feasibility study and was not involved in the interpretation of the clinical data.