
Abstract
The total number of traffic fatalities has decreased in recent years. To further reduce the number of traffic fatalities, details regarding traffic fatalities and various aspects of traffic accidents must be studied. Therefore, this research examined the number of traffic fatalities by age group and the number of traffic fatalities by situation in Japan from 2003 to 2007, and the percentage of traffic fatalities by age group and the percentage of traffic fatalities by situation during the same period were calculated. In addition, aspects of traffic accidents in Japan were compared with those in Germany and France, and additional measures to counter traffic accidents that need to be taken in Japan in order to further reduce the number of traffic fatalities were studied. Results indicated that in each year of the period studied the highest percentage of traffic fatalities involved the 25–64 age group in Germany and France and the 65-or-over age group in recent years in Japan. In addition, additional measures to counter traffic accidents involving the elderly are needed in Japan, Germany and France. The percentage of traffic fatalities by situation indicated that attention should be paid to ‘fatalities of pedestrians’ in Japan and to ‘fatalities of motor vehicle occupants’ in all the three countries studied. In particular, measures to counter traffic accidents leading to ‘fatalities of pedestrians’ must be studied further in Japan. With the above findings in mind, bodies involved in implementing measures to counter traffic accidents must formulate specific measures.
Introduction
In recent years, the total number of traffic fatalities has decreased significantly in Japan. 1 This may be due to various aspects of measures to prevent traffic accidents. 2 A report 2 noted that the increase in rates of seat belt wear in the back seat may have led to the further decrease in traffic fatality rates. In Japan, criteria for determining driving while intoxicated were enhanced and administrative penalties for the offense were made more severe starting in the first half of this decade. 3 A report 4 noted that one of the reasons for the decrease in the number of traffic fatalities was the result of measures taken by police, and an enhanced emergency health-care system is also a reason for the decrease in the number of traffic fatalities. A report 4 discussed various aspects of traffic accident deaths. Hotta et al. 5 indicated that three social factors affected traffic accident fatalities by sex and age group in the years studied. Detailed research is crucial to a further decrease in the number of traffic fatalities in Japan, and additional measures to prevent traffic accidents should be discussed based on the results. To that end, recent traffic accident deaths by age group and traffic accident deaths by situation must be ascertained in Japan, and Japan should be compared with other countries in terms of these parameters.
Materials and methods
This study examined the number of traffic fatalities by age group and the number of traffic fatalities by situation in Japan, Germany and France from 2003 to 2007 as reported by the National Police Agency. 1 In the report by the National Police Agency, data from countries other than Japan were from the International Road Traffic and Accident Database (IRTAD). The percentage of traffic fatalities by age group and the percentage of traffic fatalities by situation in the three countries were also calculated during the period studied. Data on the number of traffic fatalities by age group and the number of traffic fatalities by situation in this study referred to deaths within 30 days of the traffic accident occurring. Traffic fatalities were grouped by age as fatalities of individuals under the age of 17, aged 18–24, aged 25–64 and age 65 or over. Traffic fatalities were classified by situation as ‘fatalities of motor vehicle occupants’, ‘fatalities of motorcycle riders and passengers’, ‘fatalities of moped riders and passengers’, ‘fatalities of bicycle riders’, ‘fatalities of pedestrians’ and ‘other fatalities’. Japan, Germany and France were compared in terms of these fatalities by age group and situation, and additional measures to prevent traffic accidents in Japan were indicated based on the results, particularly with regard to the percentage of traffic fatalities.
Results and discussion
The number of traffic fatalities by age group in Japan, Germany and France during the period studied is shown in Figures 1a, b and c.

Number of traffic fatalities by age group in Japan (a), Germany (b) and France (c) during the period studied
During the period studied, the percentage of traffic fatalities by age group in Japan ranged from a minimum of 4.19% in 2007 to a maximum of 5.52% in 2003 for the under-17 age group and from a minimum of 9.71% in 2006 to a maximum of 10.87% in 2003 for the 18–24 age group. The percentage ranged from a minimum of 37.64% in 2007 to a maximum of 42.46% in 2003 for the 25–64 age group and from a minimum of 41.15% in 2003 to a maximum of 48.43% in 2007 for the 65-or-over age group. The percentage of traffic fatalities by age group in Germany ranged from a minimum of 5.80% in 2007 to a maximum of 7.92% in 2003 for the under-17 age group and from a minimum of 19.62% in 2007 to a maximum of 21.72% in 2004 for the 18–24 age group. The percentage of traffic fatalities for the 25–64 age group and 65-or-over age group ranged from a minimum of 50.50% in 2004 to a maximum of 51.37% in 2006 and from a minimum of 20.10% in 2003 to a maximum of 23.30% in 2007. The percentage of traffic fatalities for the under-17 age group in France ranged from a minimum of 7.56 (detailed: 7.560)% in 2006 to a maximum of 8.19% in 2003. The percentage of traffic fatalities for the 18–24 age group ranged from a minimum of 21.23% in 2007 to a maximum of 23.46% in 2004. The percentage for the 25–64 age group ranged from a minimum of 49.90% in 2006 to a maximum of 51.58 (detailed: 51.582)% in 2004. The percentage of traffic fatalities for the 65-or-over age group ranged from a minimum of 17.16% in 2004 to a maximum of 19.13 (detailed: 19.1342)% in 2007.
The number of traffic fatalities by situation in Japan, Germany and France during the period studied is shown in Figures 2a, b and c.
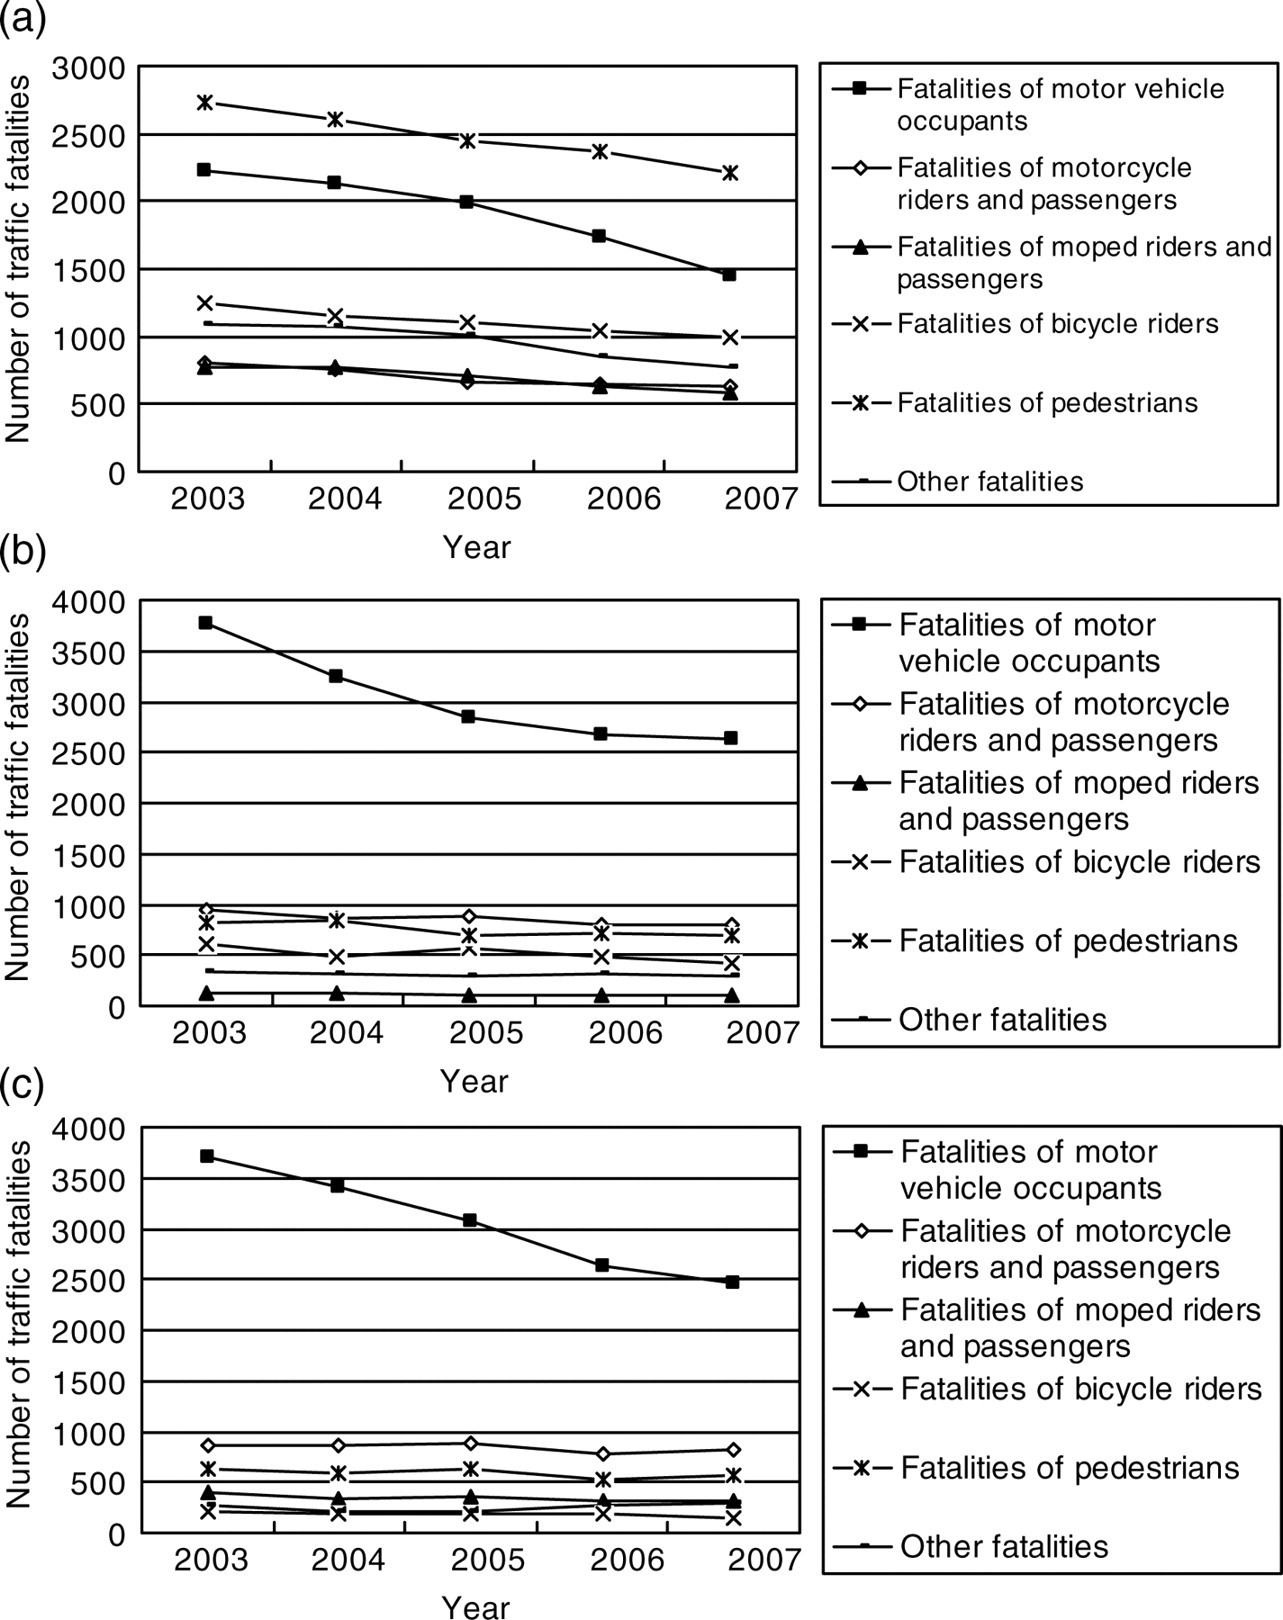
Number of traffic fatalities by situation in Japan (a), Germany (b) and France (c) during the period studied
The percentage of traffic fatalities by situation in Japan ranged from a minimum of 21.78% in 2007 to a maximum of 25.14% in 2004 for ‘fatalities of motor vehicle occupants’. The percentage of traffic fatalities ranged from a minimum of 8.38% in 2005 to a maximum of 9.41% in 2007 for ‘fatalities of motorcycle riders and passengers’ and from a minimum of 8.63% in 2003 to a maximum of 9.07% in 2004 for ‘fatalities of moped riders and passengers’. The percentage of traffic fatalities ranged from a minimum of 13.51% in 2004 to a maximum of 14.90% in 2007 for ‘fatalities of bicycle riders’, from a minimum of 30.72% in 2004 to a maximum of 33.27% in 2007 for ‘fatalities of pedestrians’ and from a minimum of 11.63% in 2006 to a maximum of 12.81% in 2005 for ‘other fatalities’. The percentage of traffic fatalities by situation in Germany ranged from a minimum of 52.70% in 2006 to a maximum of 57.07% in 2003 for ‘fatalities of motor vehicle occupants’ and from a minimum of 14.31% in 2003 to a maximum of 16.32% in 2005 for ‘fatalities of motorcycle riders and passengers’. The percentage of ‘fatalities of moped riders and passengers’ ranged from a minimum of 2.00% in 2005 to a maximum of 2.10% in 2006. The percentage of traffic fatalities ranged from a minimum of 8.13% in 2004 to a maximum of 10.73% in 2005 for ‘fatalities of bicycle riders’, from a minimum of 12.28% in 2003 to a maximum of 14.34% in 2004 for ‘fatalities of pedestrians’ and from a minimum of 5.01% in 2003 to a maximum of 6.11% in 2006 for ‘other fatalities’. The percentage of traffic fatalities by situation in France ranged from a minimum of 53.33% in 2007 to a maximum of 61.22% in 2003 for ‘fatalities of motor vehicle occupants’, from a minimum of 14.18% in 2003 to a maximum of 17.97% in 2007 for ‘fatalities of motorcycle riders and passengers’ and from a minimum of 6.13% in 2004 to a maximum of 7.03% in 2007 for ‘fatalities of moped riders and passengers’. The percentage of traffic fatalities ranged from a minimum of 3.07% in 2007 to a maximum of 3.84% in 2006 for ‘fatalities of bicycle riders’, from a minimum of 10.33% in 2003 to a maximum of 12.14% in 2007 for ‘fatalities of pedestrians’ and from a minimum of 3.70% in 2004 to a maximum of 6.45% in 2007 for ‘other fatalities’.
Based on results in the percentage of traffic fatalities, the 25–64 age group had the highest percentage of traffic fatalities in Germany and France in all of the years of the period studied, and in Japan the 25–64 age group had the highest percentage of traffic fatalities in 2003 while the 65-or-over age group had the highest percentage of traffic fatalities from 2004–2007. Characteristic of Japan is a high percentage of traffic fatalities for the 65-or-over age group. In all three countries, the percentage of traffic fatalities for the 65-or-over age group in 2006–2007 increased from the percentage in 2003–2004.
Analysis of the percentage of traffic fatalities by situation indicated that ‘fatalities of pedestrians’ were highest in Japan and ‘fatalities of motor vehicle occupants’ were highest in Germany and France in all of the years studied. The second highest percentage of traffic fatalities in Japan was for ‘fatalities of motor vehicle occupants’.
Therefore, Japan is, in comparison with Germany and France, characterized by a high percentage of traffic fatalities involving the elderly and a high percentage of traffic fatalities involving pedestrians. In addition, in all three countries attention must be paid to targeting measures to counter traffic accidents at the elderly as a group. The elderly are, as vulnerable road users, often injured in traffic accidents, and these individuals often already have some underlying condition when injured in an accident. 6 Results of a study 7 of traffic accidents involving pedestrians indicated that victims readily suffered a head injury from striking a car hood or leg injuries from a car bumper. That study 7 also revealed that injury to the head or legs due to vehicular impact was more severe than that due to contact with the pavement. In Japan, measures to counter traffic accidents have been taken in various areas. 3,8 In terms of measures to counter traffic accidents, enhancing measures to counter traffic accidents involving the elderly and traffic accidents involving pedestrians may further reduce traffic accident deaths in Japan. Bodies involved in implementing measures to counter traffic accidents must study more specific measures by understanding the nature of the results presented here.
The present study is mainly a discussion based on results in terms of the percentage of traffic fatalities. Studies from various perspectives, including that presented here, are needed to further reduce traffic accident deaths in Japan.