




Abstract
Objective
To evaluate phase-contrast velocity mapping (PCVM) as a diagnostic tool for pelvic congestion syndrome and comparing this approach with direct venography.
Method
We prospectively include nine women with clinical suspicion of pelvic congestion syndrome during a six-month period. All patients underwent a magnetic resonance phase-contrast scan before a direct venography. We considered a case of pelvic congestion syndrome when the PCVM showed a retrograde or slow (less than 5 cm/second) flow in any gonadal vein. This criterion was compared with the standard diagnostic criterion observed from a direct venography.
Results
Using direct venography we found 14 abnormal veins and all of them were correctly identified by the PCVM. The other four veins were found to be normal by the direct venography. However, two of them (the same patient) were abnormal in the PCVM, even though this patient had the classical symptoms of pelvic congestion syndrome.
Conclusion
PCVM is a useful tool for diagnosing pelvic contrast syndrome and can avoid invasive procedures such as direct venography.
Keywords
Introduction
Pelvic congestion syndrome (PCS) is characterized by chronic pelvic pain, dysuria, dysmenorrhea and dyspareunia. These symptoms are associated with varicose veins in the female pelvis and atypical zones like vulvae and buttocks. 1 These dilated veins are originated from anomalous flow (slow or retrograde) in the ovarian veins 2 (OV), which is more frequent in multiparous women. 3
The dilation of the OV may explain the symptoms of venous insufficiency. 4 The normal diameter of the OV is 3.1 ± 2 mm; however, there are at least two conditions that increase the diameter of the OV. Firstly, during pregnancy the OV becomes dilated owing to an increase in flow over 60 times its normal value 5 and, secondly, the congenital absence of valves in the OV, which occurs in up to 13–15% of women. 6
Several authors have suggested that direct venography (DV) is the gold standard technique to diagnose PCS, 7,8 although this is a matter of debate since non-invasive methods such as Doppler ultrasound (US) and magnetic resonance imaging (MRI) are increasingly gaining popularity. 9 DV is an invasive method that requires catheterization of the OV from jugular or femoral veins and the diagnosis is based on anatomical changes. To avoid invasive procedures, methods such as computed tomography (CT) or MRI have also been used to diagnose PCS. 10 However, diagnostic criteria derived from these approaches are also based on morphological features (vein diameter), which are not necessarily accurate since dilated veins are frequently found in asymptomatic women. 6,10,11
Another approach to diagnose PCS is to assess flow. Hobbs 1 described for the first time in 1976 the relationship between anomalous flow in OV, the presence of pelvic varicose veins (‘female varicocele’) and PCS as a clinical entity. Due to this relation, Doppler US has been used to detect flow abnormalities in the OV 11,12 and particularly transvaginal studies are becoming more frequently used. However, this technique depends on the adequate detection of signal, which can be difficult in case of slow flow or because of an inadequate acoustic window, even in transvaginal studies. 13,14
In this study we propose to use phase-contrast velocity mapping (PCVM) for assessing flow parameters in the OV. PCVM is an MRI-based method broadly described for the study of flow in several vascular territories. 15 It is based on the application of bipolar gradient pulses that induce a phase shift in moving protons, which is proportional to their velocity along the direction of the gradient. 15 Thus, PCVM allows detecting directionality and velocity of flows. We used these velocity parameters as a diagnostic criterion of PCS. To validate this method, results obtained from PCVM were compared with data obtained from DV.
Patients and methods
A prospective study included nine patients (mean age 44-years old, range 26–48-year old) who were sent to our institution with clinical suspicion of PCS within a six-month period. All patients underwent a DV and needed clinical evaluation with MRI. All patients signed an informed consent.
The criteria involved for this study were to have a history of chronic pelvic pain, for at least three months, localized and severe enough to cause functional disability. The pain should be exacerbated with standing position and associated with bladder irritability, varicosities in vulva, buttocks or thighs or dyspareunia. Patients with evidence of any other inflammatory disease were excluded from the study.
All patients were scanned with a 1.5 T Siemens Avanto MRI system. A cardiac-triggered PCVM sequence was performed with the following imaging parameters: one slice with a thickness of 4 mm, acquisition matrix of 144 × 192 pixels, resolution of 1 × 1 mm, repetition time (TR)/echo time (TE) = 45/7.6 ms, velocity encoding (VENC) = 10 cm/second and 16 frames with a temporal resolution of 62.5 ms approximately. The slice was acquired perpendicular to the OV and data were analysed with a home-made software written in Matlab (The Mathworks) to obtain velocity parameters.
Within one to two days after the MR scan, all patients underwent DV using a standard technique. 3
For the PCVM study, the criteria to diagnose PCS were the presence of slow anterograde flow velocity, i.e. peak velocity less than 5 cm/second, or retrograde flow. For the DV study, PCS was diagnosed when one or more of the following venographic findings were present: OV diameter greater than 6 mm; uterine venous engorgement; congestion of the ovarian plexus; filling of the pelvic veins across the midline or filling of vulvovaginal and thigh varicosities.
Results
Table 1 summarizes the findings in the 18 analysed veins using DV and PCVM. According to Table 1, 14 veins were found abnormal with the DV analysis. The PCVM analysis showed slow anterograde flow velocity or retrograde flow (Figures 1a and b) in all these veins. Mean and range peak velocity of the abnormal veins were 1.3 and −5 to 4.8 cm/second, respectively. There were four normal veins detected by DV; however, only two of them were identified as normal with PCVM (Figure 2a). In these veins, the peak velocities were 8 and 5.8 cm/second, respectively. In the remaining two veins (corresponding to a single patient), the PCVM analysis showed a slow anterograde flow (peak velocity was 1.1 cm/second in left OV and 2.8 cm/second in the right OV) but the DV did not show abnormalities (Figure 2b), despite the typical clinical symptoms presented in this patient.
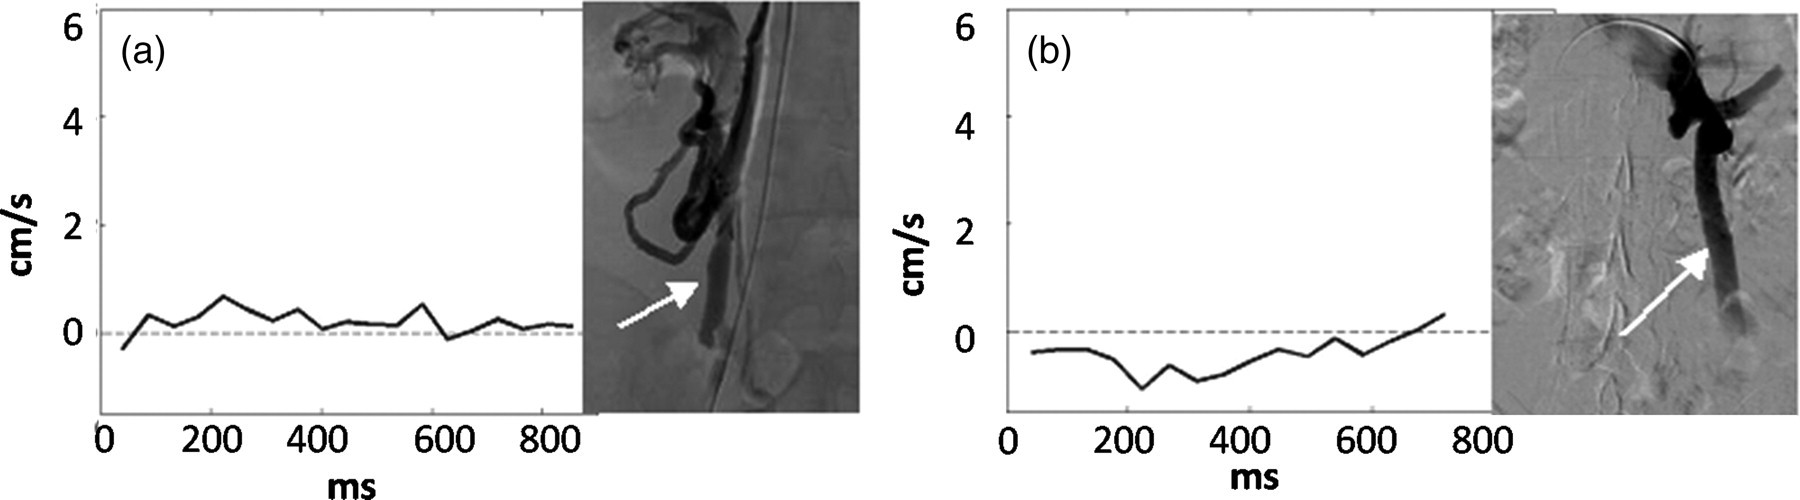
(a) A dilated right-ovarian vein with congestion of the ovarian plexus (arrow) is shown. The phase-contrast velocity mapping (PCVM) analysis demonstrates slow anterograde flow (flow peak less than 5 cm/second); (b) Direct venography shows a dilated right-ovarian vein (diameter greater than 6 cm). The PCVM demonstrates reverse flow

(a) Direct venography (DV) shows a right-ovarian vein of normal diameter (less than 6 cm) and without significant reflux or congestion of the pelvic veins (arrow). This normal vein was correctly identified by the phase-contrast velocity mapping (PCVM) with a flow peak greater than 5 cm/second. (b) In this case, there was a discrepancy between DV and PCVM. While DV shows a normal left-ovarian vein, the peak velocity of blood flow detected by PCVM was slow (less than 5 cm/second)
Comparative table of findings using direct venography and phase-contrast velocity mapping in women suspected of pelvic congestion syndrome
OVD, ovarian vein diameter; UVE, uterine venous engorgement; CVP, congestion of the ovarian plexus; FPVAMV, filling of the pelvic veins across the midline or filling of vulvovaginal; TV, thigh varicosities; RF, retrograde flow; PV, peak velocity
Additionally, we observed that normal OV (detected by PCVM) showed a homogeneous (laminar) flow pattern (Figure 3a), whereas abnormal OV showed a turbulent flow pattern throughout the cardiac cycle (Figure 3b).

Blood flow profile obtained with the phase-contrast velocity mapping of a cross-section from normal and abnormal ovarian veins. Pictures (a) and (b) show a laminar flow pattern in a normal vein and a turbulent flow pattern in an abnormal vein, respectively
Discussion
PCS is a frequently under-diagnosed pathology due to the lack of clinical suspicion in women with gynaecological and urological symptoms. 16 Indeed, up to 10% of the general population of women have ovarian varices 17 and 60% of these may develop PCS. 18
Although it is a matter of debate, DV is considered by several authors as the gold standard technique for diagnosing this disease. 7,8 This is, however, an invasive procedure that requires central venous access from jugular or femoral veins and, therefore, it is an undesired procedure in daily clinical practice. 8
Importantly, the diagnosis of this disease using DV is based on anatomical features. In order to avoid this invasive procedure, non-invasive techniques such as CT and MR have been used for the evaluation of PCS 6,10,11 as well, but again they have been used considering only anatomical diagnostic criteria. However, it has been found that many asymptomatic women have similar anatomical characteristics compared with those suffering from this disease. For instance, Rozenblit et al. 19 reported a 63% of dilated OV in multiparous and asymptomatic women. 6,10,11
In patients with PCS it is frequently observed OV with abnormal flow patterns (retrograde or slow); 20 therefore, a number of researchers have suggested that Doppler US could be a useful diagnostic tool for this syndrome. Park et al. 21 used transabdominal and transvaginal Doppler US to study 139 women who were clinically suspected of having PCS on the basis of history and physical examination. However, in this study the diagnosis was fundamentally performed based on anatomic criteria because there were no significant differences in the duplex waveform between patients with PCS and asymptomatic women. Importantly, Park et al. 21 reported a predictive positive value of 83% using transvaginal US and they concluded that combined transabdominal and transvaginal sonography is potentially a feasible non-invasive screening tool for determining which patients with chronic pelvic pain may benefit from selective ovarian venography. In a similar way, Jin et al. 22 concluded that the combined use of computed tomographic venography and ultrasonography may be a possible non-invasive method for the diagnosis of unusual varicose veins.
Although Doppler US, especially transvaginal studies, can be considered as a very useful tool in daily practice, bad acoustic windows, lack of signal and dependency on operator are well-known limitations of this technique and, therefore, many authors have used DV as the reference technique in different studies. 2,8,21,23 Indeed, Halligan et al. 14 suggested that transvaginal US measurements of adnexal vasculature, including power Doppler measurements, cannot reliably distinguish women with pelvic congestion from controls.
We propose to use PCVM for assessing flow in OV and compare the results with DV. PCVM can overcome some of the problems derived from US, especially the dependence on the operator and the lack of duplex signal in the abdomen. With this technique we were able to diagnose 100% of women suffering from PCS, which was confirmed by DV, and all normal OV detected by PCVM were also normal according to DV. An advantage of the PCVM approach was shown in the patient who had all classical symptoms of PCS, even though DV showed normal OV. In this patient, PCVM was able to detect slow flow in both gonadal veins. We believe this patient had an initial phase of the disease and venous stasis had not yet occurred (dilation, retrograde flow). Because of the lack of other causes explaining her symptoms, the patient was treated using embolization even with normal DV. One month after the procedure, her symptoms were significantly improved. From this result, we hypothesize that slow or retrograde flow may be enough to cause the PCS symptoms and the dilation of the OV may only be a consequence of the anomalous flow. This, however, needs to be demonstrated with a larger number of patients.
When PCVM showed a normal OV we also found a laminar pattern of blood flow, whereas abnormal OV showed a turbulent pattern in the OV throughout the cardiac cycle. This finding might suggest an additional criterion in PCVM to diagnose PCS that needs to be explored.
The technical limitation of the study was the low spatial resolution that could be associated with erroneous flow measurements due to partial volume effects. The temporal resolution was also low; this was due to the time required by the bipolar gradients that need to encode a slow velocity (10 cm/second). Both resolutions can be increased, but at the expenses of increasing the scan time.
Clearly, the PCVM approach allows a more physiological evaluation of PCS compared with DV, and we believe this might result in a better diagnostic tool to detect or rule out the disease, and consequently in better patient management. This hypothesis needs to be confirmed with a larger number of cases including a control group.