
Abstract
Objectives
Fusion imaging technology (FIT) combines different imaging techniques by means of properly designed software. The aim of this study was to validate the ultrasonographic representation of intracranial vein anatomy by combining transcranial echo-colour Doppler (TECD) with conventional magnetic resonance imaging (MRI). In addition, we investigated the possibility of insonating the veins of the base of the skull through the novel condylar window.
Methods
We examined venous brain circulation in five healthy subjects by means of FIT, using a 1.5 T MR scanner and an ultrasound TECD equipped with Virtual Navigator technology.
Results and conclusions
Insonation of the Rosenthal and other intracranial veins through the classical transtemporal window, based on anatomical assumption, but never before validated by means of FIT study, was confirmed. Moreover, in all five subjects, FIT demonstrated the possibility of insonating the petrosal sinuses and the cavernous sinus area through the novel transcondylar approach. In conclusion, the feasibility of FIT of the intracranial veins potentially permits to study subjects in different postures and/or at the bed of non-transportable patients, after the initial MRI acquisition. Finally, the novel transcondylar approach allows obtaining haemodynamic information from the cavernous and the petrosal sinuses usually not investigated by TECD alone.
Keywords
Introduction
Cerebral venous circulation is rather difficult to measure, despite its being implicated in miscellaneous pathologies of neurological and neurosurgical interest, such as sinus thrombosis, hydrocephalus, acute stroke and a recently defined syndrome known as chronic cerebrospinal venous insufficiency (CCSVI).1–7
The gold-standard technique for studying brain anatomical details is the magnetic resonance imaging (MRI), as it is characterized by high spatial resolution and three-dimensional (3D) imaging re-construction. In addition, differently from ultrasound, MRI has no penetration problem through the skull.
Imaging information can be functionally complemented by contrast-enhanced venography capable of quantifying the venous flow at different levels along the complex cerebral venous system.8,9
However, the use of MRI is often impractical and not widely available especially when the patient cannot be easily transported. 10 In clinical practice, intracranial venous haemodynamics is also examined using transcranial echo-colour Doppler (TECD).11–13
TECD does not provide a satisfactory definition of anatomical details, and the technique has never before been evaluated in comparison with MRI. In fact, TECD anatomical nomenclature of the veins was assumed, based on known anatomical relationships, especially in the arterial system. For instance, we may postulate that the petrosal and cavernous sinuses cannot be assessed by TECD through the classical transcranial windows.1,2
There now exists the possibility of combining live 2D ultrasound (US) with a static 3D image volume which could be computed tomography, MRI or positron emission tomography, realizing an exciting fusion imaging technology (FIT).14–19 FIT by combining MRI with TECD is an ideal, non-invasive tool for studying the exactness of assumed venous TECD nomenclature, as well as for assessing other venous structures through an alternative transcranial approach, namely the condylar window.
The aim of this paper is to verify if FIT of the intracranial veins is feasible and may improve diagnostic information derived, respectively, from MRI and TECD, overcoming the respective limitations.
Materials and Methods
Five subjects, two women and three men with mean age 39.6 ± 14.3 years, were enrolled.
In order to obtain imaging fusion, before starting the MRI scan, at least six Beekley PinPoint Multimodality Fiducial Markers (Beekley Medical Corporation, Bristol, UK), conical design with a 1.27 mm diameter centre hole, were positioned on the patients’ foreheads (Figure 1). All subjects subsequently underwent the MRI and TECD scans with FIT.
Matching of TECD and MRI. Right: positioning and acquisition of the Fiducial Markers on the subject's forehead leads to test the accuracy between the two systems, with an accepted error <0.5 mm. The MRI image (middle) is placed on the US image (left); the perfect fusion is obtained in tuning mode, by moving the MRI image up/down, left/right and/or by rotating the image. MRI, magnetic resonance imaging; TECD, transcranial echo-colour Doppler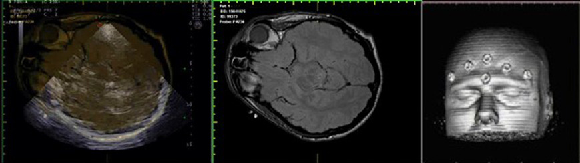
Magnetic resonance imaging
In all subjects an identical imaging protocol was followed. Each subject underwent the MRI scan, which was performed using a 1.5 T scanner (Intera Gyroscan, Philips, Eindhoven, NL), with a maximum slew rate of 150 T/m/s and maximum gradient amplitude in each orthogonal plane of 30 mT/m.
The following sequences were performed: T2-weighted 3D turbo spin echo, unenhanced 3D-time-of-flight (TOF) GE, and T1-weighted GE.
The parameters used for the T2-weighted 3D TSE images were: TR = 5000 ms, TE = 45 ms, 15 mm slice thickness with no gap, FOV: 230, acquisition matrix 208 × 201 and reconstruction matrix 256 × 256, acquisition was in the coronal plane.
The parameters used for the un-enhanced 3D TOF GE sequence were: TR = 20 ms, TE = 5.3 ms, 2 mm slice thickness with no gap, FOV: 230, acquisition matrix 232 × 220 and re-construction matrix 256 × 256, acquisition was in the axial plane.
The parameters used for the T1-weighted GE were: TR = 8.4, TE = 4 ms, 1.2 mm slice thickness with no gap, FOV: 250, acquisition matrix 252 × 180 and reconstruction matrix 288 × 288, acquisition was in the sagittal plane.
Fusion imaging technology
Following the MRI scan, TECD was performed on each subject. The examination was conducted with the echo-colour Doppler (ECD) Esaote MyLab70XVG (ESAOTE Biomedica, Genoa, Italy) ultrasound scanner equipped with a software for fusion imaging technology (Virtual Navigator, ESAOTE Biomedica).
The technique is a further development of sensorbased 3D US technology. With this technology, the US machine knows the spatial position of each and every US image via a sensor/electromagnetic system. The sensor is clicked onto the transducer and the magnet is placed close to the examination area. The static 3D volume is imported into the US machine in DICOM (Digital Imaging and Communications in Medicine) format. DICOM is a standard for handling, storing, printing and transmitting information in medical imaging. It includes a file format definition and a network communications protocol. DICOM files can be exchanged between two diagnostic equipments capable to receive image and patient data in DICOM format.
In DICOM, all the necessary image parameters for reconstruction in FIT are automatically available: image size, slice thickness and slice distance.
Each subject was positioned on a tilt bed in the supine position with an appropriate head support to keep the head as steady as possible. The accuracy of the fusion imaging technology registration was checked by positioning the ultrasound probe immediately above the pinpoint on the subject's forehead and determining the level of precision of the ultrasound image registration with the MRI volume.
The Esaote Navigator software has the following routine for image fusion:
Sagittal, coronal or axial image plane is chosen on the MRI. This plane may be rotated in steps of 90° to bring it into the same position as the ultrasound image. An image with distinct anatomical landmarks is chosen.
On US, an image with the same landmarks is made and fusion is activated by pressing a button. This preliminary fusion is based upon a plane lock since no points are involved and there may be substantial inaccuracies. When the transducer is moved, the same movement occurs in the MRI-volume – this includes rotation into any plane. The preliminary plane lock serves as a tool for the subsequent point lock. A minimum of three points must be selected for point lock – Esaote advocates as many as possible.
Each point is selected as follows: a suitable point is seen on the US image, which is then frozen. The transducer (which now controls the MRI alone) is moved until the same point is visible in the MRI image, which is then frozen. Both points are selected with a double click where after both images are live and back into the initial plane lock. The system is then ready for selection of the next point. The order in which the images are frozen may be reversed.
After selection of six points, the actual image fusion is activated. The US machine calculates the best fit between the points in the US-volume and MRI-volume by using least root mean squared difference (RMSD). If RMSD is <0.5 mm the fit is regarded as good (green light reported), if between 0.5 and 1.5 mm it is questionable (yellow light) and if RMSD >1.5 mm a red light is given. Points may be deleted and new points may be added and new fits may be calculated.
In tuning mode, the MRI image is brought into the US image as an overlay. The MRI may then be moved up/down and left/right and/or rotated until fusion is perfect (Figure 1). Tuning may be repeated in other parts of the volume when needed.
We calibrated the accuracy between the two systems through a first registration with external markers, accepted for RMSD <0.5 mm.
Moreover, on the ECD machine screen it is possible to view two main quadrants showing the TECD live image and the MRI corresponding to the area of insonation, permitting immediate and exact anatomical localization of the venous colour flow. Additionally, the MRI image may be overlapped on the current ultrasound situation by means of the ‘fusion’ function key. The operator is led to change the scanning plane by using four image panels that appear at the bottom of the screen: the axial, sagittal and coronal plane T1 MRI sequences and, finally, the 3D reconstruction of acquired volume, in that order.
Transcranial echo-colour Doppler sonography
A prototype of ultrasound phased array probe was used, matching the geometrical co-ordinates of PA230 probe and the array technology of Phased Array probe PA240 2.0–3.3 MHz; both CE and Food and Drug Administration approved (ESAOTE Biomedica). Its characteristics are:
Footprint: 14 × 23 mm Operating bandwidth: 1–4 MHz Depth: 44–362 mm Field of view: 19°–90° B-M modes frequencies: PEN-H, PEN-L, GEN-M, RES-L, RES-H (Tx-Rx: 1–4 MHz) TEI frequencies: PEN-M, GEN-M, RES-L, RES-H (Tx: 1–4 MHz; Rx: 28 MHz) CFM–PW frequencies: 1.7, 1.8, 1.9, 2.3, 2.5, 2.8 MHz CW frequencies: 2.1, 2.5 MHz
The first transcranial approach was performed through the transtemporal window, by which it is possible to identify the anatomical structures of the brain parenchyma and controlateral skull (Figure 1).3 –5,20–25
Pulse repetition frequency (PRF) was adjusted to the minimum level, corresponding to 370 KHz. Subsequently, any detectable venous flow among the parenchymal veins was compared with the background MRI imaging. In particular, the Rosenthal vein and the Galen vein were scanned in accordance with the previously described methodology.3 –5,20–25
All of the studied segments were recorded and compared with the background MRI images (Figure 2).
Classic transtemporal window. Insonation of brain parenchyma arteries and veins by means of ultrasound techniques, confirmed by MRI. Left: the Rosenthal vein (c) is sampled both by colour Doppler and Doppler PW. (a) middle cerebral artery; (b) posterior cerebral artery prepeduncular segment; (c) Rosenthal vein; (d) posterior cerebral artery postpeduncular segment; (e) midbrain; (f) middle cerebral artery controlateral side; (g) controlateral skull. Right: imaging and Doppler PW FIT of the Rosenthal vein. MRI, magnetic resonance imaging, FIT, fusion imaging technology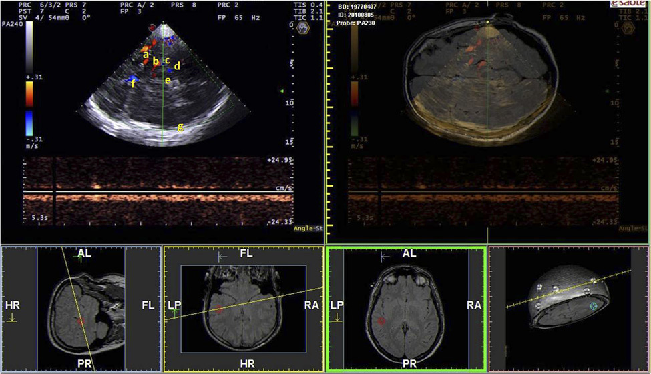
Further assessment was performed by placing the spectral Doppler pulsed wave (PW) sample volume into the imaged colour flow in order to confirm the presence of venous signal (Figure 2). Venous flow was also evaluated by means of a multigate Doppler analysis system (quality profile Doppler, MyLab VINCO, ESAOTE Biomedica). 26
The access bone window was then changed. The transducer was placed at the level of the mandibular condylus, sloping the tail downward approximately 10°. Insonation depth was adjusted to 11 cm eliciting venous outflow through deep inspiration, with initial PRF set at 500 KHz. This manoeuvre enabled identification of a colour cloud Doppler signal, at the depth of about 7 cm, with a hyper-echoic bright line visible immediately below the colour flow dynamic image. FIT permits the localization of the ultrasonographic cloud into the fusion screen (Figure 3). The PRF value was then gradually increased. This regulation allows for reduction of cloud colour disturbances, which are useful only to identify the area of interest. Such a colour cloud artefact is caused by air vibrations at the level of the nasal cavity, propagated through the sphenoid up to the basilar plexus and related structures. Increasing the PRF (sometimes up to 2.1–2.8 MHz) causes the colour cloud air component to disappear, and the operator may see a clear image of the insonated veins.
Color Cloud Marker. Left: TECD imaging through the transcondylar window permits to identify, asking the subject to breathe, a colour cloud marker in the absence of any parenchymal references. Right: the area of insonation detected by FIT on the MRI imaging background. MRI, magnetic resonance imaging; TECD, transcranial echo-colour Doppler; FIT, fusion imaging technology
Finally, we assessed flow direction using either Doppler spectrum analysis or the multigate Doppler analysis system, comprised of 256 Doppler samples with a flow direction extrapolated by an algorithm. 26
Results
FIT of cerebral venous anatomy has been used through two transcranial approaches, described separately in the Tables.
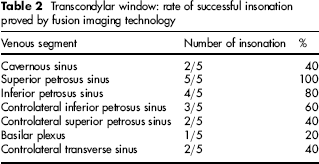
Transtemporal window: Table 1 lists the correct detection and relative rates of the different venous segments. The Rosenthal vein was the segment most frequently insonated because of its close relationship to the posterior cerebral artery (Figure 2). Blood flow in all of the insonated veins was directed through the back sinuses, as physiologically expected. Our study confirms the characteristics of cerebral venous flow previously described; Transcondylar window: Table 2 shows the corresponding venous segments insonated through this novel transcranial approach. Moving the probe anteriorly we may insonate the cavernous sinus, connected with the superior and inferior petrosus sinuses. Posteriorly we may insonate, from the surface to the depth, the ipsilateral superior petrosus and ipsilateral inferior petrosus sinus, respectively (Figure 4); and sometimes it is possible to identify also the controlateral inferior petrosus, and controlateral superior petrosus. New transcondylar window. Top left: TECD and FIT images of the cavernous sinus (a) connected with the superior petrosus sinus (b). Bottom left: TECD and FIT images, from the surface to the depth, of the ipsilateral superior petrosus (b) and ipsilateral inferior petrosus sinus. (c). Right: anatomical schema of cerebral venous system with the area of insonation circled. TECD, transcranial echo-colour Doppler; FIT, fusion imaging technology

Transtemporal window: rate of successful insonation proved by fusion imaging technology

Transcondylar window: rate of successful insonation proved by fusion imaging technology
Doppler spectrum analysis through the transcondylar window was often difficult due to a mirror effect, probably associated with the angle of insonation. This problem was solved through use of the multiangle system, which enabled rapid determination of flow direction contemporaneously in all segments (Figure 5).
26
The multigate Doppler system. Analysis of flow direction in the petrosus sinuses contemporaneously. The flow is elicited by inspiration, which increases the negative intra-thoracic pressure. Flow in all veins is toward the sigmoid sinus, as expected. SPs, superior perosus sinus; IPs, inferior petrosus sinus; CIPs, controlateral inferior petrosus sinus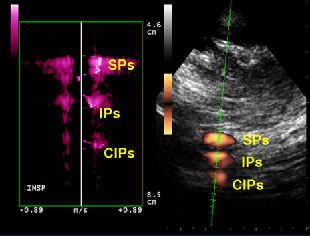
Discussion
FIT improves the localization of anatomic targets using the spatial relationship between two diagnostic modalities: TECD and MRI. Our goal was to enhance the images produced by ultrasounds by combining them with the MRI modality.
To the best of our knowledge, this is the first study which applies FIT to the assessment of the cerebral venous system. Particularly, we focused on the intracranial parenchymal veins and sinuses because they are more complex to be identified and more prone to anatomical variability.1–5,11–13,20–26 TECD is an imaging technique based on the B-mode recognition of the anatomical structures of the brain through known relationships with cerebral veins. 4 Such anatomical assumptions have never before been checked with MRI by means of FIT. The main finding of our study is that FIT, for the first time, permits demonstrating the direct anatomical correspondence between venous flow colour TECD imaging of the vein with the corresponding area detected by MRI.
B-mode imaging of anatomical structures has been very well described by simple comparison of images from the same subject examined both with transcranial ultrasound and MRI.4,20–26
Since MRI imaging acquisition precedes TECD investigation, this permits investigation of brain circulation in situations like sitting patients and/or during deep inspiration with a precise identification of the venous segments, thanks to the FIT software.
In perspective, FIT could afford to make the precise MRI anatomical detail of the intracranial venous segments in functional TECD study with postural and respiratory conditions disadvantageous for MRI alone. For instance, in the course of CCSVI, we may derive blood flow parameters of the venous circulation of the brain, by activating physiological mechanisms eliciting venous return;7,8,20,26 or, in case of not transportable patient, brain circulation can be monitored along time at the bed of the patient after the initial MRI.
In our study we studied intracranial veins insonated from two different trancranial approaches, the transtemporal and the transcondylar, respectively.
The transtemporal window is certainly an ideal approach to ultrasonographic definition of brain structures, also permitting a precise definition of the venous system. FIT confirms that the Rosenthal vein is the venous segment most constantly insonated and the most easily recognizable due to its relationship with the posterior cerebral artery3,5,20–25 (Table 1, Figure 2). As previously stated, other venous segments are less frequently detected. Veins can be insonated from different windows, but the anatomical details are even poorer with brain sonography, which does not permit a precise nomenclature of the veins.1 –4,11–13
The novel finding of this anatomical study is the possibility of receiving flow information constantly from the petrosus sinuses, and frequently from the cavernous sinus, through the transcondylar approach (Table 2, Figure 4). The ultrasonic beam permits continuous depiction of blood flow in the ipsilateral superior and inferior petrosus sinuses.
Flow information can also be obtained from the controlateral transverse and inferior/superior petrosus sinuses. However, in some cases, due to anatomical differences, it is possible that the petrosus sinus could be insonated instead of the cavernous one. Use of the transcondylar window offers the possibility of evaluating the skull base venous system. This new transcranial approach, together with the repeatability of the finding through the methodology described above, represents a potential improvement in clinical practice.
A possible limitation of FIT studies can be related to the accuracy of this new technology. However, the image fusion process is completely automated, only once the operator has provided proper volumetric matching points and/or proper matching planes. FIT, as we stated in the methods section, was achieved after a first phase of marker registration and a second phase of manual tuning. Thus, accuracy is also dependent from the expertise of the operator and his/her capability to achieve a proper matching of the two modalities (2D ultrasound and 3D MRI volume) on all the planes (Axial, Coronal, Sagittal). For this reason FIT can be finally considered a semi-automated technology and, from this point of view, it needs to be further investigated by assessing inter- and intra-observer variability.
In addition, the software we used is not capable of differentiating two points less than 1.4 mm distant. 14 This static accuracy can be further influenced also by the slice thickness and overlapping of the MRI slices, if they are more than 1.4 mm at least on one plane. Finally, the number of fiducial markers improves the static accuracy, and for this reason we registered fusion imaging in six points.
A second shortcoming in our study is that, due to MRI limits, the petrosal sinus is often difficult to see and FIT mainly depicts an area corresponding to colour flow (Figure 4). This limitation may be probably overcome by the means of magnetic resonance angiography complemented by 3D contrast sequence in the late phase and MIP reconstruction imaging. This technique might enhance the little sinuses of the base of the skull, but this was beyond the objective of the present study.
In conclusion, our study illustrates the feasibility of FIT of the intracranial veins by combining the best of MRI and TECD techniques. FIT potentially permits the study of subjects in different postures and/or at the bed of non-transportable patients by the means of TECD, after the initial MRI acquisition. Moreover, FIT technology demonstrates the possibility of insonating the veins of the base of the skull through the novel transcondylar window. This novel transcranial approach allows in perspective to obtain haemodynamic information from the cavernous and the petrosal sinuses usually not investigated by the means of TECD.
Footnotes
Acknowledgments
We thank Eng. Leonardo Forzoni and Luca Lodigiani of the Esaote Biomedica, for skilled technical assistance in obtaining the best possible fusion images. We thank Patricia J Ennis for the revision of the English language.