
Abstract
Objective: While chronic cerebrospinal venous insufficiency (CCSVI) can be characterized using cervical plethysmography, much remains unknown about the haemodynamics associated with this procedure. The aim of the study was therefore to gain a deeper understanding of the observed haemodynamics.
Method: Forty healthy controls and 44 CCSVI patients underwent cervical plethysmography, which involved placing a strain-gauge collar around their necks and tipping them from the upright (90°) to supine position (0°) in a chair. Once stabilized, they were returned to the upright position, allowing blood to drain from the neck. A mathematical model was used to calculate the hydraulic resistance of the extracranial venous system for each subject in the study.
Results: The mean hydraulic resistance of the extracranial venous system was 10.28 (standard deviation [SD] 5.14) mmHg.s/mL in the healthy controls and 16.81 (SD 9.22) in the CCSVI patients (P < 0.001).
Conclusions: The haemodynamics of the extracranial venous system are greatly altered in CCSVI patients.
Keywords
Introduction
In a recent study, using strain-gauge cervical plethysmography (SGP) we demonstrated that chronic cerebrospinal venous insufficiency (CCSVI) is associated with altered cerebral venous drainage dynamics. 1 SGP is a non-invasive technique that measures variations in electrical resistance associated with changes in blood volume, recorded by the means of a sensor encircling any cylindrical segment of the body.2,3 Although widely used to detect venous abnormalities in the legs by measuring change in venous volume in relation to change in posture and exercise, 2 it has never before been used in the context of CCSVI. We decided to use SGP instead of photoplethysmography (PPG) because individuals with CCSVI exhibit great variability in the venous drainage pathways from the brain. SGP allowed us to acquire a total measurement of the whole circumference of the neck, including the main and collateral venous routes, whereas PPG would have involved the use of probes of a limited size and therefore could only be used to explore part of the neck, or just one side. In addition, the fastening system associated with PPG was not as well suited to the tilt test as the SGP collar. In our study the vast majority of the patients had CCSVI, which was associated with multiple sclerosis (MS; 95%). While others have identified morphological abnormalities in the cerebral venous drainage pathways of MS patients, using echo colour Doppler sonography (ECDS)4–8 and magnetic resonance imaging (MRI),9–12 it has not been possible to characterize the dynamics of the overall drainage system using these techniques. For example, although the physical dimensions of individual veins can be determined using ECDS, together with abnormalities such as stenotic lesions, it is only possible, using this technology, to examine isolated sections of the venous drainage system. ECDS cannot be used to quantify the dynamics of the entire cerebral drainage system. Furthermore, in a recent meta-analysis of screening studies for CCSVI, Laupacis et al. 13 found a considerable heterogeneity in results obtained using ECDS. The reasons for this heterogeneity include factors such as absence of studies that describe what is normal in the cerebral venous return; absence of any consensus regarding which parameters should be measured and lack of consensus regarding the correct protocol to use. While a recently published consensus document 14 should help to improve things with regard to the ECDS protocol, this cannot overcome operator-dependent factors which might influence the results of a diagnostic test, such as the pressure of the probe on the neck, or assist with the interpretation of any collateral circulation and flow anomalies that might be found. However, through the use of SGP it is possible to quantify and characterize the overall venous drainage rate, irrespective of the physical location of any stenotic lesions. Indeed, through SGP we have been able to demonstrate that the morphological abnormalities associated with CCSVI, such as stenosis of the internal jugular veins (IJVs) and azygos vein, have a profound effect on the overall dynamics of the cerebral venous drainage system.
CCSVI is generally diagnosed using ECDS of the extracranial veins. However, due to the floppiness of the vessels involved and the variability of the venous vasculature, this technique can be highly subjective and open to misinterpretation. 15 Indeed, variability arising from venous sonography has caused some researchers to doubt the existence of CCSVI.16,17 However, through the use of SGP we have been able to demonstrate that CCSVI appears to be a real clinical phenomenon 1 and also show that in patients with MS the condition can be diagnosed with reasonable accuracy (selectivity=84%; P < 0.0001). Being a relatively simple procedure, which avoids much of the subjectivity associated with venous sonography, SGP appears to have potential as an inexpensive non-invasive technique for diagnosing CCSVI.
While the results of our initial study were promising, much remains unknown about the use of cervical plethysmography for diagnosing CCSVI, and there is need for additional work to understand how the technique may be best utilized. In particular, relatively little is known about the interpretation of plethysmography plots, and of how these relate to the dynamics of the cerebral venous drainage system. In this paper we examine this issue and investigate the physical science that underpins cervical plethysmography, with the aim of better understanding the haemodynamics associated with the technique.
Method
We assessed by the means of cervical plethysmography 44 CCSVI patients (95% MS and 5% healthy controls) and 40 subjects negative to ECDS screening for CCSVI (95% healthy controls and 5% with MS). The group of CCSVI negative subjects (hereafter referred to as healthy controls) was matched for age with CCSVI positive (mean age 41.5, standard deviation [SD] = 14.4 years versus mean age of 41.0, SD = 12.1 years, respectively, P = NS) and also for gender (18 females and 22 males versus 25 females and 19 males, respectively, P = NS). The entire cohort was informed about the methods and purpose of the experimental procedure and agreed to participate by signing an informed consent form. This prospective study was in accordance with Ethical Standards of the Committee on Human Experimentation of the University of Ferrara.
In order to gain new insights into the dynamics of the cervical plethysmography process we created a simple mathematical model of the extracranial venous system with the aim of interpreting the plethysmography plots. We applied this model to plethysmographic data acquired by Zamboni et al.
1
(see Table 1) in order to calculate the overall hydraulic resistance of the extracranial venous system. In Zamboni et al.'s study, participants were placed in a tilt chair (Figure 1) in the upright position and a passive cervical collar was placed around their necks. This collar comprised a thin silicone rubber tube containing electrically conductive indium–gallium liquid metal, which acted as the sensor (Strain-gauge plethysmometer, Microlab, Padua, Italy). The silicone used is particularly soft and special attention was given to the choice of collar size so that it adhered to the skin surface without creating unwanted compression of the underlying vessels. The neck circumference of each subject was measured individually before each test and a collar chosen (ranged from 25 to 35 cm) that best fit the circumference of the neck. The collar utilized a special silicone rubber, which ensured good adhesion to the skin, thus avoiding the need for any string adjustment. A platinum electrode was inserted at each end of the tube to form an electrical circuit, which was connected to a sensitive data logger. As the collar stretched, it both elongated and reduced in cross-sectional area, thus increasing the electrical resistance of the circuit. By monitoring changes in electrical resistance of the circuit, it was possible to indirectly measure the cervical venous blood volume.
18
The operator places the strain gauge around the neck of the subject, and rapidly tilts the chair backwards from 90° to 0°. When the blood volume curve reaches a plateau, the subject is again tilted forward to the upright position (<1.8 seconds)
Results of plethysmography study 1
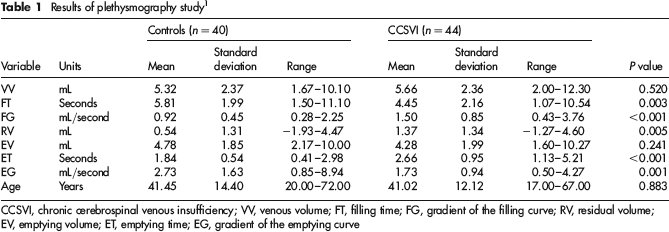
CCSVI, chronic cerebrospinal venous insufficiency; VV, venous volume; FT, filling time; FG, gradient of the filling curve; RV, residual volume; EV, emptying volume; ET, emptying time; EG, gradient of the emptying curve
After the collar was fitted, the study subjects were instructed not to move their neck or to swallow during the procedure. An angular position sensor fitted to the chair was used to record the chair angle from the upright position throughout the procedure (i.e. dotted line in Figure 2). After calibration, the subjects were tipped from the upright position (90°) into the supine position (0°), which caused the blood in the jugular veins to greatly increase in volume (i.e. solid line in Figure 2). Once the blood volume stabilized, the chair was tilted forward again into the upright position (<1.8 seconds), allowing the blood to rapidly drain from the neck. For each subject, this procedure was repeated three times and the average of the three sets of data recorded. An interval of three minutes was enforced between the procedures to allow for blood re-distribution. For each experimental run the following key parameters were recorded: the venous volume (VV); the filling time (FT) required to achieve 90% of VV (90% VV); the residual volume (RV) and the emptying time (ET) required to achieve 90% of the emptying volume (EV) (90% EV), where EV = VV–RT.
The plethysmographic trace is represented by the solid line, with the gravitational gradient (measured by the sensor positioned on the tilt chair) represented by the dotted line. For each experimental run the following key parameters were recorded: the venous volume (VV); the filling time (FT) required to achieve 90% of VV (90%VV); the residual volume (RV) and the emptying time (ET) required to achieve 90% of EV (90% EV), where EV = VV–RT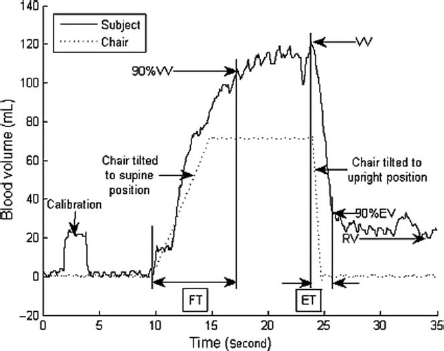
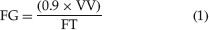
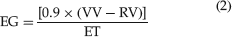
For each participant in the study, the mean values of the key parameters outlined above were used to determine two metrics: (i) the gradient of the filling curve, FG and (ii) the gradient of the emptying curve, EG, as follows:
For ease of reference a summary of the results of Zamboni et al.'s study are presented in Table 1. Readers who seek more details about the methodology used are directed to Zamboni et al. 1
Model
In the model it is assumed that when the study subjects are tipped into the supine position, an unknown volume of blood collects in the cervical veins above the silicone collar. When returned to the upright position, due to the action of gravity, this bolus of blood drains away, at a rate, Q mL/second, which is equal to the emptying gradient, EG, through the extracranial venous system. In the model the relationship between flow rate, pressure and hydraulic resistance is as follows:

where Q represents the blood flow rate from the bolus of trapped blood (mL/second); ΔP represents the pressure drop (gradient) across the whole extracranial venous system (mmHg) and R represents the hydraulic resistance of the extracranial venous system (mmHg.s/mL). When upright, the pressure drop across the venous system can be determined as follows:

where ρ is the density of blood (i.e. 1060 kg/m3); h is the average height of the column of blood from the point where the IJV leaves the cranium to the heart (i.e. 280 mm) and g is the acceleration due to gravity (i.e. 9.81 m/s2).
Because the cerebral/extracranial venous system is one continuous sealed system, in the model we assumed that as the bolus of trapped venous blood discharges, the pressure head, ΔP, remains constant while its volume changes (see Figure 3). Therefore by substituting equation (4) into equation (3) it is possible to calculate the hydraulic resistance, R, of the extracranial venous system during the plethysmography discharge procedure. In order to calculate the hydraulic resistance we assumed that when the subjects are returned in the upright position, the height of the column of extracranial venous blood, h, is on average 280 mm, for all the individuals in the study.
Simplified diagram of plethysmography discharge process in the upright position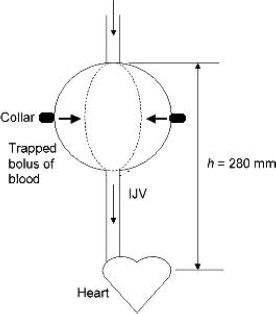
Results
From the experimental results presented in Table 1 it can be seen that there is a strong significant difference (P = 0.001) between the CCSVI patients and the healthy controls for the metrics FG and EG. By comparison no significant difference exists for the parameters VV and EV, suggesting great variability within both study cohorts. This is illustrated by the sample time-series plethysmography plots for CCSVI patients and healthy controls presented in Figure 4. From these it can be seen that while the general shape of all the graphs is similar, there is great variation between the plots produced by the individual subjects, making discrimination between the two cohorts difficult. The most consistent distinguishing feature is the emptying gradient, EG, which is almost vertical in the controls and is shallower in the group of MS patients. The other distinguishing feature is the value of the residual volume, RV. This is generally much lower in the controls compared with the MS patients, although some MS patients (e.g. Patient 3) also exhibited a low RV value. While the results in Table 1 clearly show a strong statistical difference between the cohorts for FG, this is not obvious from the samples shown in Figure 4. Having said this, the difference may be explained by the oscillatory part of the graph, which appears to have a greater slope in the controls compared with the CCSVI patients, something that would explain the longer FT required to achieve 90% of VV in the controls.
Typical plethysmogram plots for healthy individuals (a) and chronic cerebrospinal venous insufficiency patients (b)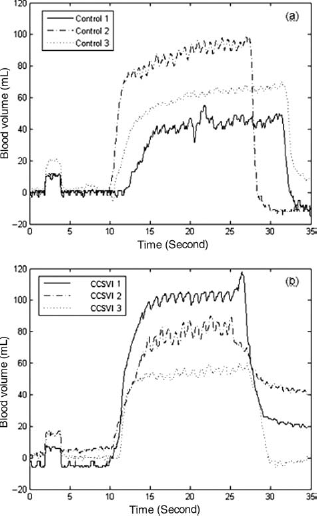
Table 2 shows the results of the analysis using equations (3) and (4) above. From this it can be seen that the hydraulic resistance is on average 63.5% greater in the MS patients compared with the controls (P < 0.001) – something which explains why the venous blood drains away much more slowly in the CCSVI patients compared with the controls.
Results of analysis – mean values and (standard deviation)

EG, gradient of the emptying curve; CCSVI, chronic cerebrospinal venous insufficiency
Discussion
The venous system is a complex, low pressure, free communicating network of vessels, which contains 75% of the body's circulating blood. When subjects lie in the supine position, the absence of any gravitational gradient causes the blood to be more evenly distributed throughout the system, with the result that the venous blood tends to collect in the jugular veins causing their volume to greatly increase. However, when upright, the distribution changes and approximately 70% of the blood volume becomes located below the diaphragmatic line, due to the action of gravity.
19
Consequently the jugular veins, being particularly floppy vessels, tend to collapse when upright. Through the use of a passive strain-gauge collar we have been able to accurately measure this change in volume and to produce plethysmography plots such as those in Figures 2 and 4. From these it can be seen that the filling process comprises two stages: an initial, steep, approximately linear phase, which is followed by an oscillatory phase, which has a shallow gradient. The initial phase corresponds with the period when the collapsed veins fill with blood until the vessels eventually become full. Once the vessels are full, the oscillations then commence. These appear to be periodic in nature, oscillating at approximately 1 Hz (see Figure 5), roughly cardiac frequency, suggesting that the distention of the IJVs during this period might be due to the pulsatility of the venous blood flow from the brain. Evidence supporting this opinion comes from Ambarki et al.
20
and Raksin et al.,
21
who observed, using MRI of the cervical veins, a venous pulse similar in shape and periodicity to that exhibited by the oscillations in Figures 4 and 5. However, given the irregular nature of the oscillations in some individuals (e.g. Control 1 in Figure 4a), it would appear that other unknown mechanisms might also be at work.
Sample plethysmogram plots for part of oscillatory period: (a) healthy individuals and (b) chronic cerebrospinal venous insufficiency patients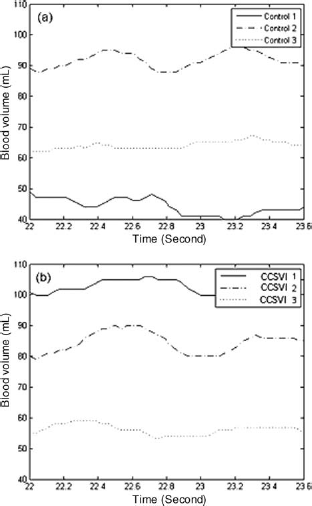
When an open vessel drains, the discharge flow rate decays exponentially with time as the height of the column of fluid decreases. However, during the plethysmography process, because the venous system is a closed system, the height of the column of blood does not change, rather the sides of the distended blood vessels contract as the trapped blood drains away (see Figure 3). Consequently, our model predicts that the discharge blood flow rate should be linear. From Figure 4 it can be seen that, for both cohorts, this is indeed the case, with the plethysmography plots showing a straight line for much of the discharge process, as predicted by the model. It can also be seen that the linear discharge rate (i.e. EG) is much greater in the healthy controls (2.73 mL/second) compared with the CCSVI patients (1.73 mL/second) – a result that is strongly significant (P = 0.001). This strongly implies the presence of impaired cerebral venous drainage in the cohort of CCSVI patients – something quantified by the calculated hydraulic resistance in the upright position, which is on average 63.5% greater in the CCSVI patients. As such, our work appears to corroborate that of Monti et al. 22 who found reduced cerebral venous outflow in the upright position to be strongly associated (P < 0.0001) with MS. Given that CCSVI has been shown by many researchers to be associated with MS,4–8,23,24 this suggests the presence of abnormal cerebral venous drainage hydrodynamics in many patients with MS. 22
By nature fluids take the path of least resistance. If main pathways, such as the IJVs, become occluded, then the upstream pressure will increase until it is great enough to force the venous blood through alternative collateral routes. While these collaterals allow the venous blood to drain away, they are more torturous than the original main pathways and so the hydraulic resistance of the whole system tends to increase. This is illustrated in Figure 6, which shows collateral flow through the thyroid veins in an MS patient due to 95% stenosis of the left IJV Studies by Zamboni et al.
25
have shown that CCSVI patients exhibit a wide degree of variance with respect to collateral rerouting. Consequently, one would expect the hydraulic resistance in these patients to exhibit greater variability than in healthy controls – something observed in the results in Table 2. Indeed, the high degree of variability exhibited by individuals with CCSVI and the torturous nature of the collateral pathways, make it very difficult to accurately calculate hydraulic resistance. This is because conventional hydraulic analysis techniques tend to struggle with systems that have numerous branches and vessels that are distended and distorted.
Collateral flow through the thyroid veins in a multiple sclerosis patient due to 95% stenosis of the left internal jugular vein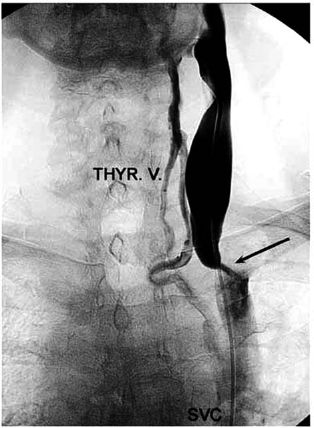
Because of collateral rerouting, one would expect the mean transit time of the blood through the extracranial venous system to increase in the CCSVI patients compared with healthy controls. From equation (3) it can be seen that as the hydraulic resistance of the system increases, so the venous blood flow rate will decrease. This in turn will tend to reduce the velocity of the blood flow, increasing the transit time. Furthermore, because the collateral pathways are generally longer than the original routes, this will also tend to increase the transit time of the venous blood flow. In a study involving 103 MS patients and 42 healthy controls, Mancini et al. 24 found the mean tissue-vein transit time to be 3.2 seconds in the MS cohort, compared with only 2.9 seconds in the controls (P = 0.037). Given that 95% of the CCSVI patients in our study also had MS, our findings would appear to support those of Mancini et al. Interestingly, although Mancini et al. found CCSVI to be present in 77% of the MS patients studied, they found no difference in the cerebral circulation time between the CCSVI positive and CCSVI negative MS patients. While this finding is difficult to explain, it does suggest that vascular changes other than CCSVI may be influencing the transit of cerebral blood in MS patients. Evidence supporting this hypothesis comes from Zivadinov et al. 23 who observed a marked reduction in cerebral veins <0.3 mm diameter in MS patients compared with controls, which statistically correlated with a diagnosis of CCSVI (P < 0.003). Law et al., 26 Ge et al. 27 and Varga et al. 28 also observed reductions in cerebral blood flow in the white matter of MS patients, strongly suggesting alterations in the cerebral vascular bed in patients with MS.
While the linear model above appears to explain much of the dynamics of the venous discharge, it is noticeable that for many of the individuals in the study (e.g. CCSVI patients 1 and 2) the linear discharge phase is followed a secondary phase that is not predicted by the model. In these individuals the initial linear discharge period is followed by a second oscillatory period in which the drainage rate is much slower. This discharge pattern, which appears to be particularly prevalent among the CCSVI patients (as indicated by the high mean residual volume [RV] value for this cohort), is difficult to explain. However, the oscillatory nature of the signal implies the presence of a significant volume of blood in the cervical veins, suggesting that they have not emptied. This implies that the flow rate attempting to pass through the venous drainage system in these individuals exceeds its discharge capacity. Consequently, after an initial period of rapid discharge, the system becomes ‘swamped’ with the result that the blood backs up in the jugular veins and is only able to drain away slowly. For example, this pattern of drainage can clearly be observed in CCSVI patient 1 in Figure 4(b).
One unexpected finding of the study was that the FG was markedly steeper in the CCSVI patients compared with the healthy controls, primarily due to reduced FT. While at first sight this phenomenon might appear more difficult to explain than the shallower EG, it too is consistent with impaired flow in the extracranial venous pathways. In the supine position, the rate at which blood accumulates above the collar (i.e. FG) is dependent both on the rate at which arterial blood enters the cranium and the rate at which it drains away through the veins back to the heart. Therefore, if for any reason, flow through the extracranial venous pathways is impaired, as would be the case in CCSVI patients, then the blood would tend to accumulate in the neck at a faster rate, resulting in a reduced FT and a steeper FG.
One common mistake often made by those unfamiliar with the discipline of fluid mechanics, is to confuse the morphological features of the vascular system with its hydrodynamic behaviour. Although the two are closely related, they are separate and distinct entities. While one might be able to identify the presence of stenotic lesions or incompetent valves at specific locations in the extracranial venous system using ECDS, it is not possible from this alone to calculate the hydraulic resistance of the whole system. This is because the hydraulic resistance of the extracranial venous system is influenced by many factors, including; blood velocity; the presence of turbulence; the length and diameter of collateral pathways and the smoothness and uniformity of the vessels. Two venous anomalies in separate patients which appear morphologically similar with ECDS, might in reality impact on the blood flow dynamics in very different ways, depending on other factors. Failure to appreciate this can result in erroneous conclusions about the behaviour of the venous system. Given this, SGP appears to have a great potential. Using this new methodology, it is possible for the first time to calculate the overall hydraulic resistance of the extracranial venous system, and thus obtain a quantifiable metric that can be used to objectively compare blood flow both in CCSVI patients and in healthy individuals. As such, the method is a useful addition to ECDS – especially when it is considered that venous sonography is a highly specialized discipline that if applied incorrectly can yield erroneous results. 29
Conclusion
Although many studies have shown CCSVI to be associated with morphological abnormalities of the extracranial venous pathways,4–8,25 because of the limitations of ECDS it has not been possible to assess how these might influence the overall dynamics of the extracranial venous system. Because the hydraulic resistance attributable to any given stenosis cannot be determined using ECDS, it is impossible using this sonography to assess the overall haemodynamic behaviour of the extracranial venous system. This is particularly the case, when one considers that CCSVI frequently involves the collateral rerouting of the venous blood back to the heart. 25 Consequently, interventionalists who might perform venous angioplasty on perceived blockages cannot be sure how this intervention will affect the dynamics of the whole system. Through the use of cervical plethysmography, it should be possible to quantifiably assess this. Using the methodology described above, it is possible to calculate the hydraulic resistance of the extracranial venous system for each individual tested. This is a significant step forward because it allows, for the first time, non-invasive quantifiable assessment of the hydrodynamics associated with CCSVI to be made, in addition to any examination of morphological abnormalities using ECDS. Given that the process appears to be a readily repeatable procedure, much less prone to operator error compared with echo colour Doppler ultrasound, we believe that cervical plethysmography has great potential as an inexpensive tool for diagnosing venous drainage abnormalities and urge that further research be carried in this much-neglected field.