




Abstract
Even in the best resourced units, certain situations (e.g. resuscitations) can benefit from anticipation and preplanning. A resource-scarce environment can indirectly lead to poor planning and organization. Here we share our experience of using computer software (Microsoft Office Excel) to improve the planning of patient care. This technology is now widely available and we suggest that it is feasible and, indeed, particularly valuable in a resource-poor setting. We focus on the steps taken to minimize the chances of errors rooted in the program.
Introduction
Even in the best equipped centres of the developed world, routine care can be compromised by human error due to the pressure of work and emergency care can be improved by anticipation and preparation. In the developing world, there is the added problem of the indirect adverse effects of financial constraints. Poor organization is not a direct effect of poverty, but may be an indirect effect of a lack of motivation (associated with poor patient outcome, low salary, job insecurity and poor promotion prospects), brain drain and problems with the recruitment and retention of staff.
Computer software is now widely available in the developed and developing world and clinical decision support software systems have become commercially available. There is evidence to suggest that the use of spreadsheets (with inbuilt safety measures) can reduce medication errors. 1 Our intention was to develop a system that did not require a subscription (with its attendant costs) and could be tailored to individual patients in our setting (in the context of local resources). We do not have a computer in the paediatric intensive care unit (PICU) or the neonatal intensive care unit (NICU), but we do have access to a computer which has Microsoft Office Excel 2007 and a printer elsewhere in the department. We describe our attempts to adapt the program to our needs, with a focus on the steps taken to minimize the chances of errors rooted in the program. The strategies described below also apply to Microsoft Excel 97-2003.
Method
We have described the use of an indigenous paediatric crash cart in a previous issue of the journal. 2 This contains essential equipment for the management of airway, breathing, circulation (A, B, C) and a limited number of emergency drugs. For each patient on the PICU we have married the crash cart to an individualized printout (Figure 1). For each drug dose or other item (e.g. size of endotracheal tube [ETT]), the correct value is dependent on a certain variable (here the child's weight or age, respectively), which can be entered into a cell (the reference cell) on the spreadsheet. Then, for each drug dose or ETT size (or depth of the insertion of ETT at lips or nose), the correct figure is arrived at by entering the formula:
The paediatric intensive care unit (PICU) personalized drug calculator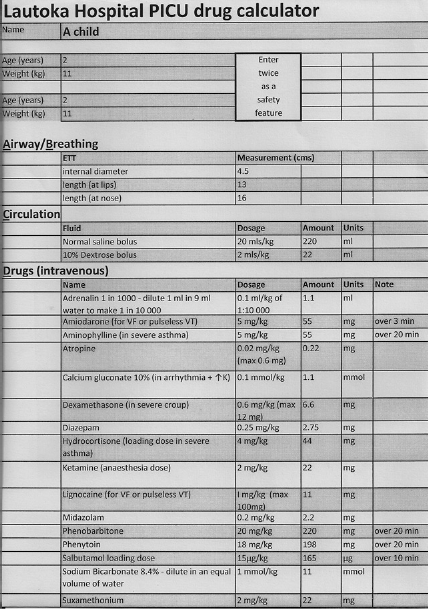

and then accepting the value by hitting ‘enter’ on the keyboard or by clicking on the tick on the formula bar.
In a similar way we have used the software on NICU to flag up dates for investigations – which may or may not be indicated, depending on birth weight (BW) and gestational age (GA) cut-offs – scheduled at an appropriate age (i.e. an appropriate number of days after date of birth [DOB]). In this way, the checklist for investigations (Figure 2) is personalized for each individual infant. In our setting, eye checks for retinopathy of prematurity are offered if the infant needs oxygen and has a GA below 31 weeks or a BW below 1.5 kg. If ordered on the basis of GA it is scheduled at a corrected age of 31 weeks; if ordered on the basis of low BW it is scheduled when the infant is 1 week old. Both criteria can be accommodated by using a two-step process. Here we entered the appropriate cell on the spreadsheet, then clicked on the function button (fx), then selected the category ‘logical’, then the function ‘IF’. This leads to a ‘logical test’: we clicked on the reference cell giving GA, then hit ‘less than’ (<) on the keyboard, then our cut-off value (31), then for ‘value if true’ entered the formula: (click on reference cell containing DOB) +7* (31-click on reference cell giving GA), thereby arriving at the date corresponding to a corrected age of 31 weeks; for ‘value if false’ we clicked on an intermediate (‘ghost’) cell, which was a second cell set up with a logical function. Here, if BW was below 1.5, then for ‘value if true’ we entered the formula: (click on reference cell containing DOB) +7 to arrange the first eye check at 1 week of age; for ‘value if false’ we entered the text ‘not routinely offered’. We also used the software to schedule cranial ultrasound scans for infants below a GA of 31 weeks or BW of 1.5 kg (using the same logical functions) and scheduled for 7 and 28 days after DOB (DOB +7 or DOB +28). Dates for immunizations (based on DOB and not corrected for prematurity) and start dates for vitamins and iron, etc., can also be preplanned.
The neonatal intensive care unit (NICU) personalized checklist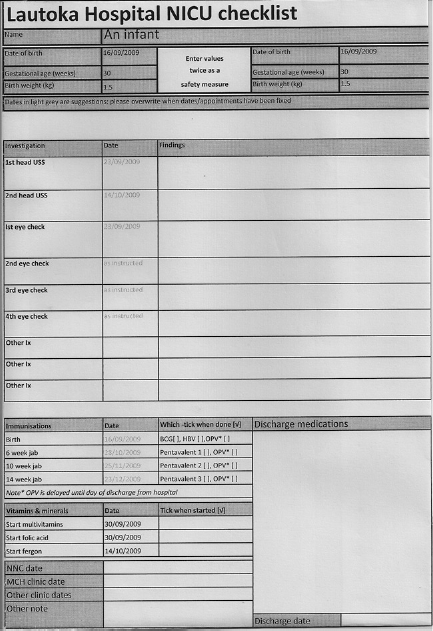
An issue of over-riding importance is that data must not be wrongly entered into the program as this would, obviously, be reflected in the printout, leading to programmed errors (including potentially dangerous drug errors). We therefore now focus on the safety measures that we have adopted.
In paediatric practice, most drug doses are based on weight; in some cases, maximum and/or minimum doses are specified. In the case of an obese child, a weight-based dose could exceed an adult dose, which might be inappropriate. Thus, in some cases it is necessary to specify a dose limit. This can be incorporated using the ‘IF’ function of the ‘logical’ category (as above): in the ‘logical test’ (used here to give an upper dose limit) we clicked on the weight cell, then hit ‘less than’ (<) on the keyboard, then typed in the weight which would give the maximum desired dose. Then for ‘value if true’ we entered the weight-based formula and for ‘value if false’ we entered the maximum dose. The ‘IF’ function offers a choice of two options (‘value if true’ or ‘value if false’); however, multiple options can be accommodated through the use of intermediary (‘ghost’) cells, as described above. This strategy was needed for the dose of atropine (0.02 mg/kg), which has both a minimum and a maximum dose (0.1 mg and 0.6 mg, respectively). Here we entered formulae for the three options (option 1 = 0.1; option 2 = weight reference cell times* 0.02; option 3 = 0.6) in three remote cells. The ‘IF’ category allowed us to accept the first option (if weight was below 5 kg) or refer to an intermediate cell (if weight was not below 5 kg). In the intermediate cell, we accepted option 3 (if the weight was >30 mg) or option 2 (if weight was not >30 kg).
On one occasion it was noted that the operator had entered the age in the wrong cell, leaving the correct cell empty: the formula for ETT internal diameter (‘4 + age/4’) wrongly returned ‘4 + 0/4 = 4’. We therefore incorporated grey scale in order to encourage the doctor to put the patient's data in the right box. Furthermore, we introduced data validation: this can reduce the chances that inappropriate numbers are entered (as might happen if the operator uses the wrong units); also, if the operator is required to enter the variable (e.g. weight) twice, it can ensure that both entries are the same, to guard against typing errors. For this we clicked on the ‘data validation’ button on the ‘data tools’ group of the ‘data’ tab, then ‘settings’, leading to a pull down list, from which ‘whole number’ or ‘decimal’ allow minimum and maximum values to be preset and ‘list’ refers you to a ‘source’, whereby the first entry can be captured, forcing agreement of the second entry.
As the spreadsheets are interactive by design, we are unable to lock them as read-only. In an attempt to tamper proof them we used the following strategy. On a remote part of the spreadsheet (there are an infinite number of cells) we summed all our results for doses and ETT variables, etc. (to give a meaningless figure) and then repeated the same calculations and took the sum again. This repetition can be simply achieved by ‘copying and pasting’ the original cells. However, to use this method it is first necessary to ‘fix’ the reference cells. This is done by placing a $ sign in front of the reference cell's two co-ordinates (e.g. $B$8) in all the original formulae. We then introduced a cell to reflect a logical (IF) function. If the two sums were not equal, an error message would be given. The ‘error message’ cell was then cut and pasted onto the front sheet and a bold red font selected. The other cells can be hidden if wished (by selecting the columns, clicking the ‘format’ button on the ‘cells’ group of the home tab and clicking ‘hide’).