
Abstract
This study examined the relationships between left ventricular ejection fraction data derived from four commonly used cardiac ultrasound measurement methods (visual estimation, wall motion scoring, biplane Simpson's method and three-dimensional [3D] echocardiography) to assess whether they can be used interchangeably in the assessment of left ventricular systolic function. Two-dimensional (2D) and 3D data obtained from ultrasound studies for 190 patients (109 men, mean age 56 ± 20 standard deviation [SD] years [range 20–87] and 81 women, mean age 61 ± 18 SD [range 23–96]) with routine cardiac referrals were analysed. Ejection fractions were estimated for each patient offline using standard 2D echocardiography for visual estimation, wall motion scoring and biplane Simpson's methods, while 3D data were analysed using Phillips 3DQ Advanced software. Bland–Altman analysis was performed to test the agreement between the different measurement techniques allowing determination of significance, bias and 95% limits of agreement. Bland–Altman plots were also used to further investigate whether agreement between methods varied with different levels of left ventricular function. Only two method comparisons (visual estimation versus wall motion scoring and biplane Simpson's method versus 3D echocardiography) showed no statistically significant differences (P = 0.09 and 0.99) or bias (–0.7 and 0). However, the 95% limits of agreement were wide (–11.1% to 9.8% and –14.3% to 14.3%, respectively). Visual estimation, wall motion scoring, biplane Simpson's method and 3D echocardiography should not be used interchangeably for serial assessment of left ventricular ejection fraction.
Introduction
An accurate assessment of left ventricular function is important in the diagnosis and management of several cardiac disease states such as heart failure and postmyocardial infarction. 1 The most widely used measurement of left ventricular systolic function is the ejection fraction, which provides important prognostic information in these patients. 2,3
Left ventricular ejection fraction (LVEF) is also used to provide inclusion criteria for certain medical therapies, such as implantation of a cardiac defibrillator 4 or to begin adjuvant chemotherapy for cancer. 5 Its use is also important in the serial assessment of left ventricular function in many patient groups including those prescribed Trastuzumab, where a reduced ejection fraction may contraindicate continued use of the drug. 5 Serial monitoring of ejection fraction is also useful for the determination of timing of medical or surgical interventions. 6
The three most widely used non-invasive imaging modalities which assess LVEF are cardiac magnetic resonance imaging (cMRI), radionuclide ventriculography and echocardiography. They have all evolved separately and have different normal values for each technique. Studies have shown that these modalities do not provide interchangeable values, 7–9 supporting the conclusion that the serial assessment of ejection fraction with different techniques should be avoided and the same modality should be used for each follow-up assessment. 1
The lack of intermodality agreement might lead to important health consequences for patients and this is extremely pertinent when applied to different methods of assessing ejection fraction by echocardiography.
The British Society of Echocardiography published guidelines for patients prescribed Trastuzumab which recommend that the evaluation of ejection fraction should be made using either biplane Simpson's disc summation method from two-dimensional (2D) echocardiography or realtime volumes obtained from three-dimensional (3D) echocardiography. 10 The decision of choice may be based on availability of the technique (three-dimensional echocardiography [3DE] machines are very expensive and are less available, often being limited to the large tertiary NHS hospitals). It is also standard practice in some centres to provide a subjective assessment of LVEF, particularly in patients with suboptimal images where accurate endocardial delineation is compromised and biplane Simpson's methods cannot be undertaken. Visual estimation and wall motion scoring are two methods reported in the literature and often adopted as common place in clinical practice. It may prove that different echocardiographic methods used to assess ejection fraction lack agreement, leading to the situation where a patient does not qualify for treatment or intervention.
There are various studies that investigate the correlation between the methods used in this study to assess ejection fraction. Many papers that validate visual estimation and wall motion scoring were written before the introduction of ultrasound equipment with second-generation harmonics, 11 while many papers that validate 3D echocardiography were performed before the development of phased array matrix transducers that can acquire full volume data-sets from one apical transthoracic window. Therefore, only recent literature comparing the methods was viewed and compared.
Table 1 lists those studies that included two or more of the following methods: visual estimation, wall motion scoring, biplane Simpson's method and 3DE. These studies report that 3DE correlates better with the gold standard reference methods than biplane Simpson's method, 12–17 while the qualitative methods visual estimation and wall motion scoring both correlated well. 18–20
List of research studies investigating correlation of the four methods used in this study
VE, visual estimation; RNV, radionuclide ventriculography; cMRI, cardiac magnetic resonance imaging; WMSI, wall motion scoring index; BSM, biplane Simpson's method; 3DE, three-dimensional echocardiography
This table only includes studies that include VE, wall motion scoring, BSM and 3DE utilizing modern equipment (e.g. second-generation harmonics and matrix transducers)
In view of this, the aim of this study is to compare the four commonly used echocardiographic methods to determine whether they can be used interchangeably in the assessment of LVEF.
Method
Subjects
One hundred and ninety patients (109 men, mean age 56 ± 20 SD years [range 20–87] and 81 women, mean age 61 ± 18 SD [range 23–96]) with routine cardiac referrals and a range of cardiac dysfunction consented to allow their images to be analysed for the purposes of this study.
The sample group included outpatients seen routinely in hospital following a referral to the echocardiography department. Exclusions included vulnerable groups; patients in whom obtaining an adequate quality 3DE data-set is problematic (e.g. due to irregular heart rhythm or atrial fibrillation), those with body habitus that resulted in poor image quality and those subjects with dyspnoea precluding a 10–15 second breath-hold.
All subjects provided written informed consent to participate and the study was granted ethics approval by the York NHS Research Ethics Committee and York and Selby Research and Development Committee.
Procedures
Echocardiography was performed using a commercially available ultrasound system (iE33, Philips Medical Systems, Andover, MA, USA). Echocardiographic data-sets were acquired by two experienced sonographers. The two-dimensional echocardiography (2DE) images were obtained first using a 1–5 MHz phased-array transducer, followed immediately by 3DE full volume data acquisition using X3-1 matrix phased-array transducer.
Image acquisition
All images were acquired with the subject in the left lateral decubitus position, at end expiration for a minimum of four consecutive cardiac cycles, and recorded as digital loops gated by single lead echocardiogram, which were digitally archived.
2D images were obtained in the parasternal long axis, parasternal short axis (mid-level), apical two and four chamber views. Optimization was performed using harmonic imaging, gain, dynamic range, frequency, sector width and focus to improve signal-to-noise ratio and provide optimal endocardial definition. Images were acquired ensuring the largest cavity lengths, and with less than 20% difference between apical four and two chamber views. 3DE full volume data were optimized using volume size, frame rate and number of 3D wedges, where the smallest volume was used to cover the entire left ventricle while ensuring optimal frame rate and resolution.
Data analysis
The data were analysed by a single experienced sonographer who was blinded to all other ultrasound findings. LVEF was calculated from each of the four methods. Conditions that were followed for the analysis of the data-sets to avoid operator bias included randomization of the order that the raw data-sets were analysed; each method of assessing LVEF was analysed independently on different days; and calculations were carried out a minimum of four weeks post data acquisition to avoid image recognition and bias.
Analysis of visual estimation
Ejection fraction was estimated by visual assessment of the routine 2D data-set, taking into account factors such as left ventricular wall motion, wall thickening and change in cavity area. A numerical value was ascribed and rounded up or down to the nearest 5%.
Analysis of wall motion scoring index
The 2D data-set was visually assessed – using the 16-segment model recommended by the American Society of Echocardiography to assess regional wall motion abnormalities.
21
A reference guide and score sheet were used, enabling a systematic approach to identification and wall motion scoring of the individual segments of the left ventricle taking into account factors such as left ventricular wall motion and wall thickening in phase and compared to adjacent segments. The scale for scoring of each segment was +3 for hyperkinesis, +2 for normal function, +1 for hypokinesis, 0 for akinesis and −1 for dyskinesis. Segments that were not visualized were not included in the score. The average score for the segments analysed was then calculated by the equation:

The wall motion index for the segments was then converted into an ejection fraction by the equation: 30 × wall motion index = left ventricular EF%. 22–24
Biplane Simpson's disc summation method
The biplane Simpson's software on the Philips iE33 ultrasound system utilized a three-point adjustable border, where inferior and anterior mitral annular points were identified followed by the apex. A template system mapping the LV cavity allowed adjustments to be made to fit the map to the endocardial boundaries. This was performed for both apical four- and two-chamber images at both end-diastole and systole. End-diastole was taken to coincide with the Q-wave on the electrocardiogram and end-systole was selected by identifying the frame with smallest LV cavity cross-sectional area in both apical views prior to mitral valve opening. Apical windows which were not foreshortened were utilized for consistency with 3D.
Analysis of 3D echocardiography
3DQ advanced software (Philips Medical) was used for analysis of the 3D data-set. Anatomically correct apical four- and two-chamber views which were not foreshortened were obtained by manipulation of the 3D data-set. Five anatomical landmarks were placed to identify the mitral annulus in both apical four- and two-chamber views and the fifth to identify the apex in the four-chamber view. This process was performed in both end-diastole and end-systole. The boundary detection algorithm automatically identified the endocardial surface, although adjustments were made as necessary to ensure optimal tracking of the endocardial border.
Statistical analysis
Initial statistical analysis was undertaken using the Statistical Package of the Social Sciences (SPSS version 13.0, IBM, Chicago, IL, USA). Box and whisker and standard error plots were drawn to display differences between the four methods of assessing ejection fraction, including the dispersion (spread) of ejection fractions, skewness in the data and to identify outliers. Confidence interval plots were drawn to demonstrate the means and standard errors of the four methods. One-way analysis of variance was performed using SPSS to test differences between the means of the data for the four methods.
Statistical analysis as described by Bland and Altman 25 was performed using Microsoft Excel 2003 + Analyse-it. This analysis tests the agreement between two different measurement techniques allowing determination of significance, bias and 95% limits of agreement. Bland–Altman plots were also used to further investigate whether agreement between methods varied with different levels of left ventricular function. Three categories of ejection fraction were selected in line with relevant literature: <35%, 35–55% and >55%. 26,27 A mean of the four ejection fractions for each research subject was used for allocation to each category. Bland–Altman tests (Microsoft Excel 2003 + Analyse-it) were then performed comparing the four methods of assessing ejection fraction within each category.
Intra- and interobserver variability
Intraclass correlation coefficients (ICCs) were calculated for intraoperator variability. Duplicate data-sets for 10% of the study participants were acquired immediately after initial collection ensuring the physiological condition of the study participant (e.g. heart rate) remained constant to assess test/re-test agreement. ICCs for visual estimation 0.96, wall motion scoring index 0.99, biplane Simpson's method 0.96 and 3D 0.96 which demonstrates excellent intraoperator repeatability.
Results
A total of 190 patients provided a range of ejection fractions from all four echocardiographic methods (Figure 1). Ejection fraction values for visual estimation (mean 54.86 ± 12.79 SD), wall motion scoring index (mean 54.21 ± 14.12 SD), biplane Simpson's methodology (mean 56.94 ± 12.97 SD) and 3D echocardiography (mean 56.94 ± 11.45 SD) are represented in Table 2.
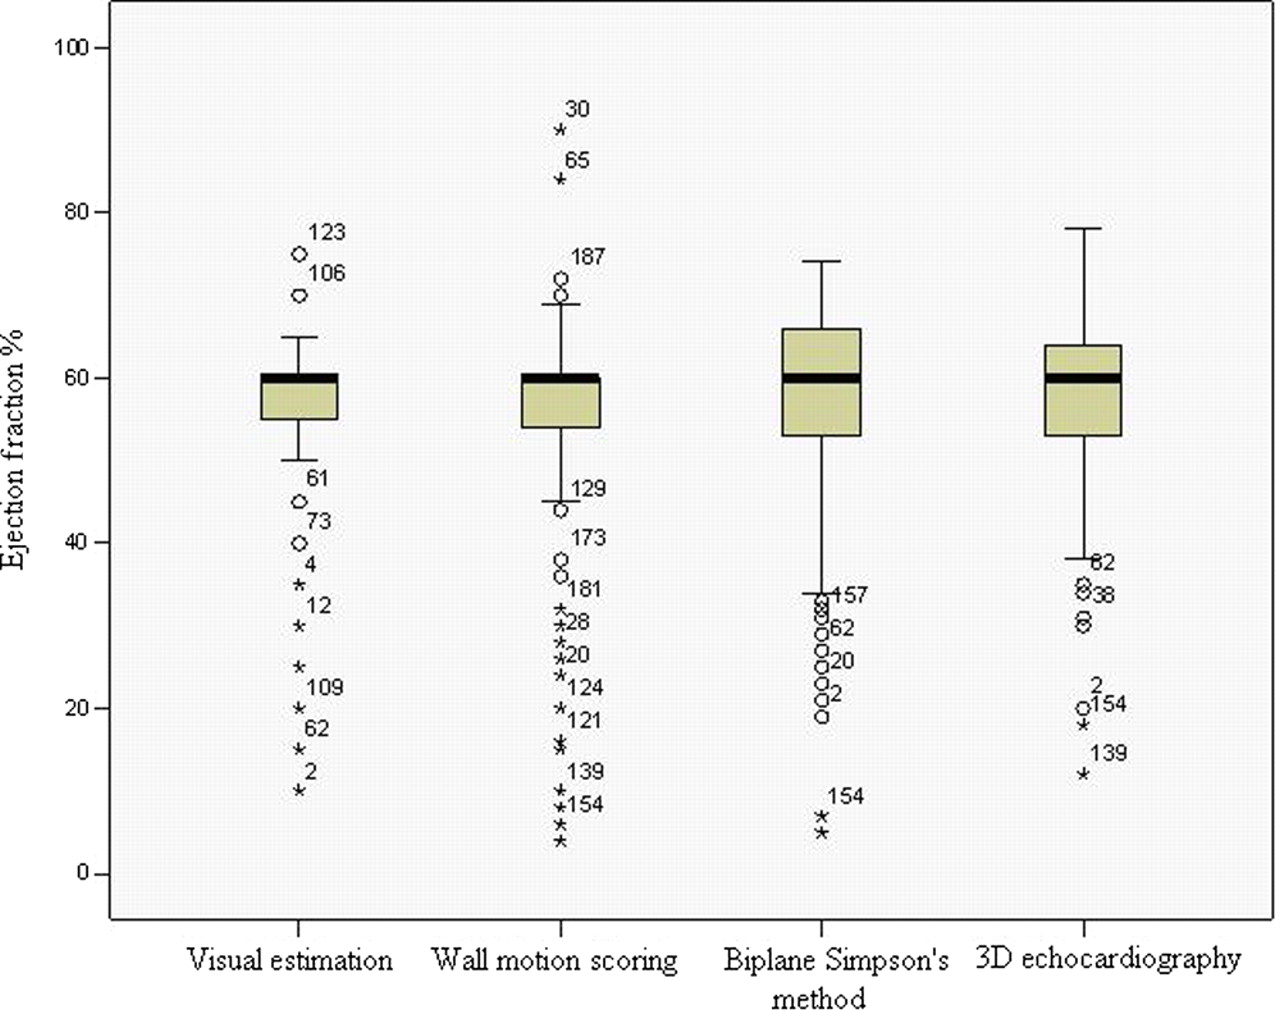
Box and whisker plots demonstrating the medians, upper and lower quartile, largest and smallest observation and outliers for the four echocardiographic methods of analysing left ventricular ejection fraction: visual estimation, wall motion scoring index, biplane Simpson's method and three-dimensional echocardiography
Ejection fraction data including mean, standard deviation and range as measured by the four echocardiographic methods
3D, three dimensional
Comparison of methods
Bland–Altman analysis was used to compare all four methods of ejection fraction estimation. Table 3 shows the relationship between the four echocardiographic methods in terms of significance (P) values, bias and 95% limits of agreement. There is no statistical difference between visual estimation and wall motion scoring index or between biplane Simpson's method and 3D echo (P values > 0.05); however, there are significant differences between the other combinations of methods (P values <0.001). Bland–Altman scatter plots for all comparisons are presented in Figure 2a–f, and difference plots presented in Figure 3a–f.
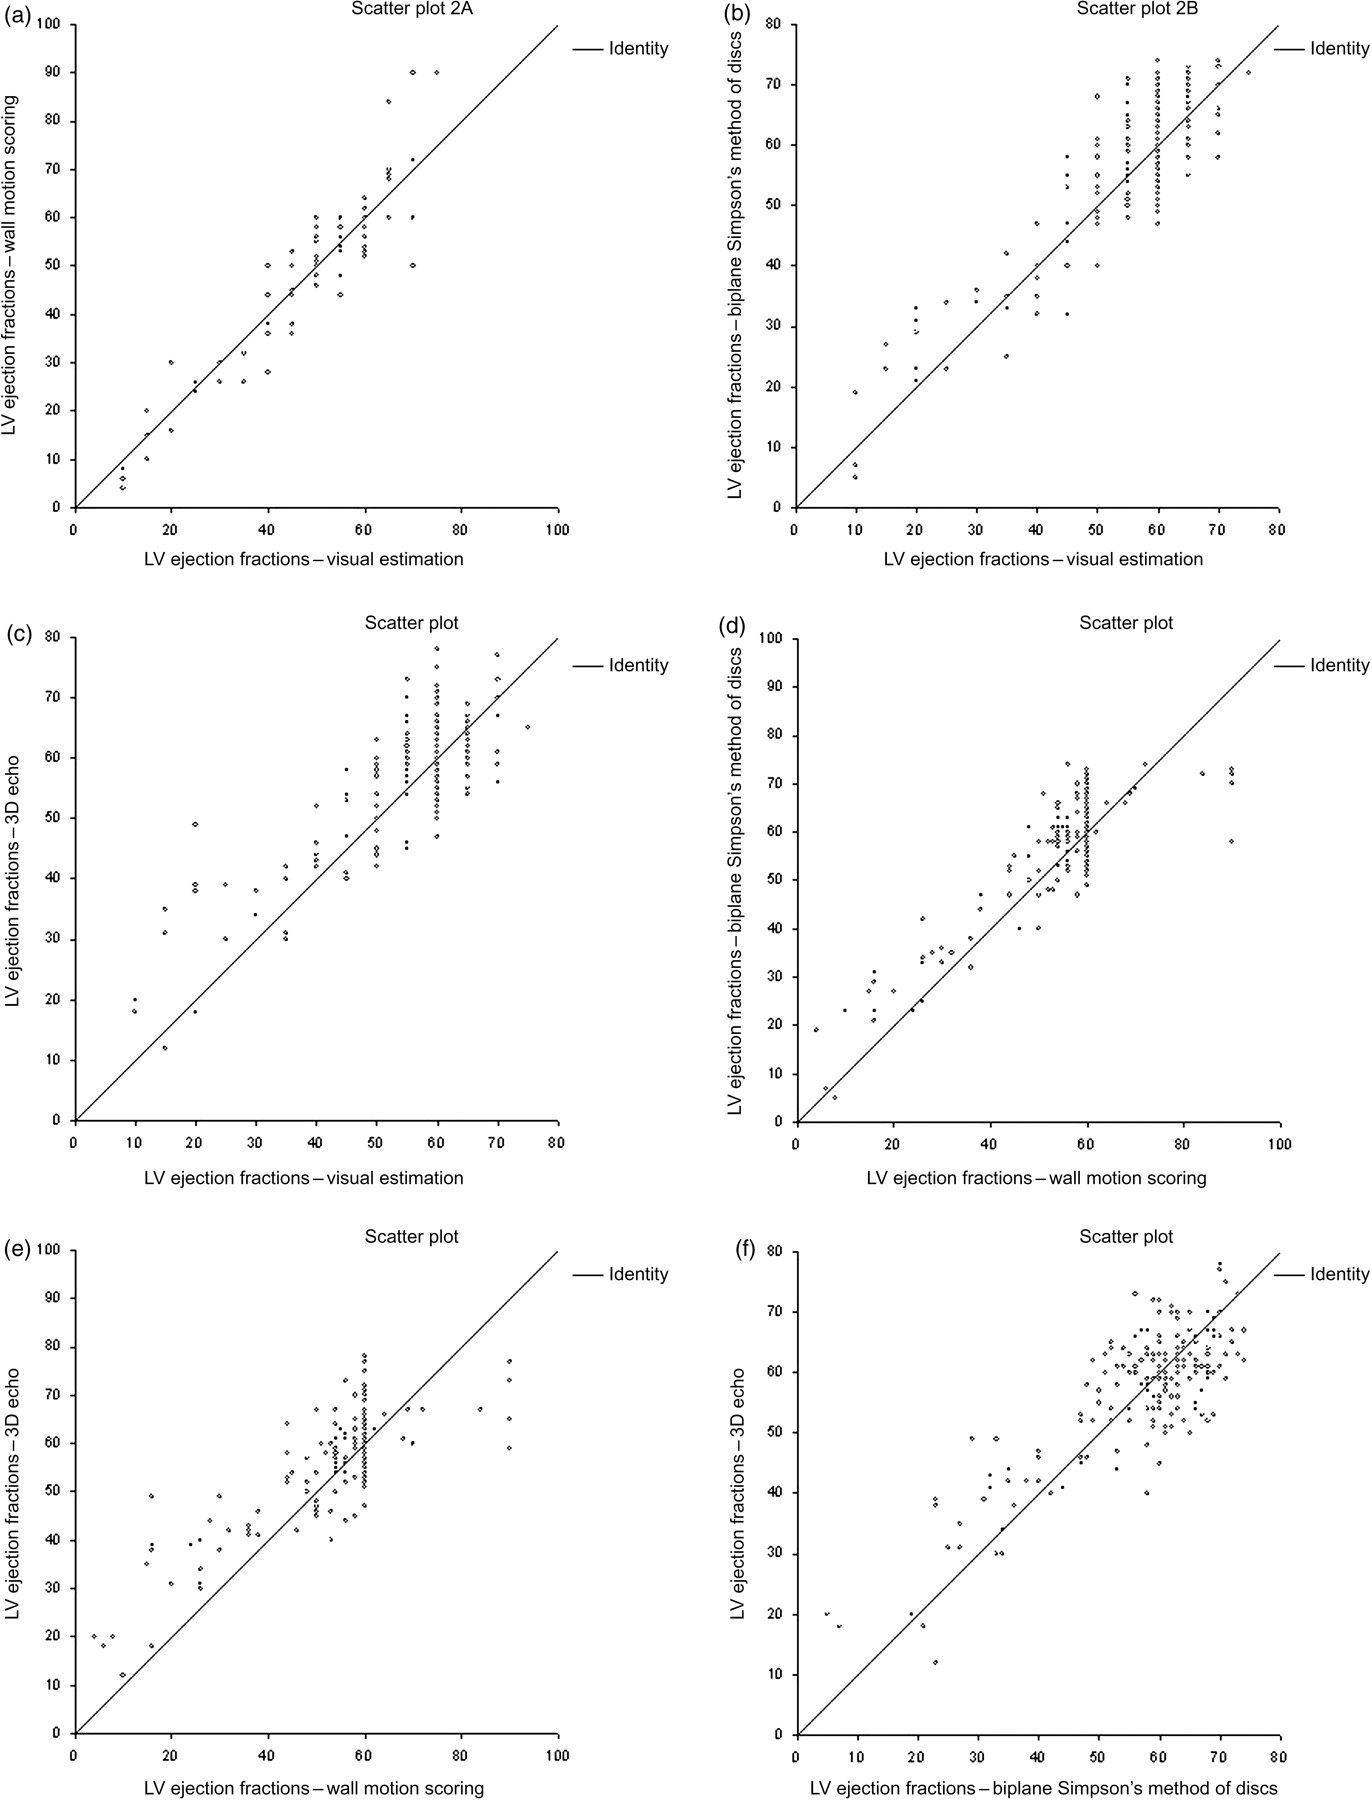
(a–f) Bland–Altman scatter plots comparing ejection fractions calculated for each subject by visual estimation, wall motion scoring, biplane Simpson's method and three-dimensional echocardiography
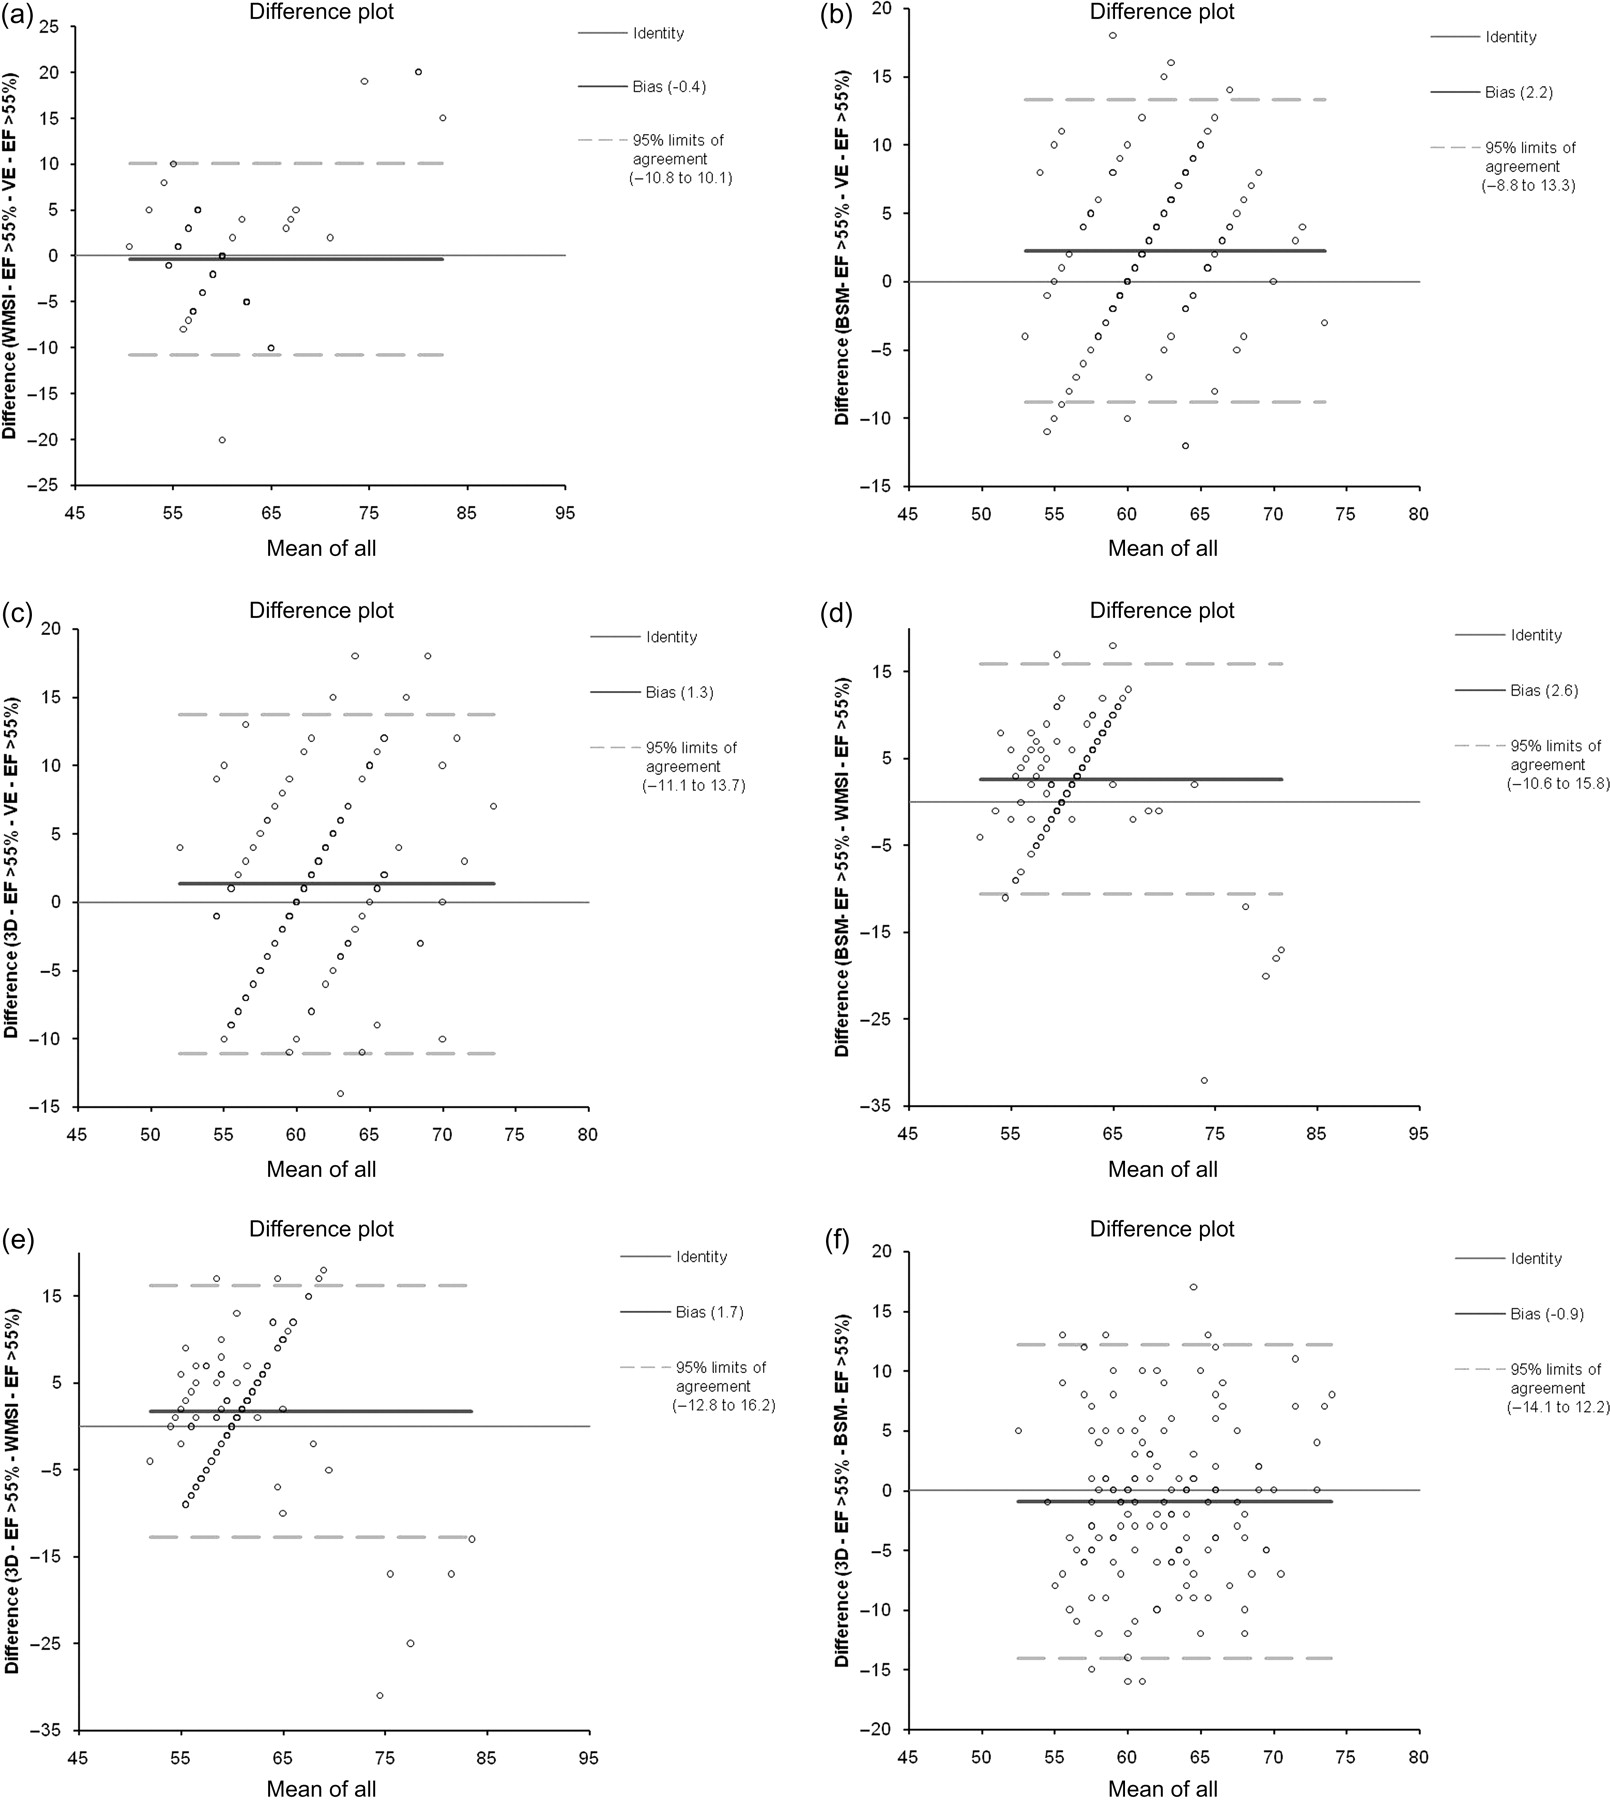
(a–f) Bland–Altman difference plots comparing ejection fractions calculated for each subject by visual estimation, wall motion scoring, biplane Simpson's method and three-dimensional echocardiography
Significance, bias and 95% limits of agreement between the methods of assessing ejection fraction
CI, confidence interval; 3D, three dimensional
*Denotes significance
Mean ejection fraction was calculated as an average of all four ejection fractions for each subject, then used to group subjects into functional categories of ejection fraction: normal left ventricular function (>55%), mild–moderate left ventricular dysfunction (35–55%) and severe left ventricular dysfunction (<35%). 26,27 From the total number of subjects assessed (190), 141 (74%) had a mean ejection fraction of >55%, 32 (17%) had a mean ejection fraction of 35–55% and 17 (9%) fell into the category of ejection fraction <35%. Table 4 shows the P values generated by Bland–Altman analysis of the different methods within each category.
Bland–Altman analysis including P values for categories of function: normal function (>55%), mild–moderate left ventricular dysfunction (35–55%) and severe impairment of function (<35%)
EF, ejection fraction; 3D, three dimensional
*Denotes significance
These analyses show that in the two categories of function <35% and >55% the significance values generally follow that of the main statistical analysis. All methods agreed (P > 0.05) in the mid-range of ejection fraction 35–55%. All methods give statistically different results (P < 0.05) in the range >55% (except in the cases of visual estimation versus wall motion scoring, and biplane Simpson's method versus 3D echocardiography) and in the range <35% (except visual estimation versus wall motion scoring). Interestingly, biplane Simpson's method versus 3D echocardiography (which agreed in the main analysis with bias of 0) showed statistical significance in the category of ejection fraction <35% (P < 0.05 with bias of 5.9).
Repeatability coefficients (%) with limits of agreement (lower and upper 95% limits) were also calculated for the repeated measurements of each method to facilitate the comparison and interpretation of the limits of agreement calculated for the method comparisons as follows: visual estimation (9%, –7.8 to 9.8), wall motion scoring index (5%, –4 to 5.6), biplane Simpson's method (9.8%, –9.8 to 9.3) and 3D echocardiography (9.8%, –9.8 to 9.3).
Discussion
The four methods described in this study all have advantages, limitations and sources of error which may affect agreement between them. Visual estimation is a subjective assessment that can be performed quickly on poor quality images, 18 but demands high levels of sonographer experience to estimate accurate and repeatable ejection fractions. 28 Errors may also be introduced when the left ventricular cavity size is either very large or very small, the cardiac rhythm is irregular, or when there is tachycardia or bradycardia. 29
Wall motion scoring is also a subjective assessment that can be performed on poor quality images. 30 However, it is a time-consuming process 19 and is still also a subjective assessment which is highly operator dependent. 24,31
Biplane Simpson's method has been validated in the literature by many studies 32,33 where it has been found to closely predict angiographic ejection fraction and volumes. Limitations include the subjectivity associated with tracing of the endocardial borders from frozen images, especially in patients with poor image quality 18,19,34,35 and a reliance on geometric assumptions. 29,36–38
3DE interrogates all regions of the myocardium and incorporates them into an ejection fraction determination avoiding geometric assumptions and may reduce the experience required to produce accurate and reliable measurements compared with that needed with qualitative techniques due to semiautomatic boundary detection algorithms. 39 Limitations of 3DE are the dependence on good quality 2D images, relatively expensive specialist transducers and software needed to perform 3DE imaging, and temporal artefacts caused by patient motion and irregular cardiac rhythms. 40
This study demonstrates a lack of agreement between qualitative methods (visual estimation and wall motion scoring) and quantitative methods (biplane Simpson's method and 3DE), consistent with those found in recent literature. 18,41 Results also indicate that despite no significant over or underestimation between visual estimation and wall motion scoring, the limits of agreement between these methods are wide and repeatability coefficients for within-method variability of visual estimation is almost double that of wall motion scoring. This lack of repeatability between qualitative methods limits the possible agreement which is limited by observer subjectivity. 19,28,31 The findings, therefore, indicate that a qualitative and quantitative method should not be used interchangeably, and also visual estimation and wall motion scoring methods should not be used interchangeably for the serial assessment of LVEF.
There was no statistical difference or significant over or underestimation of ejection fraction between biplane Simpson's method and 3DE, consistent with studies that demonstrate good correlation between the quantitative methods (although when both methods are compared with a gold standard [cMRI] 3DE was found to be more accurate for assessment of left ventricular volumes and ejection fraction). 12–17
However, the limits of agreement indicate that despite no significant difference or bias, there is a wide range between the limits of agreement where the repeatability co-efficient of the biplane Simpson's method and 3DE make up a large proportion of the total variability. Therefore, due to wide limits of agreement, biplane Simpson's method and 3DE should not be used interchangeably in the serial assessment of LVEF.
The variability of repeat values by biplane Simpson's method may be due to inconsistent positioning of the scanning planes resulting in off-axis images with resultant variations in ejection fraction. 42 Operator subjectivity and image quality is discussed by Whalley et al. 43 who regard quantitative methods of assessing ejection fraction as unreliable due to manual identification and tracing of the endocardial border. 34 Despite a lack of geometric assumptions associated with 3DE, image quality still depends on the 2D image and the ability of the operator to obtain a motion and artefact free data-set. 44 Endocardial borders are tracked through the cardiac cycle by semi-automatic border detection minimizing operator intervention, 45,46 although a degree of operator subjectivity is required to place the annular and apical landmarks, and to correct the border delineation to ensure correct tracking of endocardial contours.
An inconsistent result was a significant statistical difference and bias between the two quantitative methods in the functional group with severe impairment of function. It was observed that 94% (16/17) of left ventricles were dilated compared with 0.03% (5/173) of the other groups combined.
This inconsistency may therefore be due to asymmetric left ventricular remodelling, a theory supported by the works of Wyatt et al., 47 Ertl et al., 48 Jiang et al., 49 and in particular Buck et al. 50,51 who found that the two methods lacked agreement in left ventricles with distorted geometry, and while there was no over or underestimation between methods for LVEF, agreement was poor.
Clinical ramifications of agreement between methods
Implantation of implantable cardioverter defibrillator (ICD), biventricular pacemaker or inclusion to begin Trastuzumab requires an absolute ejection fraction. 4,5,52 The BSE recommends the use of either biplane Simpson's method or 3DE. 10 In light of this study it is pertinent to argue that either method may be used for the initial baseline scan. Bias indicates no over or underestimation of ejection fraction and hence a patient is no more likely to be excluded from receiving treatment using biplane Simpson's method than they would be using 3DE to assess LVEF.
NICE guidelines also state a reduction in ejection fraction of 10% (and to below 50%) from pre-treatment baseline measurement contra-indicates continued use of Trastuzumab. 5 The repeatability coefficients of all methods were less than the 95% limits of agreement between methods, indicating intra-method variability was less than inter-method variability. To maximize repeatability and potentially identify a true change of ejection fraction of 10% it is proposed that any subsequent scans to assess LVEF should be performed using the same method that was used to assess the baseline value and for all subsequent assessments.
In the cohort with severe left ventricular impairment and dilation, where ejection fraction is used to assess suitability for implantation of an ICD or biventricular pacemaker, the quantitative methods show significantly different results and bias with biplane Simpson's giving lower ejection fractions than 3D echocardiography. This further emphasizes the need to use standard and consistent methods.
Limitations and further study
Intracardiac opacification (contrast) agents were not used in this study due to expense and time constraints. Contrast agents allow better visualization of the left ventricular cavity where delineation of the endocardial border improves the accuracy of ejection fraction estimates 53–55 and may improve the agreement between echocardiographic methods. The American Society of Echocardiography advocate use of contrast to make accurate assessment of ejection fraction in 2D imaging 56 and 3D echocardiography, 57 which may prove to be an important area for further study, especially for inclusion criteria where measurement of absolute ejection fraction needs accurate and reliable assessment.
Interobserver variability was not assessed in this study as all LVEF measurements were performed by a single experienced sonographer. However, this limits the external validity of the research and would merit further study. It is common for the serial assessment of ejection fraction to be performed by different sonographers on subsequent scans for clinical patient follow-up to detect ongoing left ventricular remodelling or to study the effect of medical or surgical intervention. The degree of repeatability within and between different sonographers is therefore extremely important. Previous studies that have investigated interobserver variability include Schiller and Foster, 36 who reported that inter-observer variability is greater in qualitative estimates of LVEF than quantitative, while Gopal et al. 17 reported that inter-observer variability using biplane Simpson's method was double that of 3DE.
Further study should also address new automated methods of assessing ejection fraction, such as 4DLVQ scanning (GE Vingmed, Horten, Norway), which utilizes advances in matrix transducer and temporal data to automatically measure ejection fraction and is less prone to artefacts and variable heart rhythms while reducing analysis time and improving measurement accuracy and repeatability. 58 Philips Tissue Motion Quantification software also allows an alternative automated ejection fraction technique based on speckle tracking technology. 59
Conclusion
This study showed that the limits of agreement between four echocardiographic methods (visual estimation, wall motion scoring, biplane Simpson's method and 3D echocardiography) were unacceptable in a clinical setting. This demands accurate and reproducible assessment of LVEF in the context of absolute ejection fractions used as inclusion criteria for some interventions and therapies. In view of these findings, these methods should not be used interchangeably in the serial assessment of LVEF.