




Abstract
Assessment of dynamic plaque behaviour may help identify vulnerable carotid plaque before rupture and hence has potential clinical value for screening patients at risk of stroke. The aim of this study was to develop non-invasive ultrasound methods for quantifying dynamic plaque and vessel wall behaviour and assess their potential clinical utility. Ultrasound data from the carotid arteries of one normal subject and four patients with atherosclerotic disease were acquired using a 10 MHz linear array transducer recording raw RF/IQ data at a frame rate up to 80 Hz for 3–6 seconds. Image reconstruction and processing was performed using Matlab. Speckle tracking techniques were developed to characterize: (1) intraplaque deformation; and (2) plaque surface and vessel wall motion. Speckle tracking techniques were able to measure the range of intraplaque tissue deformation (–1.3 to 1.7 mm), plaque surface displacement (0.2–0.7 mm) and vessel wall radial strain (0.02–0.13) throughout the cardiac cycle. The feasibility of using an intraplaque deformation parameter, based on the deformation of a square template, is demonstrated. Speckle tracking techniques can be used to assess dynamic carotid plaque behaviour. Further work is required to evaluate how best to quantify biomechanical behaviour to help predict plaque rupture and hence improve risk stratification models for stroke.
Stroke is a leading medical and health-care problem, as it is one of the main causes of death and long-term disability worldwide. 1 Several studies have demonstrated that patients with carotid plaques carry an increased risk of cardiovascular events, such as stroke, transient ischaemic attack, myocardial infarction and even death. Large European and North American clinical trials have established the benefit of carotid endarterectomy in reducing the risk of recurrent stroke for symptomatic patients with severe stenosis. However, the difficulty in identifying unstable plaque means that many patients undergo ‘unnecessary’ operations. The number of patients needed to treat to prevent one stroke in two years is estimated as eight for high-grade stenosis and 20 for moderate stenosis. 2 Even in a high-risk patient group, 3 the importance of early surgical intervention in reducing the number needed-to-treat has been demonstrated. 2 There is an increasing realization that the degree of stenosis is a poor predictor of individual stroke risk and that current risk stratification models need improvement. Current clinical practice for selecting which patients will have a carotid endarterectomy operation is heavily reliant on assessing the degree of arterial lumen narrowing. This is widely assessed using non-invasive ultrasound measurements of blood flow velocity as a surrogate measure of stenosis. Studies have investigated the clinical utility of assessing the greyscale plaque appearance but these have been inconclusive, with some studies suggesting hyperechoic plaques may represent an increased risk of cerebrovascular events, 4 and other studies indicating echolucent plaques as a marker for unstable plaques. 5 Analysis of plaque image texture in addition to quantification of greyscale median has also been investigated in efforts to improve reliability and demonstrate the clinical value of greyscale image analysis. 6
The dynamic behaviour of plaque is likely to play an important role in the process of plaque rupture and embolization. The plaque and the surrounding tissue demonstrate a periodic motion driven by the time-varying blood pressure and flow within the artery. It has been suggested that the consequent movement of the arterial wall and plaque may cause mechanical stress, leading to minor cracks and fissures. 7,8 Diverse studies support the hypothesis that vulnerable carotid plaque, which is at risk of rupture, can be identified by assessment of dynamic plaque behaviour. Clinical and laboratory studies have demonstrated the importance of the physical properties, structure and composition in defining vulnerable plaque. 9 Computational models simulating the geometry, haemodynamics and stresses exerted on plaque have predicted the potential for significant, time-varying forces. 10 A topical example is the dramatic success of lipid-lowering statin therapy in the prevention of cardiovascular events, attributed to the reduction of high internal plaque stress associated with lipid pool deposits. 7 The ability of intravascular ultrasound elastography imaging techniques to characterize plaque has been demonstrated in laboratory studies, animal models 8 and clinical studies. 11 Magnetic resonance imaging techniques have shown promise in identifying vulnerable plaque based on composition, 12 but are expensive and not suitable as a routine screening tool.
Ultrasound imaging techniques are well-suited to the measurement of tissue motion with high spatial and temporal resolution throughout the cardiac cycle. Furthermore, ultrasound has considerable advantages in terms of cost, speed, non-invasive screening and clinical implementation. Initial studies have demonstrated the clinical potential of using non-invasive ultrasound imaging of dynamic plaque behaviour. 13–18 Significantly, plaque motion parameters related to the difference between local maximum and minimum intraplaque velocities were able to distinguish between symptomatic and asymptomatic patients. 13,16 Iannuzzi et al. 15 investigated patients with transient ischaemic attacks and found that longitudinal motion occurred more often in the ipsilateral plaques than in the contralateral ones. 15 An early study by Chan 19 demonstrated two-dimensional (2D) motion analysis in ultrasound images at low frame rates and for a small number of tracked points. 19 Golemati et al. 14 demonstrated region tracking and quantification of relative motion between a limited number of points within the plaque and in the carotid wall and surrounding tissue by using a 2D cross-correlation block matching technique on ultrasound B-mode images. 14 Dahl et al. 13 developed a cross-correlation technique to track intraplaque motion and quantified various plaque motion parameters. 13 Meairs and Hennerici 16 used 4D ultrasonic characterization of plaque surface motion and showed that maximum surface velocity of carotid artery plaques is significantly different in asymptomatic and symptomatic patients and may be a useful parameter to identify vulnerable plaques. 16 Recent commercial imaging modalities such as tissue Doppler imaging, elastography and shear wave elastography techniques have also been introduced to provide information on the biomechanical properties of tissues. Studies are required to evaluate the clinical value of these techniques and their potential implementation into the vascular ultrasound clinic.
The aim of this pilot study, which formed part of an MSc project, was to develop non-invasive ultrasound methods for quantifying dynamic plaque and vessel wall behaviour, based on speckle tracking image processing techniques. Novel methods of quantifying plaque distortion are required and in this study we tracked the distortion of a five-point square template, placed within the plaque and considered its potential clinical utility on preliminary patient data.
Methods
Speckle tracking algorithm
Tissue displacement through an ultrasound image sequence was assessed by tracking the positions of small regions of speckle pattern through consecutive frames. To determine the shift in location of a region of speckle between the first ultrasound image and the next, a small square region of the first image containing the speckle pattern (the template) is scanned around a defined search field in the second image to find the position where they match, as shown in Figure 1. Further movements are measured by tracking the displacement of the template through subsequent images in the sequence.
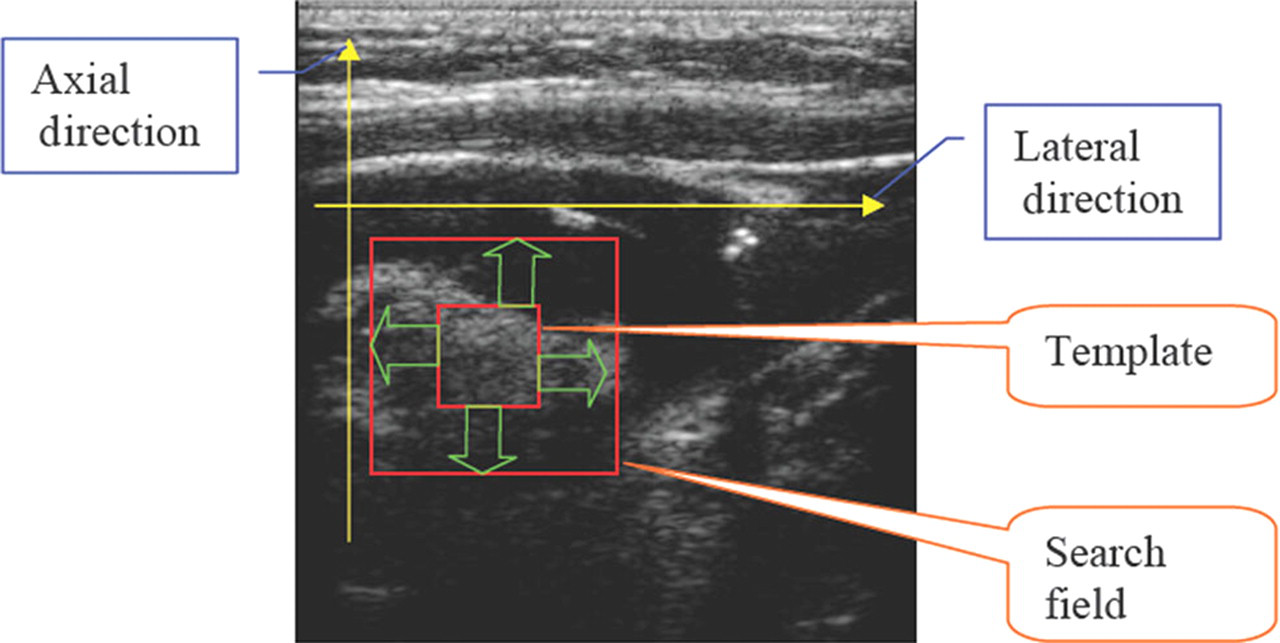
In this study, the similarity of the template to the image, at each point in the search field, was assessed by calculating their normalized correlation coefficient (NCC). This method is commonly used in image processing applications where the brightness and contrast of the image and template may vary.

The NCC is defined in Equation (1). 20 Here, f(x, y) are the pixel values in the search field. The template t(x, y) is scanned through each position in the search field by displacing u pixels in the x direction and v pixels in the y direction. Pixel values f(x, y) are normalized at each position (u, v) by subtracting their mean value f u,v in the region under the template and dividing by the standard deviation. Template values t(x − u, y − v) are normalized in the same way (ŧ is the mean of the template values). The correlation coefficients for each position u, v are stored in a matrix. The coefficients can range in value from –1.0 to 1.0. The correlation results in 1 when an exactly identical pattern is found. In the case of noisy images and deformable patterns the best correlation will be the value closest to 1. The highest NCC value in the matrix defines the most likely position, where the template matches the speckle in the search field.
In this study, distortion in the image was measured by tracking five small template regions, arranged in a square (the intraplaque deformation square) as illustrated in Figure 2. Each small template had dimensions of 41 × 41 pixels (3 × 3 mm). The speckle patterns of these five points were searched for in each sequence of images using the speckle tracking algorithms defined above and the locations of best match of the templates in each image stored in memory. From this, the displacements of the templates in a sequence of images through the cardiac cycle could be displayed.
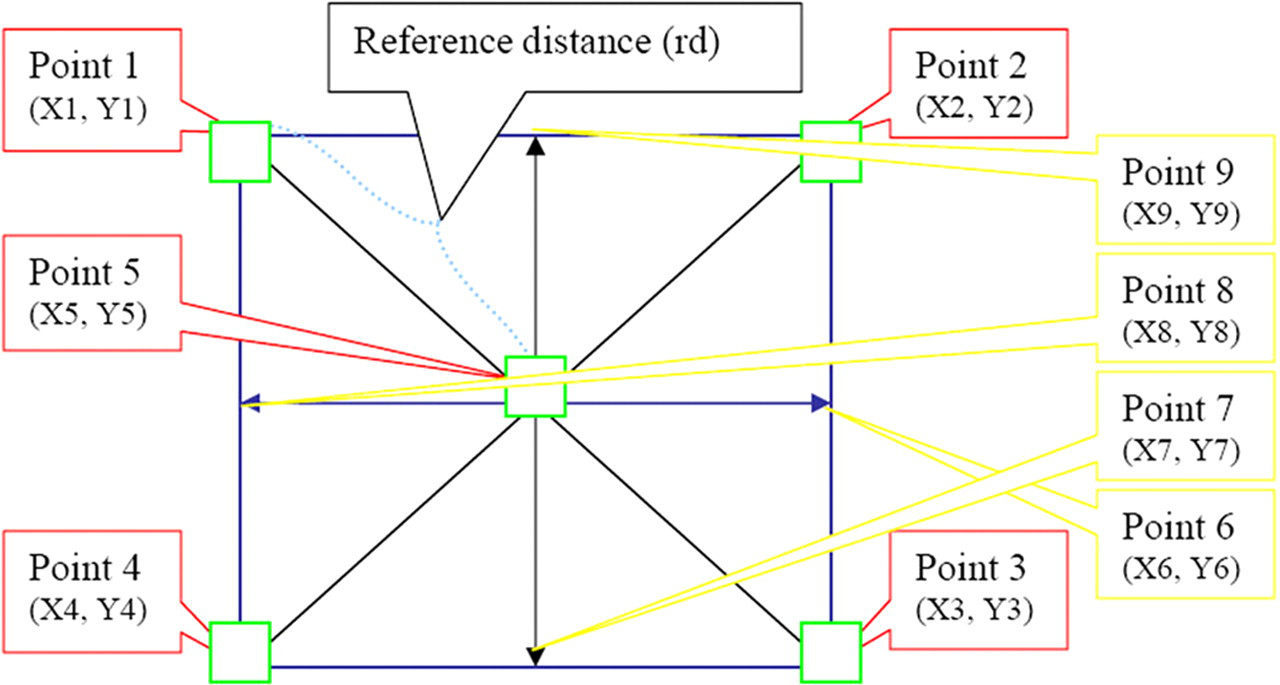
Intraplaque deformation square: this figure depicts the intraplaque deformation square, which consists of five main tracked points, four interpolated points and a reference distance
Data collection
Subjects
One normal volunteer and four patients presenting through the Leicester Royal Infirmary Vascular Studies Unit for carotid artery studies were recruited. In accordance with the Declaration of Helsinki, informed consent and ethical approval for the study was obtained. Subjects were scanned by an experienced vascular technologist using a Z.one (Zonare Medical Systems, Inc., Mountain View, CA, USA) ultrasound scanner with a L10-5 linear array probe. Longitudinal sections of the carotid plaque and vessel walls were recorded. Ultrasound data were collected from diseased carotid arteries at the location of stenotic plaque at the bifurcation of the common carotid artery (CCA) and the proximal internal carotid artery. Data were acquired for a period of 3–6 seconds at a frame rate of 80 Hz for all subjects except patient 1 (10 Hz acquisition).
Data analysis
The Z.one ultrasound scanner is an open architecture platform providing access to the raw RF data. A software research tool named ‘IQscan’ introduced on the z.one system (Zonare Medical Systems, Inc) enables the in-phase/quadrature (I/Q) components of preprocessed image data to be acquired and exported. Offline image reconstruction and processing was performed for each patient data-set using Matlab (The MathWorks, Inc., Natick, MA, USA).
Plaque deformation
The displacement of a body may have two components: a rigid-body displacement and a deformation. A rigid-body displacement of plaque consists of a simultaneous translation and rotation of the plaque without changing its shape or size. Deformation implies a change in the shape and/or size of the plaque, from an initial or undeformed configuration, to a current or deformed configuration. A 2D model of plaque deformation was obtained by inserting the intraplaque deformation square within the image of the plaque (Figure 3). One point is selected with interactive mouse control on the first B-mode ultrasound image and four other points are drawn automatically by the software. The size of the deformation square can be modified to suit the plaque size. The reference distance is defined as the distance between one of the corner points of the deformation square and the middle point. Points 6, 7, 8 and 9 are defined as the linear interpolation of each pair of adjacent corner points to produce nine points as 3 × 3 matrices (Figure 2). Compression and stretch of the plaque during the cardiac cycle was quantified by following the reference distance changes. Displacement of the five points during the cardiac cycle was also followed.
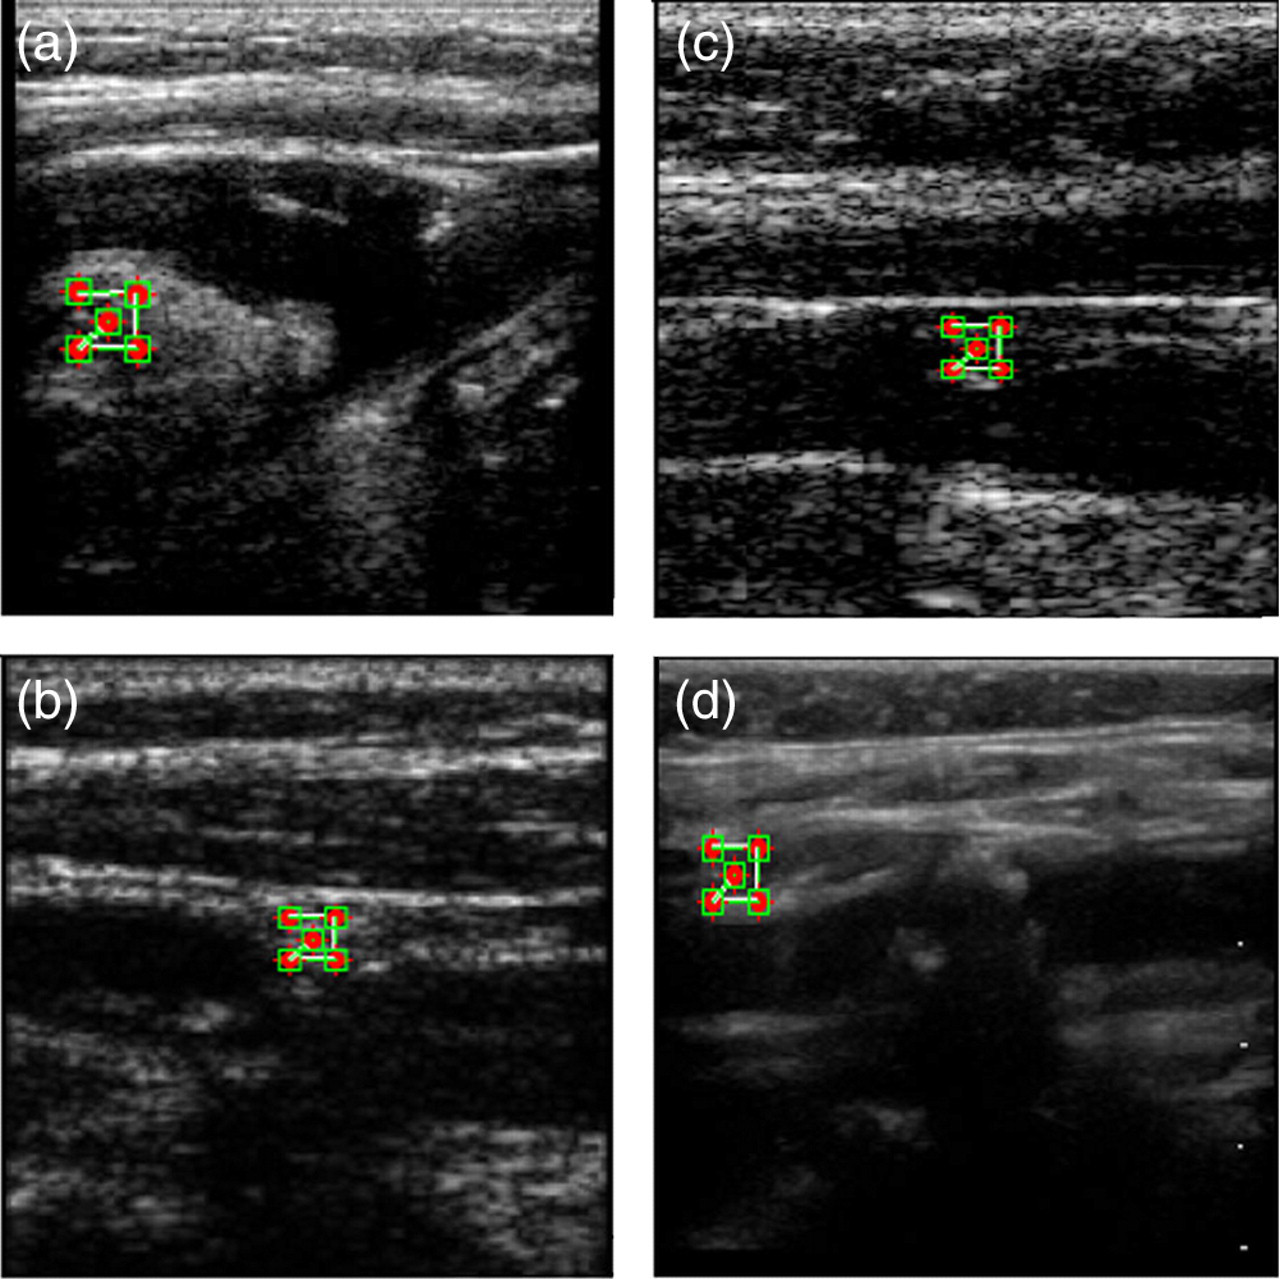
Plaque deformation: intraplaque deformation squares placed on plaque images from four patients to quantify plaque deformation. (a) patient 1; (b) patient 2; (c) patient 3; (d) patient 4
Plaque surface tracking algorithm
Plaque surface tracking was performed by selecting five points (small templates) on the surface of the plaque in the first captured B-mode image and tracking them in a sequence of B-mode images previously acquired from patients (Figure 4). The templates were tracked in lateral and axial directions, using the speckle tracking method described earlier, to identify symmetrical or asymmetrical surface movements at each location. The displacement of each point was measured and plotted for the sequence of B-mode images. The acquired trajectories and displacement values of the five points were compared with each other for the sequence of images to identify irregular surface movements.

Plaque surface tracking: five points selected and tracked on the surface of carotid plaques to identify symmetrical or asymmetrical plaque surface movements. (a) patient 1; (b) patient 2; (c) patient 3; (d) patient 4
If L1 (x
1, y
1) is defined as the location of a template in the first B-mode image, its location in the next image may change to L2 (x
2, y
2) due to haemodynamic blood pressure changes during the cardiac cycle. Displacement D of the template is calculated using Equation (2):

Carotid artery wall motion
Wall motion of the carotid arteries was measured by speckle tracking of eight user-defined points on the anterior and posterior vessel walls. The diameter and wall motion displacements through the cardiac cycle were computed using the speckle tracking method described earlier.
Validation of speckle tracking methods
A computer model was created for validation of the speckle tracking methods. Three identical square patterns were embedded in carotid artery images taken from a healthy subject. The motion and tracking of those three patterns were analysed to estimate the accuracy of the speckle tracking algorithms. Each pattern was set to move in different directions at different speeds. One hundred and fourteen images were acquired and the displacement of each pattern was computed in each image. The start and end depths of the field of view of the acquired carotid artery images were, respectively, 5.47 and 23.42 mm, the width of the field of view 38.4 mm, and the acquisition frame rate 24 Hz.
The image size after a shading operation (image smoothing by pixel interpolation) was 210 × 449 pixels and each pixel is 0.0855 × 0.0855 mm. Each test pattern had a size of 20 × 20 pixels, which is equal to 1.7 × 1.7 mm (depth × width). Pattern 1 moved down by one pixel for each frame and thus the velocity for pattern 1 (vp1) can be calculated from

Pattern 2 moves a pixel down and a pixel right for each frame and thus velocity for pattern 2 can be calculated by

Pattern 3 moves one pixel lower and one pixel to the left at the same speed as pattern 2. Patterns 1 and 2 are at the same level in the image but pattern 3 is one pixel behind patterns 1 and 2, demonstrating the ability of the speckle tracking algorithm to differentiate between patterns during tracking.
Results and discussion
In this study, speckle tracking techniques were developed and used to quantify plaque surface motion, carotid artery wall motion and intraplaque deformation based on a novel deformation square technique.
Plaque deformation
We examined four patients and, depending on the size of the plaque in each patient, the dynamic behaviour was quantified by tracking speckle movements in a deformation square template through a sequence of images of the plaque. The results of the four patients are presented in Table 1. Mean deformation, maximum stretch and maximum compression over a cardiac cycle were calculated for each plaque and the results were used to provide an estimate of the elasticity of the plaque. Positive deformation implies that stretch occurs between points in the template. Conversely, negative deformation means that compression occurs. The analyses were carried out on velocity parameters. These are directly proportional to the tissue displacement and thereby representative of motion. Examples of plaque deformations for each of the four patients are shown in Figure 3. In addition, supplementary video 1 (
Plaque deformation statistical results (all values in μm)
CA, carotid artery
Our intraplaque deformation results demonstrate that intraplaque deformation caused by haemodynamic blood pressure during the cardiac cycle can be quantified by tracking the deformation of the plaque square. This intraplaque deformation square approach may be clinically useful to differentiate plaque composition. Heterogeneous plaques consist of regions with different elastic properties, depending on the composition of plaque structures at different locations. These would be expected to exhibit different deformation rates within the plaque at the location of calcifications, fibrous matrix, lipid deposits and intraplaque haemorrhages. 16 An example of how these results may be interpreted is given by consideration of patient 1 as a case example. With reference to Table 1 and Figure 5b, points 2, 4 and 5 have approximately the same level of stretch and compression values and their mean deformation is around zero. This plaque may show the characteristics of a calcified plaque type and exhibits a hyperechoic image, which is often associated with fibrous and calcified plaques. 4,5 Point 1 has a small difference in mean deformation, perhaps representing a softer plaque. Point 3 shows a large deformation and may be an example of intraplaque haemorrhage or fibrous matrix. The maximum stretch at that point is three times greater than the other points. Similar considerations may be used to help characterize plaque type based on the dynamic square deformation but require further studies to relate how dynamic behaviour correlates with plaque composition. These might be determined by pathohistology studies following carotid endarterectomy. It may be possible to derive a dynamic plaque index based on our deformation square approach or alternative statistical quantification of plaque motion as discussed by Dahl et al. 13

Deformation and displacement plots. (a) Plaque surface displacement trajectories during the cardiac cycle at each point. (b) Intraplaque deformation occurred at each point (vertical displacement scale is in pixels)
Plaque surface displacement
Analysis of symmetrical and asymmetrical surface motion of plaque may help identify the risk of plaque rupture. We investigated plaque surface displacement in four patients by tracking five points on the plaque surface. Symmetrical and asymmetrical movements of the plaque surface were demonstrated with this method. Figure 4 shows an example of carotid plaque surface tracking in patient 1. The displacement results for each of the four patients are given in Table 2. The minimum displacement is always zero corresponding to no displacement. The results from patient 1–plaque 1 show that it has symmetrical surface movements at all five points. Points 1, 2 and 3 have similar displacement plots (Figure 5a) and values but points 4 and 5 have little difference in displacement values. The mean and maximum displacements are almost identical for all points as can be seen in their similar displacement trajectories (Figure 5a). The mean displacement of each point is smaller than the radial carotid artery wall displacement. Based on the statistical factors stated in Table 2, we can say that this plaque has symmetrical surface movements. The results of patient 1–plaque 2 show that it has symmetrical surface movements at point 2, 3, 4 and 5 but point 1 shows a small difference. The mean and maximum displacement values for all points are smaller than the radial artery wall displacement. Patient 1–plaque 3 has symmetrical surface movements but there are small differences between points. According to the statistical results in Table 2, points 3, 4 and 5 have similar displacement values and the mean and maximum displacements values are around the radial artery wall displacement.
Plaque surface displacement statistical results (all values in μm)
CA, carotid artery
In contrast, patient 2–plaque 1 demonstrates asymmetrical surface movements at all points. There are similar displacement values only between points 3 and 4. All other points have different displacement values in Table 2. Patient 2–plaque 2 has similar plaque surface movements at points 3 and 4 but has different surface movements at points 1, 2 and 5. Similarly, patient 3–plaque 1 shows large differences and asymmetrical movements at all points according to statistical data in Table 2. Supplementary video 2 (
Several previous studies have suggested that asymmetrical plaque surface movements or deformation can cause plaque rupture. Meairs and Hennerici 16 estimated plaque surface motion and deformability using an optical flow method. Golimati et al. 14 and Dahl et al. 13 described a block-matching technique (2D cross-correlation) to evaluate plaque surface motion. Block-matching and optical flow methods have been used to show motion trajectories of the plaque surface. We used a speckle tracking method, similar to block-matching, to identify symmetrical and asymmetrical movements of the plaque surface. The results show that it is a practical tool for the evaluation of plaque surface movements. In addition, plaque surface motion is tracked simultaneously with radial diameter changes of the carotid artery.
Carotid artery wall motion
Carotid artery wall motion can also be assessed by speckle tracking to identify symmetrical and asymmetrical movements of the artery wall during the cardiac cycle at different locations. Supplementary video 3 (

Carotid artery wall motion: the selection of eight points on the surface of the carotid artery wall is illustrated (left). The radial diameter changes at four locations are plotted (right)
Radial strain
Values of radial strain in the carotid artery measured along four diameters (D1–D4) at selected intervals along the carotid artery, starting from the bifurcation (as shown in Figure 6)
Carotid wall motion statistics (all values in μm)
Performance of the speckle tracking method
Validation of the speckle tracking algorithms with the computer aided phantom confirmed good tracking of the artificial plaque motion. The normalized cross-correlation (NCC) algorithm has advantages and disadvantages. When the search template size is increased, the uniqueness of the template pattern increases, but this is at the expense of increased computational time and reduced tracked velocity or range resolution. Therefore, the search template size should be chosen depending on the size of the plaque and the aim of the measurement. If the size is small, the probability of encountering a similar pattern will increase and false tracking may occur. A 41 × 41 pixels (about 3 mm × 3 mm) size was used for our speckle tracking, as initial trials indicated this as an optimum search template size for tracking.
There are limitations of wall motion measurements based on speckle tracking. The rapid change in blood pressure, during the cardiac cycle at systole, may affect accuracy and cause false tracking of the wall motion. Another limitation can be observed during peak arterial pressure. The soft tissue and wall tissue have similar echo amplitudes and may lead to false tracking. These limitations can be improved by acquisition at a high frame rate and picking the optimal speckle template size for tracking. 23 Our results showed that intensity pattern changes can be tracked well for assessment of vessel wall motion.
Conclusions
In this study, speckle tracking techniques were developed and used to quantify plaque surface movements, vessel wall motion and intraplaque deformation based on a novel deformation square technique. Quantification of intraplaque deformation may help to characterize plaque composition and identify vulnerable plaque. Further work is required to evaluate how best to quantify dynamic biomechanical behaviour of the carotid arteries and plaque, to compare dynamic plaque measures with plaque composition, natural history of cardiovascular disease, and to establish the clinical value as an augmentation of the current vascular ultrasound examination.
Footnotes
ACKNOWLEDGEMENTS
This project was supported by the University Hospitals of Leicester NHS Trust. Work presented here was part of a thesis entitled ‘The dynamic assessment of carotid plaque motion and internal tissue deformation’ by Zeynettin Aktlas of KTH – The Royal Institute of Technology, Stockholm, Sweden. We wish to thank Dr Larry Mo and Dr Derek DeBusschere of Zonare Medical Systems Inc, CA, USA for their technical assistance and Tim Hartshorne, clinical vascular scientist, for performing the patient scans.