




Abstract
There is no specific duplex ultrasound (DUS) criteria for the diagnosis of inferior mesenteric artery (IMA) stenosis. This study will define the optimal duplex velocity values with the best overall accuracy (OA) in detecting ≥50% stenosis of the IMAs. Eighty-five IMAs with both DUS and mesenteric arteriography were analyzed. Eighty-five IMAs were examined: 45 were normal, 12 with <50% stenosis, eight with ≥50–69% stenosis and 15 with ≥70% stenosis (including occlusion) based on angiography. The mean peak systolic velocities (PSVs) for a normal IMA, <50% and ≥50% stenosis was 105, 215 and 392 cm/second, respectively (P < 0.0001). The most accurate PSV in detecting ≥50% stenosis was ≥250 cm/second with a sensitivity of 90%, a specificity of 96% and an OA of 95%. The most accurate end-diastolic velocity (EDV) in detecting ≥50% stenosis was ≥80% or ≥90 cm/second, with an OA of 86%, a sensitivity of 60% and a specificity of 100%. The most accurate ratio in detecting ≥50% stenosis was ≥4 or ≥4.5 with an OA of 93%.Receiver operator curves analysis showed that the PSV was not better than EDV and PSV ratio in detecting ≥50% stenosis (P = 0.1661 and 0.4568, respectively). In conclusion, specific IMA PSVs, EDVs and IMA/aortic systolic ratios can be used in detecting significant IMA stenosis with reasonable accuracy.
Introduction
Several published studies have reported the results of duplex ultrasound (DUS) utilizing different threshold velocities in detecting significant stenosis of the superior mesenteric or celiac arteries. 1–4 Although the peak systolic velocity (PSV) of a normal inferior mesenteric artery (IMA) has been reported to range from 93 to 189 cm/second, there is no specific DUS criteria for the diagnosis of significant IMA stenosis. 5 The present study will define the optimal duplex velocity cut-off values with the best overall accuracy (OA), positive predictive value (PPV) and negative predictive value (NPV) in detecting ≥50% and ≥70% stenosis of the IMAs.
Patient population and methods
Eight-five IMAs of 153 patients in whom mesenteric ischemia was suspected and who had both DUS and mesenteric arteriography during a recent eight-year period were analyzed. A list of patients who underwent mesenteric angiography for chronic mesenteric ischemia was generated and cross-referenced with the vascular laboratory report archive, which allowed identification of all patients who had both DUS and angiography within 30 days. Only patients with technically satisfactory IMA DUS and angiography were analyzed. This study only analyzed the IMA data since the superior mesenteric artery (SMA)/celiac artery (CA) data were previously analyzed. 6 This study was approved by the Institutional Review Board of Charleston Area Medical Center/West Virginia University, Charleston Division.
Mesenteric duplex ultrasound technique
Testing was done in our accredited vascular laboratory (Intersocietal Commission for the Accreditation of Vascular Laboratories) by registered vascular technologists using a Philips system (5000 instrumentation; ATL Ultrasound, Philips, Bothell, WA, USA) and utilizing low-frequency 2–5 MHz curvilinear phased array transducers at a Doppler angle of 60° or less to provide consistency in the Doppler velocities measurement. Transverse and sagittal planes were used for visualization of the upper abdominal aorta. Attention was then turned to the SMA, which was best seen on the sagittal view arising from the anterior aspect of the aorta. Since the SMA has a distinctive anatomic location, it serves as a landmark for scanning other mesenteric vessels in the upper abdomen.
The celiac artery origin is generally best accomplished in the sagittal plane, whereas its main branches (common hepatic, splenic and left gastric arteries) are best seen in the transverse view. Its classical ultrasound visualization of the T-shaped bifurcation (seagull sign) on the transverse view is characteristic landmark. Finally, the IMA can be seen as a small branch arising from the left anterolateral aspect of the infrarenal abdominal aorta.
Grayscale and color Doppler evaluation of the aorta and the mesenteric vessels is accomplished by searching for the presence of plaques and luminal narrowing. This is followed by color Doppler analysis. The sample volume (1.5 mm) must be passed slowly from the aorta into the orifice and the proximal segment of each vessel, searching for elevated PSVs or end-diastolic volumes (EDVs) and post-stenotic turbulence and bruits. All scans were interpreted by board-certified vascular surgeons with the Registered Physician Vascular Interpretation credentials.
Angiographic evaluation was performed using both abdominal aortography with lateral projection and selective intra-arterial digital subtraction of the mesenteric vessels using an SOS Omni catheter (AngioDynamics, Latham, NY, USA). The points of maximal stenosis were measured using calipers and then divided by the diameter of the normal distal artery to calculate the presence of stenosis. The angiograms were interpreted by physicians who were blinded to the DUS findings.
Statistical analysis
The velocity data were expressed as a mean plus or minus standard deviation. An analysis of variance test was used to compare the means of PSV and EDVs to the stenosis. The data analysis was performed using SAS 9.2 (SAS Institute, Inc, Cary, NC, USA) and Sigma Plot 10 (Systat Software, Inc, Chicago, IL, USA). Receiver operator curves (ROC) were used to compare angiographic data with velocity measurements to determine the optimum velocity criteria to use for detecting ≥50% IMA stenosis, which includes total occlusion, as diagnosed by no flow in the mesenteric vessel. The method of DeLong, DeLong and Clarke-Pearson 7 was used to compare ROC areas for the paired data. The difference of each area pair and its standard error and 95% confidence interval were computed. This was followed by the chi-square statistic for the area comparison and its associated P value. The sensitivity, specificity, PPV, NPV and OA were determined for specific PSV and EDV values. A significance level of 0.05 was used to determine statistical significance.
Results
Seventy-three percent were women and 27% were men. The mean age of the group was 67.8 years (range: 21–93 years).
This study included 151 SMAs, which included 35 (23%) normal, 32 (21%) with <50% stenosis, 30 (20%) with ≥50–69% and 54 (36%) with ≥70% stenosis (including seven with SMA occlusion) based on angiography.
It also included 150 celiac arteries: 24 (16%) normal, 21 (14%) with <50% stenosis, 43 (28%) with ≥50–69% stenosis and 62 (41%) with ≥70% stenosis based on angiography. The SMA/CA data were previously analysed and will not be presented here. 6
IMA data
Sensitivity, specificity, PPV, NPV and OA for velocity cut-offs and ratios for the diagnosis of <50% IMA stenosis
IMA, inferior mesenteric artery; PPV, positive predictive value; NPV, negative predictive value; OA, overall accuracy; IMA, inferior mesenteric artery; PSV, peak systolic velocities; EDV, end-diastolic volume
Bold values are the optimal duplex velocity values with the best overall accuracy in detecting greater than or equal to 50% stenosis of the IMA
Sensitivity, specificity, PPV, NPV and OA for velocity cut-offs and ratios for the diagnosis of ≥50% IMA stenosis
IMA, inferior mesenteric artery; PPV, positive predictive value; NPV, negative predictive value; OA, overall accuracy; IMA, inferior mesenteric artery; PSV, peak systolic velocities; EDV, end-diastolic volume
Bold values are the optimal duplex velocity values with the best overall accuracy in detecting greater than or equal to 50% stenosis of the IMA
ROC analysis of IMA velocities
Figure 1 is an ROC curve plotting sensitivity against specificity for diagnosing ≥50% IMA stenosis. As noted in this figure, the PSV was not better than the EDV and PSV ratio in detecting ≥50% stenosis (P = 0.1661 and 0.4568, respectively; Figure 1). The area under the curve (AUC) for PSVs, EDVs and the systolic ratios for ≥50% stenosis were 0.98, 0.72 and 0.96, respectively (Figure 1).
Receiver operator curves comparing the PSVs, EDVs and SMA/aortic PSV ratios for >50% IMA stenosis. PSV versus EDV – P = 0.1661, PSV versus IMA/Aortic PSV – P = 0.4568 and EDV versus IMA/Aortic PSV – P = 0.1542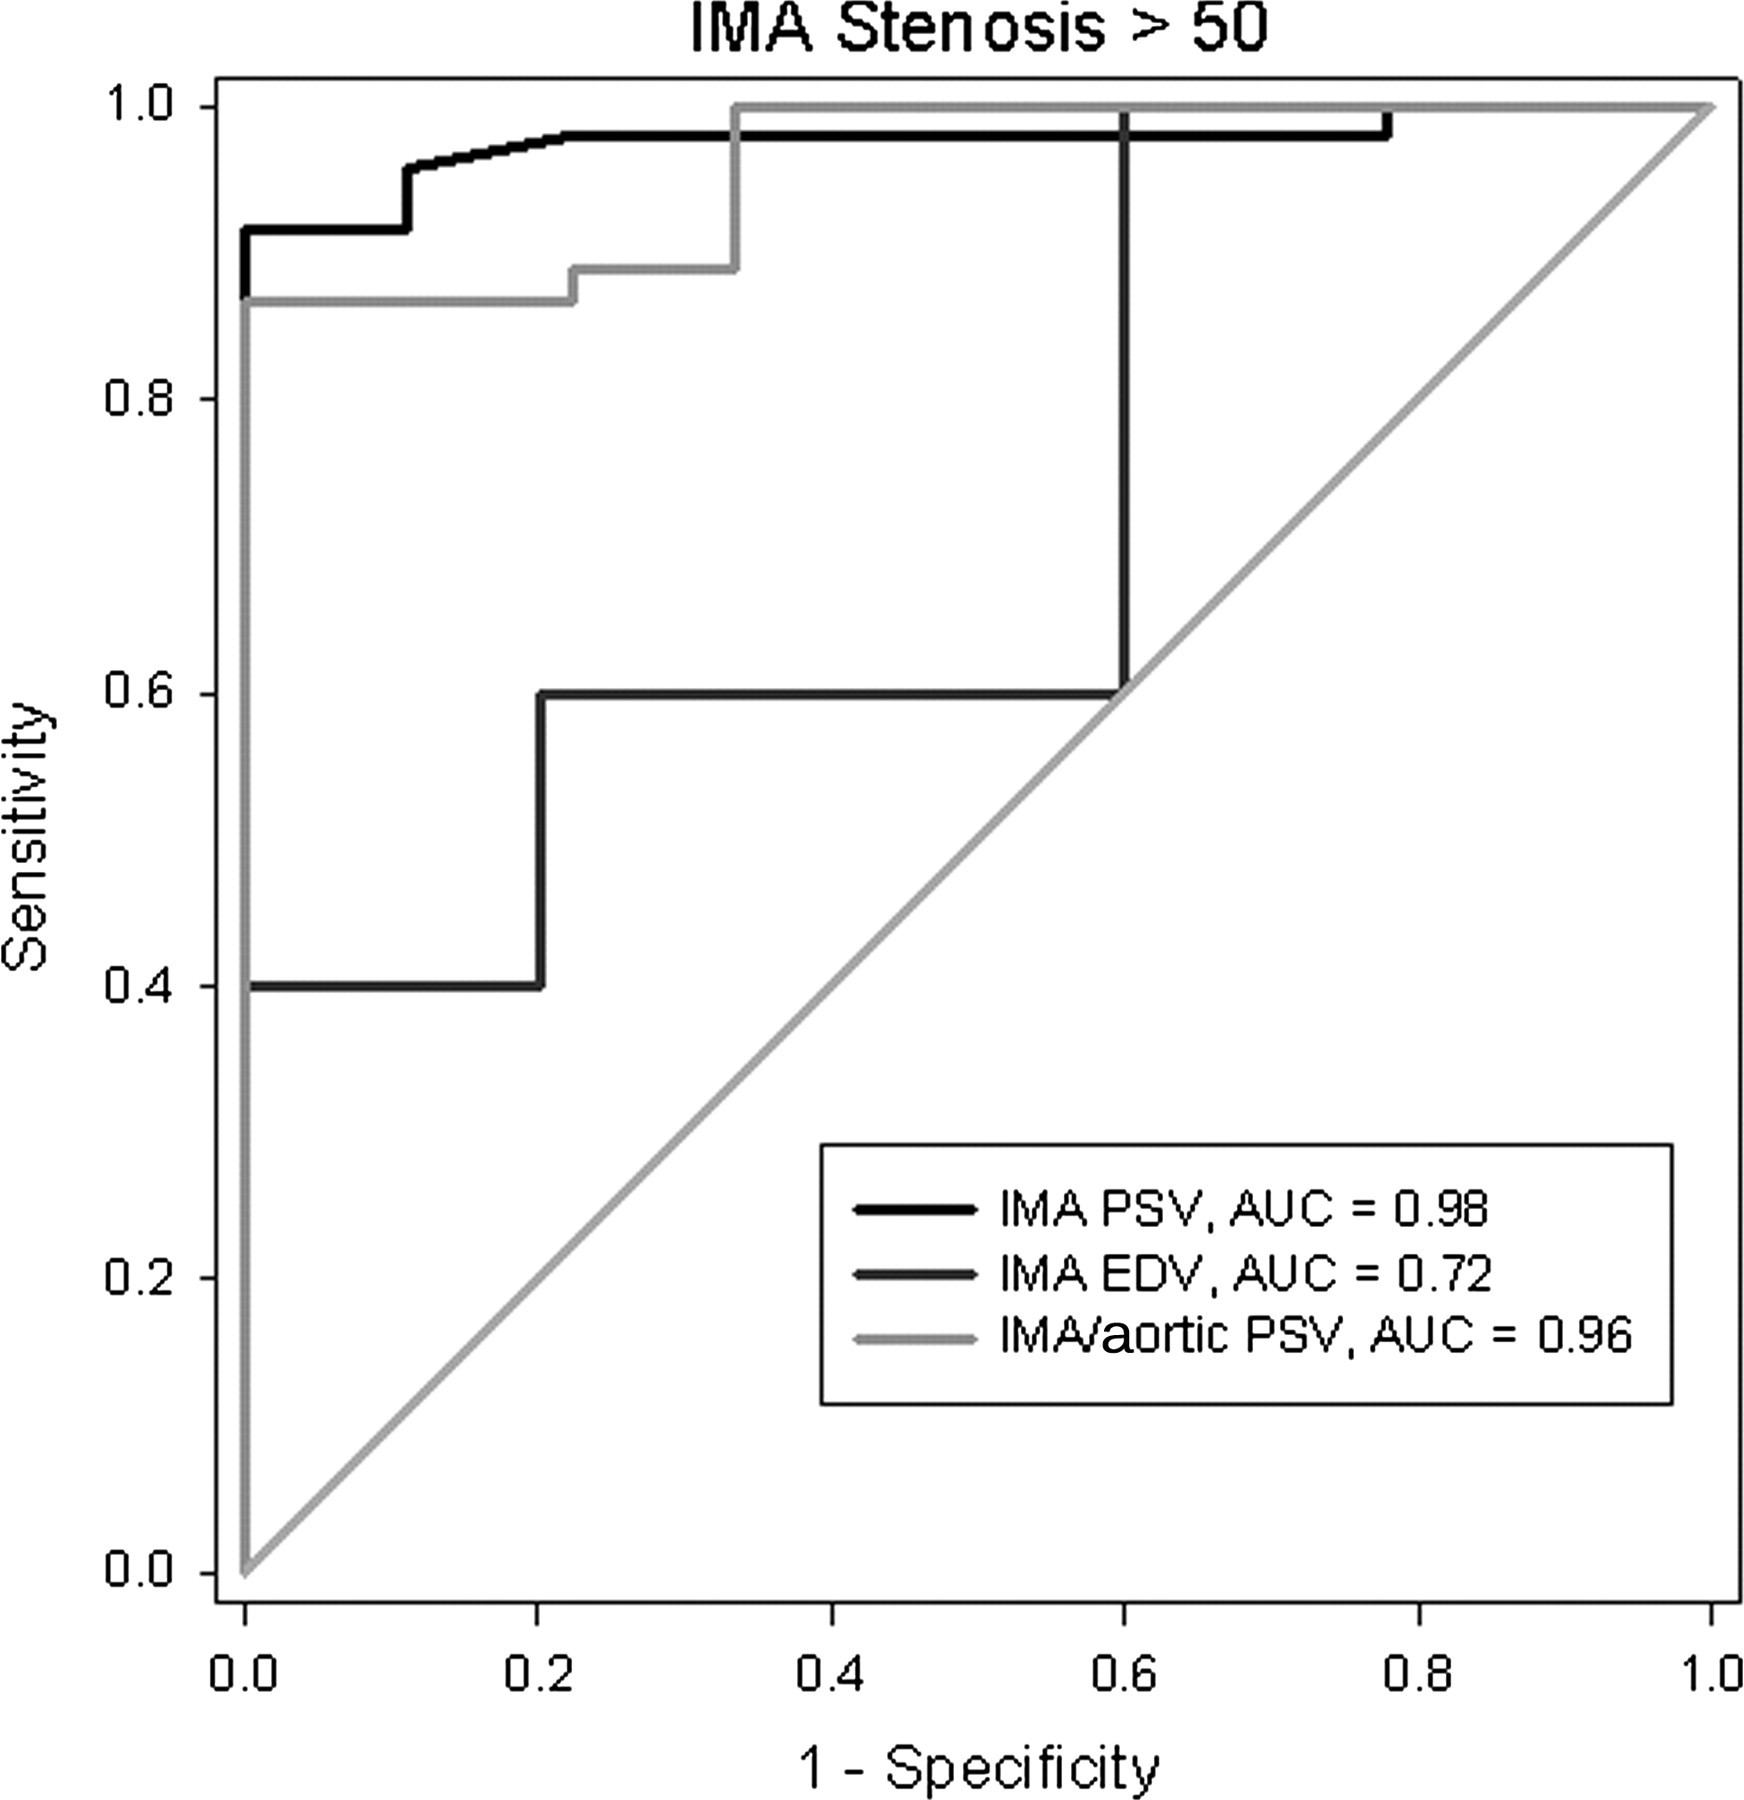
Discussion
Duplex ultrasonic mesenteric vessel imaging has remained a vital tool in deciding whether to proceed with invasive testing (e.g. angiography). There have been several published series that describe duplex velocity criteria in detecting significant stenosis of the SMA/CAs.
In 1991, Moneta et al. published one of the first criteria for diagnosing mesenteric stenosis based on duplex scanning. That study analyzed only 26 arteries with >70% stenosis of the SMA or celiac arteries. They concluded that a PSV of >200 cm/second in the celiac artery and >275 cm/second in the SMA predicted stenosis of ≥70%. An EDV of >55 cm/second in either artery produced similar sensitivities and specificities, although it was not as accurate as the PSV across the ostium of the artery. 1
In 1993, Moneta et al. 2 reported on a larger blinded prospective series involving 100 patients who underwent routine mesenteric duplex scanning and lateral abdominal aortography. Twenty-three of these patients were found to have ≥70% stenosis of the CA and 13 had ≥70% stenosis of the SMA. Using the same criteria, a sensitivity, a specificity and an OA of 92, 96 and 96%, respectively, were obtained for diagnosing 70% stenosis in the SMA and a sensitivity, a specificity and an OA of 87, 80 and 82%, respectively, for detecting ≥70% CA stenosis.
Bowersox et al. 3 found that the EDV was actually a better variable for detecting mesenteric stenosis. In their study of 24 patients, an EDV of >45 cm/second was the best value for detecting ≥50% stenosis of the SMA, with a sensitivity and specificity of 100% and 92%, respectively. 3 Zwolak et al., 4 from the same group, confirmed similar findings in a series of 46 visceral arteries, where an EDV of >45 cm/second yielded a sensitivity and specificity of 90 and 91%, respectively. Increasing the threshold to 55 cm/second for the celiac artery showed a similar sensitivity and specificity, with an OA of 95%.
None of these published studies evaluated the IMA. This is critical because the diagnosis of chronic mesenteric ischemia is based on the presence of significant stenosis or occlusion in two of the three mesenteric vessels. Therefore, evaluation of the IMA is essential in establishing the diagnosis.
Selective IMA evaluation was performed independently by Mirk et al. 8 and Denys et al., 7 and demonstrated that the IMA was visualized in 89% and 92% of cases, respectively. Although PSV of the normal IMA has been shown to range from 93 to 189 cm/second, specific velocities for detecting significant IMA stenosis have never been established. 5 Few authorities proposed certain PSV values, but without supporting data.
Erden et al. 5 showed that PSVs in the IMA can reach 190 cm/second when the IMA serves as part of a collateral pathway in the presence of severely stenotic or occluded SMA or CA. Recently, Pellerito et al. 9 reported that a PSV >200 cm/second is useful for detecting significant IMA stenosis.
The IMA was examined in this series. The mean PSV for a normal IMA was 105 cm/second. A PSV of ≥270 cm/second had a sensitivity, specificity and OA of 92, 92 and 92%, respectively, in detecting ≥70% stenosis. If EDV was used as a parameter for stenosis, ≥100 cm/second had the best OA in detecting ≥70% stenosis at 93%. Meanwhile, a PSV of ≥250 cm/second had a sensitivity of 90%, a specificity of 96% and an OA of 95% in detecting ≥50% IMA stenosis.
One limitation of our study is that it is retrospective; however, it is based solely on interpreting data from both sonographic and angiographic images, which were interpreted by different physicians. There is also some element of variability in imaging, particularly with duplex ultrasound. All efforts were made by each technician to maintain a Doppler angle of 60° or less, so as to allow for minimal variation in this regard.
Conclusions
Specific IMA PSVs, EDVs and IMA/aortic systolic ratios can be used in detecting significant IMA stenosis with reasonable accuracy.