




Abstract
Pulse wave velocity (PWV) is a known indicator of arterial stiffness and cardiovascular risk. We critically evaluated the evidence supporting the four main non-invasive devices available to assess it: Complior, SphygmoCor, Arteriograph and Vicorder. PubMed and Medline databases (1960–2011) were searched to identify studies reporting carotid–femoral PWV in humans using one or more of the four devices. Of the 183 articles retrieved, 43 met inclusion criteria. The Arteriograph device demonstrated least variance but had poor agreement with the other devices. Undisputable reference values for PWV need to be established and internationally agreed, and a standardized method for superficial distance measurement generated to reduce variability. Further studies comparing all four devices with invasive assessment are necessary.
Introduction
Pulse wave velocity (PWV) is defined as the speed at which a pulse wave moves through an arterial segment 1 and is a widely accepted indicator of arterial stiffness. 2 6 Arterial stiffness is an independent cardiovascular risk factor associated with type 2 diabetes mellitus, 7 end-stage renal disease, 8 hypertension,9,10 atherosclerosis 11 and age.12,13 In health, arteries are compliant, resulting in a low PWV (6.1–9.1 ms−1), allowing for reflected waves from the peripheries to return to the central aorta during diastole. 1 Consequently, arterial stiffness within major arteries has significant hemodynamic consequences, such as a decreased arterial buffering capacity, 14 reduced arterial compliance and distensibility.
The Framingham heart study 15 reported that stiffer arteries result in a premature wave reflection, elevating systolic blood pressure (SBP). 16 As a result, pulse pressure 17 and left ventricular afterload are increased, which can lead to left ventricular hypertrophy and increased myocardial oxygen demand; 18 diastolic blood pressure is lowered, decreasing coronary perfusion pressure. 6 The Moens—Korteweg equation (PWV = →[Eh/2ρR]) 1 rationalizes the association between the elastic properties of an artery and PWV. PWV is related to the square root of the elastic modulus (E), the thickness of the arterial wall (h), the density of the blood (ρ) and the internal radius of the artery (R). 10 This provides some rationale regarding the association between the elastic properties of an artery and PWV. As the mechanical stress on the arterial wall increases, the elastin content degenerates and stiffer collagen fibers become predominant in an attempt to retain the original shape of the arterial wall. 19 With increasing age, the elastic fibers become disorganized, displaying thinning, fraying and fragmentation leading to increased formation of collagenous material. 10 Arterial stiffness as estimated by PWV is gaining increasing attention as a useful predictor of cardiovascular risk. Consequently, many non-invasive measurement techniques are available. However, many differences between the methodologies of pulse wave devices exist. This has resulted in intra-observer variation in PWV values for the same patient. Presently, a lack of reference values limits the role of PWV measurement as a tool for clinical practice. The European Society of Hypertension guidelines suggest a fixed threshold value of 12 ms−1 representing suborgan damage. 20 However, this figure was derived from a normotensive population.
We aim to examine the current published data and evaluate four contemporary devices for PWV determination: SphygmoCor (Artcor, Sydney, Australia), 12 Complior (Colson, Les Lilas, France) 12 Arteriograph (Tensiomed, Budapest, Hungary) 3 and Vicorder (Skidmore Medical Ltd, Bristol, UK). 21 25
Methods
PubMed and Medline (1960–2011) were searched for ‘pulse wave velocity’ AND Complior OR SphygmoCor OR Arteriograph OR Vicorder. This retrieved 183 articles for assessment: 93 regarding Complior, 77 regarding SphygmoCor, 8 regarding Arteriograph and 5 regarding Vicorder. Recursive searching of the reference lists of all 183 articles was undertaken to identify further articles of interest. For inclusion in the study, articles required consideration of PWV with suitable detail of the methodology employed for PWV determination provided in the paper, performed in human subjects with a sample size of 30 or more. Ninety-two articles were rejected due to irrelevance following a review of the abstracts. The full text of the remaining 91 articles was obtained for review. Forty-three papers were subsequently excluded as their description of how each device was used to derive PWV lacked enough detail to allow comparative analysis between studies using the same device. This left 48 articles for review (Figure 1).
PRISMA flow diagram depicting the search strategy employed for this review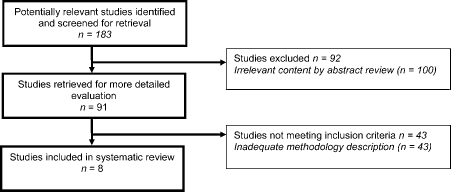
Results
Methods of pulse wave analysis
Complior system
The Complior system uses piezo-electronic technology and allows for two-point simultaneous pulse wave recordings by applying two mechanotransducers to the skin surface overlying the common carotid artery and the femoral artery.4,12,26 The pressure waveforms are then analyzed with a ‘foot-to-foot’ waveform method using a correlation algor ithm. PWV is calculated by distance/time calculation (Figure 2). The distance measurement is calculated by a direct superficial measurement with a tape measure, from the carotid artery to the femoral artery.
26
Conversion equation used to standardize measuring distance on the femoral cuff in the Vicorder device
27

SphygmoCor system
The SphygmoCor system uses an applanation tonometer with electrocardiogram (ECG) gating to attain the pulse waves from both proximal (carotid artery) and distal (femoral artery) sites.9,12,20,26,28 The PWV is calculated from the transit time between the two sites relative to the R-wave within the ECG complex using the ‘foot-to-foot method’ and the intersecting tangent algorithm. 26 The distance measurement can be obtained by a number of methods; however, most of the literature utilizes the following calculation: the distance from the level of the sternal notch to the femoral location of the applanation tonometer minus the distance from the level of the sternal notch to the carotid pulse. 26
Arteriograph system
The Arteriograph system is unique in its methodology as the pulse wave is measured at one location, with a brachial cuff connected to a piezo-electric sensor.17,29 Oscillations are detected and recorded as the cuff is inflated 35 mmHg above the SBP, thus allowing complete occlusion of the brachial artery.3,26 The working principle for the calculation of the time difference is by the analysis of two systolic peaks. The ‘early’ systolic peak is a result of blood being expelled from the left ventricle into the aorta and the ‘late’ systolic peak is due to the first wave being reflected at a distal site. Most studies assume this reflection point to be the iliac bifurcation.3,17,26,29 The distance measurement is from the sternal notch to the pubic symphysis.
Vicorder system
The Vicorder is an automatic device which uses an oscillometric technique, whereby proximal and distal inflatable cuffs are placed on areas of interest. In the case of carotid—femoral PWV (cfPWV), a 30 mm pad is placed over the neck at the level of the right carotid artery, with a larger oscillometric cuff (100 mm wide) being placed around the upper part of the right thigh.21,22 The distance is measured superficially with a tape measure, from the sternal notch to the middle of the femoral cuff. Pulse waveforms are simultaneously recorded as the cuffs inflate to 65 mmHg, and the transit time in milliseconds is computed. Using the distance measurement and the transit time, the PWV is calculated21,22,25 with an in-built cross-correlation algorithm.21,25
Distance measurement
PWV is highly dependent on carotid—femoral distance measurement. 26 The difference in PWV when using the Complior, SphygmoCor and Arteriograph systems can be as high as 30% depending on whether direct or subtracted distances are used.20,27,30 In the two validation studies published on the Vicorder,21,22 two different distance measurement strategies have been employed: Hickson et al. 21 defined the path length as the distance from the suprasternal notch to the top of the femoral cuff in contrast to van Leeuwen-Segarceanu et al., 22 who defined the length as (suprasternal notch to the top of the femoral cuff) –(lower edge of the carotid cuff to the suprasternal notch); as a result, the two studies found contrasting PWV values and came to different conclusions. If the distal measurement was taken from varied points on the femoral cuff, it could yield errors of 22%. 21 Conversion equations are a validated method of standardizing these measurements.20,27
Obese patients pose a challenge to accurate distance measurement. Slide calipers have been suggested as a more accurate method of distance determination in these patients.31,32 However, as the depth of arteries in obese patients may be very variable, a three-dimensional (3D) method for measurement would be ideal. Joly et al. 33 demonstrated that PWV measurements obtained in obese patients using the Complior system and magnetic resonance imaging (MRI) showed a significant correlation (Spearman's r = 0.45, P = 0.01). However, care must be taken when using correlation statistics to investigate levels of agreement, as if two measurements always differ by the same amount, they will be perfectly correlated.
Conversion equations
When the same technique for measuring the distance was applied to both the Vicorder and SphygmoCor, the PWV values for each showed a significant difference (1.6 ± 1.6 ms−1) compared with the manufacturers’ recommendation (-0.3 ± 5 ms−1).
21
The authors relate this to the additional segment of femoral artery included in the distance measurement of the Vicorder compared with that of the SphygmoCor, which introduces an inherent bias in transit time calculation. A correction equation was modelled to account for this difference, resulting in the transit times between the two devices being more closely correlated (Figure 3).
21
Correction equation for Vicorder to allow a direct comparison with Sphigmocor as described by Hickson et al.
21

Device-dependent algorithms
If different algorithms are applied to the same waveforms, the PWV results can differ as much as 15%.
20
Using the intersecting tangent algorithm as a standard for all devices produced more closely correlated results. Millasseau et al.
34
devised an equation (Figure 4) that could be applied to the Complior system to enable the conversion of the results to the intersecting tangent algorithm that is used for the SphygmoCor system. When this calculation was applied, the SphygmoCor and Complior PWV results were in agreement. In contrast to this, Hickson et al.
21
reported that when the intersecting tangent algorithm was applied to 42 Vicorder waveforms, the original Vicorder transit times did not differ, thus potentially disproving the theory that converting the algorithm would result in more closely correlated PWV readings.

Age and PWV
While it has been established that age is an independent predictor for increased PWV, 35 a confounding factor is the increasing length and tortuosity of the aorta with age, leading to the underestimation of PWV values. 1 MRI can accurately determine arterial length and therefore aortic PWV (aPWV) non-invasively. 36 Sugawara et al. 37 used MRI to obtain 3D tracings of the aorta in 256 patients and concluded that while the ascending aorta was significantly associated with an increase in length with increasing age (P < 0.0001, r = 0.72), the descending aorta and iliac arteries were not affected. Therefore, this suggested that the lengthening of the ascending aorta has no impact on PWV, as that arterial segment is not included in the distance measurement of the artery or the transit time. Further investigations regarding the impact of age on the length and tortuosity of the aorta would be useful to determine whether the findings of Sugawara et al. are valid. Two conditions that would have an impact on PWV, however, are Loeys—Dietz syndrome, type I and II, and arterial tortuosity syndrome. Sugawara et al. 37 found that when using the direct carotid to femoral distance, the arterial length was overestimated by 25% when compared with the 3D MRI model. The subtracted distance (sternal notch to femoral—carotid to sternal notch)20,27,30 was much closer to the actual length of the artery, with less than 5% difference from the MRI model measured length. We feel, however, that the use of MRI for the calculation of PWV is impractical due to availability and cost.
Validation
SphygmoCor
The SphygmoCor was initially validated in 1999 by Chen et al. 38 This study was limited to only 20 patients. As applanation of the artery to be examined using the applanation tonometer was inadequate in six of these patients, resulting in a sudden loss of correlation between waveforms, only 14 patients were included in the consequent data analysis.
Complior
The Complior was validated in 1995 by Asmar et al. 39 The difference in mean values between the Complior and the manual calculation was 0.20 ± 0.45 ms−1 (range − 0.65 to + 1.26 ms−1), with the Complior obtaining PWV values that were slightly lower that those calculated by the manual device (10.85 ± 2.44 and 11.05 ± 2.58 ms−1, respectively). A highly significant correlation coefficient was determined between the Complior and the manual device with high inter-observer and intra-observer repeatability. As 418 subjects participated in this study, it was a very comprehen sive assessment, which emphasized the importance of a trained investigator when obtaining PWV values.
Arteriograph
Validation of the working principle of the Arteriograph against an invasive counterpart was recently published by Horváth et al. 40 This study measured PWV invasively during cardiac catheterization and compared the results with those produced by the Arteriograph. The mean PWV values for the Arteriograph and the invasive measurements were 9.46 ± 1.8 and 9.41 ± 1.8 ms−1, respectively (r = 0.91, P < 0.001). This study was limited due to its small size; however, the authors justified this on the basis that they used an invasive counterpart with a very strong evidence basis.
Vicorder
Validation for the Vicorder was provided by Hickson et al. 21 and was the first study to examine the working principles of the Vicorder with the SphygmoCor device as the reference standard. While the transit times for the two methods differered significantly, aPWV values for the Vicorder and the SphygmoCor were in close agreement (8.3 ± 2.2 and 8.6 ± 2.9 ms−1, respectively). However, as the corrections that were proposed were only investigated in a small sample size (20 subjects for the femoral correction equation), further investigations with a larger study sample are required along with validation of the Vicorder device against the gold standard of invasive measurements.
Published comparison data
A Complior study, including 107 patients,9,40,41 calculated aPWV and cfPWV simultaneously. This is an advantage over the SphygmoCor study 9 which calculated aPWV and cfPWV on consecutive days; however, the results were significantly different between aPWV and cfPWV, with mean values of 8.78 ± 2.25 and 10.65 ± 2.29 ms−1, respectively. The authors concluded that the two methods of PWV estimation (cfPWV and aPWV) should not be used interchangeably.40,41 The SphygmoCor study 9 compared invasive PWV measurements with five different distances to observe which was more closely correlated with the invasive value and therefore most reliable. The travel time between the invasive and non-invasive methods was significantly correlated (rs = 0.8, P< 0.0001) and the distance measurement in best agreement with the invasive counterpart was suprasternal notch to femoral—carotid to suprasternal notch. This is in agreement with the SphygmoCor user's manual. 42
Summary of the six device comparison studies

aPWV, aortic pulse wave velocity; PWV, pulse wave velocity; PWVcf, carotid-femoral pulse wave velocity; LoA, limits of agreement
Rajzer et al. 26 examined PWV in 64 hypertensive patients and found that aPWV was significantly higher for the Complior (10.1 ± 1.7 ms−1) than that of the Arteriograph and the SphygmoCor, which were in close agreement (8.6 ± 1.3 and 8.1 ± 1.1 ms−1, respectively).
The correlation between the three methods in this study was significant (Arteriograph versus SphygmoCor: r = 0.29, P < 0.043; Arteriograph versus Complior: r = 0.36, P < 0.0048; and SphygmoCor versus Complior: r = 0.57, P < 0.0001), but far less than in Baulmann et al. 44 Nemcsik et al. 45 conducted a prospective study on 96 hemodialysis patients and compared the PWV results from the Arteriograph with the Pulsepen tonometer as a reference. No significant correlation was established between the two devices (r = 0.173, P < 0.097), and hence the Arteriograph was said to have limited validity in the clinical setting in relation to those patients on hemodialysis. Horváth et al. 40 challenged these findings by providing an invasive validation of the Arteriograph. A highly significant correlation (r = 0.912, P < 0.001) between the invasive PWV value and the value produced by the Arteriograph was established and the limits of agreement were deemed acceptable for clinical practice.
Discussion
As noted by Horváth et al., 40 a key reason for the Arteriograph values being so closely correlated with the invasive measurements is due to the Arteriograph stopping blood flow entirely; therefore, removing the influence of the Bernoulli effect. In a partially occluded artery, during inflation of the cuffs when using the Vicorder, the vessel is narrowed, resulting in a transient but false-positive increase in PWV. 40 In contrast, the surface area of the vessel compressed during applanation tonometry with the SphygmoCor is considerably smaller; hence the magnitude of this effect on PWV would be much reduced. This could easily be tested and refuted in the lab, given that hold-down pressure can be determined with the applanation tonometry method.
Baulmann et al. 44 attributed their results to the technical difficulty associated with each of the methods, with the Arteriograph being far simpler to implement. This corresponds well with Jatoi et al. 43 as the position of the brachial cuff for the Arteriograph is less critical when comparing it with the accuracy required for the placement of sensors over specific arteries, as is required for the Complior and SphygmoCor. Despite the fact that both Jatoi et al. 43 and Baulmann et al. 44 showed significant correlations between PWV values produced by the Complior and the Arteriograph, this is misleading in the sense that a significant correlation does not necessarily imply that the two are in agreement.43,48 Bland—Altman analysis is a more reliable method of assessment, to determine agreeability. This point is fundamental when considering the reasons why Jatoi et al. 43 concluded that the PWV measurements between devices had poor agreement and therefore that the ‘Arteriograph is not a suitable method for the assessment of PWV in the clinical setting.’ The differences in the results between Rajzer et al. 26 and Baulmann et al. 44 could be due to one sample being a normotensive population and the other being a hypertensive population or due to the operator bias that is associated with the technical difficulty of the methods, which can result in PWV differences of ± 3.6 ms−1 when using the same technique. 43
The comparative studies by Parati et al. 29 and Baulmann et al. 44 both report that the correlation results when comparing the Arteriograph against the Complior or the SphygmoCor were the least significant in comparison to the Complior versus the SphygmoCor. This provides some justification as to why these are the two methods currently classed as the gold standard. However, as Horváth and colleagues note, an older method should not be classed as the gold standard if it has greater variance than the new method. 48 Nevertheless, the agreement was far from optimal and the concept of the methodology and validity of the working principle behind the Arteriograph was not assessed. 48 The authors propose that the Arteriograph could be the new gold standard for PWV calculation, and as this technique is simple to use, it would be favorable in the clinical setting. However, before this new device could be seen to be a peer competitor of the SphygmoCor and Complior, further investigations would have to be conducted with a larger sample size, as the majority of current literature supports the use of the SphygmoCor and/or the Complior. It is therefore questionable as to whether one invasive validation is enough to prompt routine use in the clinical setting.
Conclusion
Arterial stiffness has major hemodynamic consequences; therefore, the importance of a clinical tool to assess PWV reliably is becoming increasingly pertinent. The various limitations associated with each device, along with the idea that ‘normality’ is a difficult concept to define when taking into consideration that blood pressure and age-related changes have a major impact on PWV, have resulted in the current lack of available reference ranges. Before meaningful patient risk stratification can be achieved on the basis of arterial stiffness, undisputable reference values need to be determined. Further investigations are required in at-risk populations to facilitate the translation of PWV into routine clinical practice. A comparative study between the four non-invasive devices against an invasive counterpart in a large study sample would be invaluable.
Declarations
Footnotes
Acknowledgments
The authors would like to thank Anne Johnson and Janet Woods for all their help and support during this project.