




Abstract
The development of efficient, reproducible protocols for directed in vitro differentiation of human embryonic stem (hES) cells into insulin-producing β cells will benefit greatly from increased knowledge regarding the spatiotemporal expression profile of key instructive factors involved in human endocrine cell generation. Human fetal pancreases 7 to 21 weeks of gestational age, were collected following consent immediately after pregnancy termination and processed for immunostaining, in situ hybridization, and real-time RT-PCR expression analyses. Islet-like structures appear from approximately week 12 and, unlike the mixed architecture observed in adult islets, fetal islets are initially formed predominantly by aggregated insulin- or glucagon-expressing cells. The period studied (7–22 weeks) coincides with a decrease in the proliferation and an increase in the differentiation of the progenitor cells, the initiation of NGN3 expression, and the appearance of differentiated endocrine cells. The present study provides a detailed characterization of islet formation and expression profiles of key intrinsic and extrinsic factors during human pancreas development. This information is beneficial for the development of efficient protocols that will allow guided in vitro differentiation of hES cells into insulin-producing cells.
T
During fetal development, the human pancreas forms from a dorsal and a ventral protrusion of the primitive gut epithelium. On day 26, the dorsal pancreatic bud grows into the dorsal mesentery and over the next few days, the ventral bud sprouts into the ventral mesentery. Late in the sixth week, the pancreatic buds fuse to form the definitive pancreas, and their ductal systems become interconnected. On a molecular and cellular level, the formation of the mouse endocrine pancreas is divided into several steps, including: pancreatic fate specification, characterized by the coexpression of Ipf1 and Ptf1a; proliferation of the pancreatic progenitor cells, which is controlled in part by NOTCH, fibroblast growth factor (FGF), and epidermal growth factor (EGF) signaling; endocrine cell fate determination as a result of transient expression of Ngn3 in the proendocrine cells; and differentiation and maturation of the endocrine progenitor cells into functional endocrine cells, including glucose-responsive β cells, as a result of the expression of distinct transcription factors such as Arx, Pax4, Ipf1, Nkx2–2, Nkx6–1, Mafa, Mafb, Neurod1, Pax6, and Isl1 (reviewed in Edlund 1998,1999,2002; Bonal and Herrera 2008; Oliver-Krasinski and Stoffers 2008).
Although previous studies have described the expression of some endocrine hormones and transcription factors during human fetal pancreas development (Polak et al. 2000; Piper et al. 2004; Lyttle et al. 2008; Sarkar et al. 2008), a detailed and longitudinal expression profile of the main endocrine markers, combined with a thorough morphological study of islet formation, may expand our understanding of human endocrine pancreas formation. In the present study, we present data on the morphological pattern by which islet-like structures form during human pancreatic development. We also analyze, by quantitative real-time (qRT)-PCR, in situ hybridization, and immunohistochemistry, the gene expression profile of selected candidate intrinsic and extrinsic factors in human fetal pancreas from 7 to 22 weeks of gestational age. We herein describe the temporal expression profiles of these factors. The results presented here may help to determine the sequential activity of the key developmental factors behind the morphological changes occurring during islet clustering.
Materials and Methods
Human Tissue
Human fetal pancreases were collected from fetal tissue fragments immediately after elective termination of pregnancy performed by aspiration between 7 to 21 weeks of development, in compliance with US legislation and the guidelines of our institution. Gestational age was determined on the basis of time since the last menstrual period and the measured crown-rump length and biparietal diameter by ultrasonography. The isolated tissues were processed directly after extraction, with less than 8 hr of cold ischemia time. Tissues were transferred in ice-cold PBS, pH 7.4, for immunohistochemical analysis, or in RNAlater solution (Ambion; Austin, TX) for RT-PCR analysis. Human pancreas tissue from two adults, ages 53 and 54 years (obtained from the human islet cell processing facility at the Diabetes Research Institute, University of Miami), were also used. The numbers of cases for each experiment are listed in Table 1.
Immunostaining
Tissues were fixed in 4% paraformaldehyde (w/v) at 4C for 15 hr, followed by PBS washing for 1 min, and then stabilized in 30% sucrose (w/v) in PBS at 4C overnight. The tissues were mounted in Tissue-Tek OCT compound (Sakura Finetek; Torrance, CA) and stored at −80C. Five-μm sections were cut, air-dried on precleaned superfrost microslides (VWR Scientific; West Chester, PA), and used immediately or stored at −80C. The frozen slides were thawed at room temperature for 30 min and washed in 0.1% (v/v) Triton X-100 (USB; Cleveland, OH)-TBS (Santa Cruz Biotechnology, Inc.; Santa Cruz, CA) (TBS-T) three times for 5 min each. Sections were blocked in 10% (v/v) fetal bovine serum (FBS) in TBS-T at room temperature for 20 min. Primary and secondary antibodies were diluted in 10% FBS in TBS-T. Primary antibodies were incubated at 4C overnight or at room temperature for 1 hr (anti-hormone antibodies) and secondary antibodies at 4C or room temperature for 1 hr. The following primary antibodies and dilutions were used: mouse anti-insulin (1:1000; Sigma, St. Louis, MO); guinea pig anti-glucagon (1:1000; Linco Research Inc., St. Charles, MO); rabbit anti-IPF1 (1:8000; generated against a keyhole limpet hemocyanin (KLH)-conjugated peptide of human IPF1 by Agrisera Ab, Vännäs, Sweden); rabbit anti-Isl1 (1:250; generated against a KLH-conjugated peptide of human Isl1 by Agrisera Ab); mouse anti-human E-cadherin (10 μg/ml; Zymed, South San Francisco, CA); mouse anti-human nestin (1:200; Chemicon, Billerica, MA); rabbit anti-somatostatin (1:500; Dako, Carpinteria, CA); rabbit anti-pancreatic polypeptide (1:1000; Dako); and rabbit anti-Ki67 (1:50; Zymed). Secondary antibodies used were: Alexa Fluor 488-conjugated goat anti-rabbit (1:400; Molecular Probes, Carlsbad, CA); Alexa Fluor 568-conjugated goat anti-guinea pig (1:400; Molecular Probes); and Alexa Fluor 647-conjugated goat anti-mouse (1:400; Molecular Probes). 4,6-Diamidino-2-phenylindole, dihydrochloride (12.5 μg/ml; Invitrogen, Carlsbad, CA) was used as nuclear counterstaining. Image acquisition was performed using a Zeiss LSM510 confocal microscope (Carl Zeiss; Jena, Germany). Negative control assays were performed without primary antibodies.
Summary of cases

Immunohistochemical Analyses
To quantify images, the optical thicknesses of the two channels were equalized prior to image acquisition. Raw confocal images (1024 × 1024 pixels, 12-bit data depth) were sequentially obtained with a Zeiss LSM510 with a 20X, 0.5 NA, plan-neofluar objective (Carl-Zeiss). Colocalization analysis was performed on 17 randomly selected raw confocal images of each case using a colocalization routine mode of the Zeiss LSM510 software (version 3.2). The colocalization coefficient, which is the ratio between the number of colocalizing pixels and the total number of pixels above the threshold, was used as a quantitative parameter, where 1 indicates the colocalization of all pixels, and 0 indicates no colocalization. The intensity of the pixels does not affect the calculation. First, the intensity background levels of images were automatically obtained by measuring the mean intensity of each local background stain outside the cells, using the image regions-of-interest mode. Second, the whole-image background thresholds were determined by subtracting the average local background intensity plus 2X standard deviation of each channel, and finally the software calculated a colocalization coefficient and the area/colocalized area for each channel. Quantification of images was repeated three times independently. The average values of all of the colocalization coefficients and the area of different samples were plotted.
To count α and β cells, four tissue sections per case (n=3) were randomly selected from pancreases at 9- and 10 weeks’ gestational age. The numbers of insulin-expressing, glucagon-expressing, and coexpressing cells were manually counted through a fluorescent microscope. Average values of three independent experiments were plotted.
To measure the diameter of islet-like clusters, those bigger than 70 μm in diameter were selected for quantification in the 243 confocal images used. The size was manually measured by averaging the maximum and minimum diameters of each cluster containing more than ten cells expressing insulin, glucagon, or both, using the ruler toolbar in the Zeiss LSM510 software. Average values of three independent experiments were plotted. To analyze the percentage of separated clusters containing only glucagon- or insulin-expressing cells, we quantified only those aggregates bigger than 70 μm between 16 and 21 weeks, two or three cases per age, as described above.
To define the spatial distribution of islet-like clusters, all the tissue sections of pancreas tissues (n=39) used for the quantification of colocalization were analyzed using a Zeiss Axiovert 200 fluorescent microscope, and the 243 confocal images obtained were reviewed.
qRT-PCR
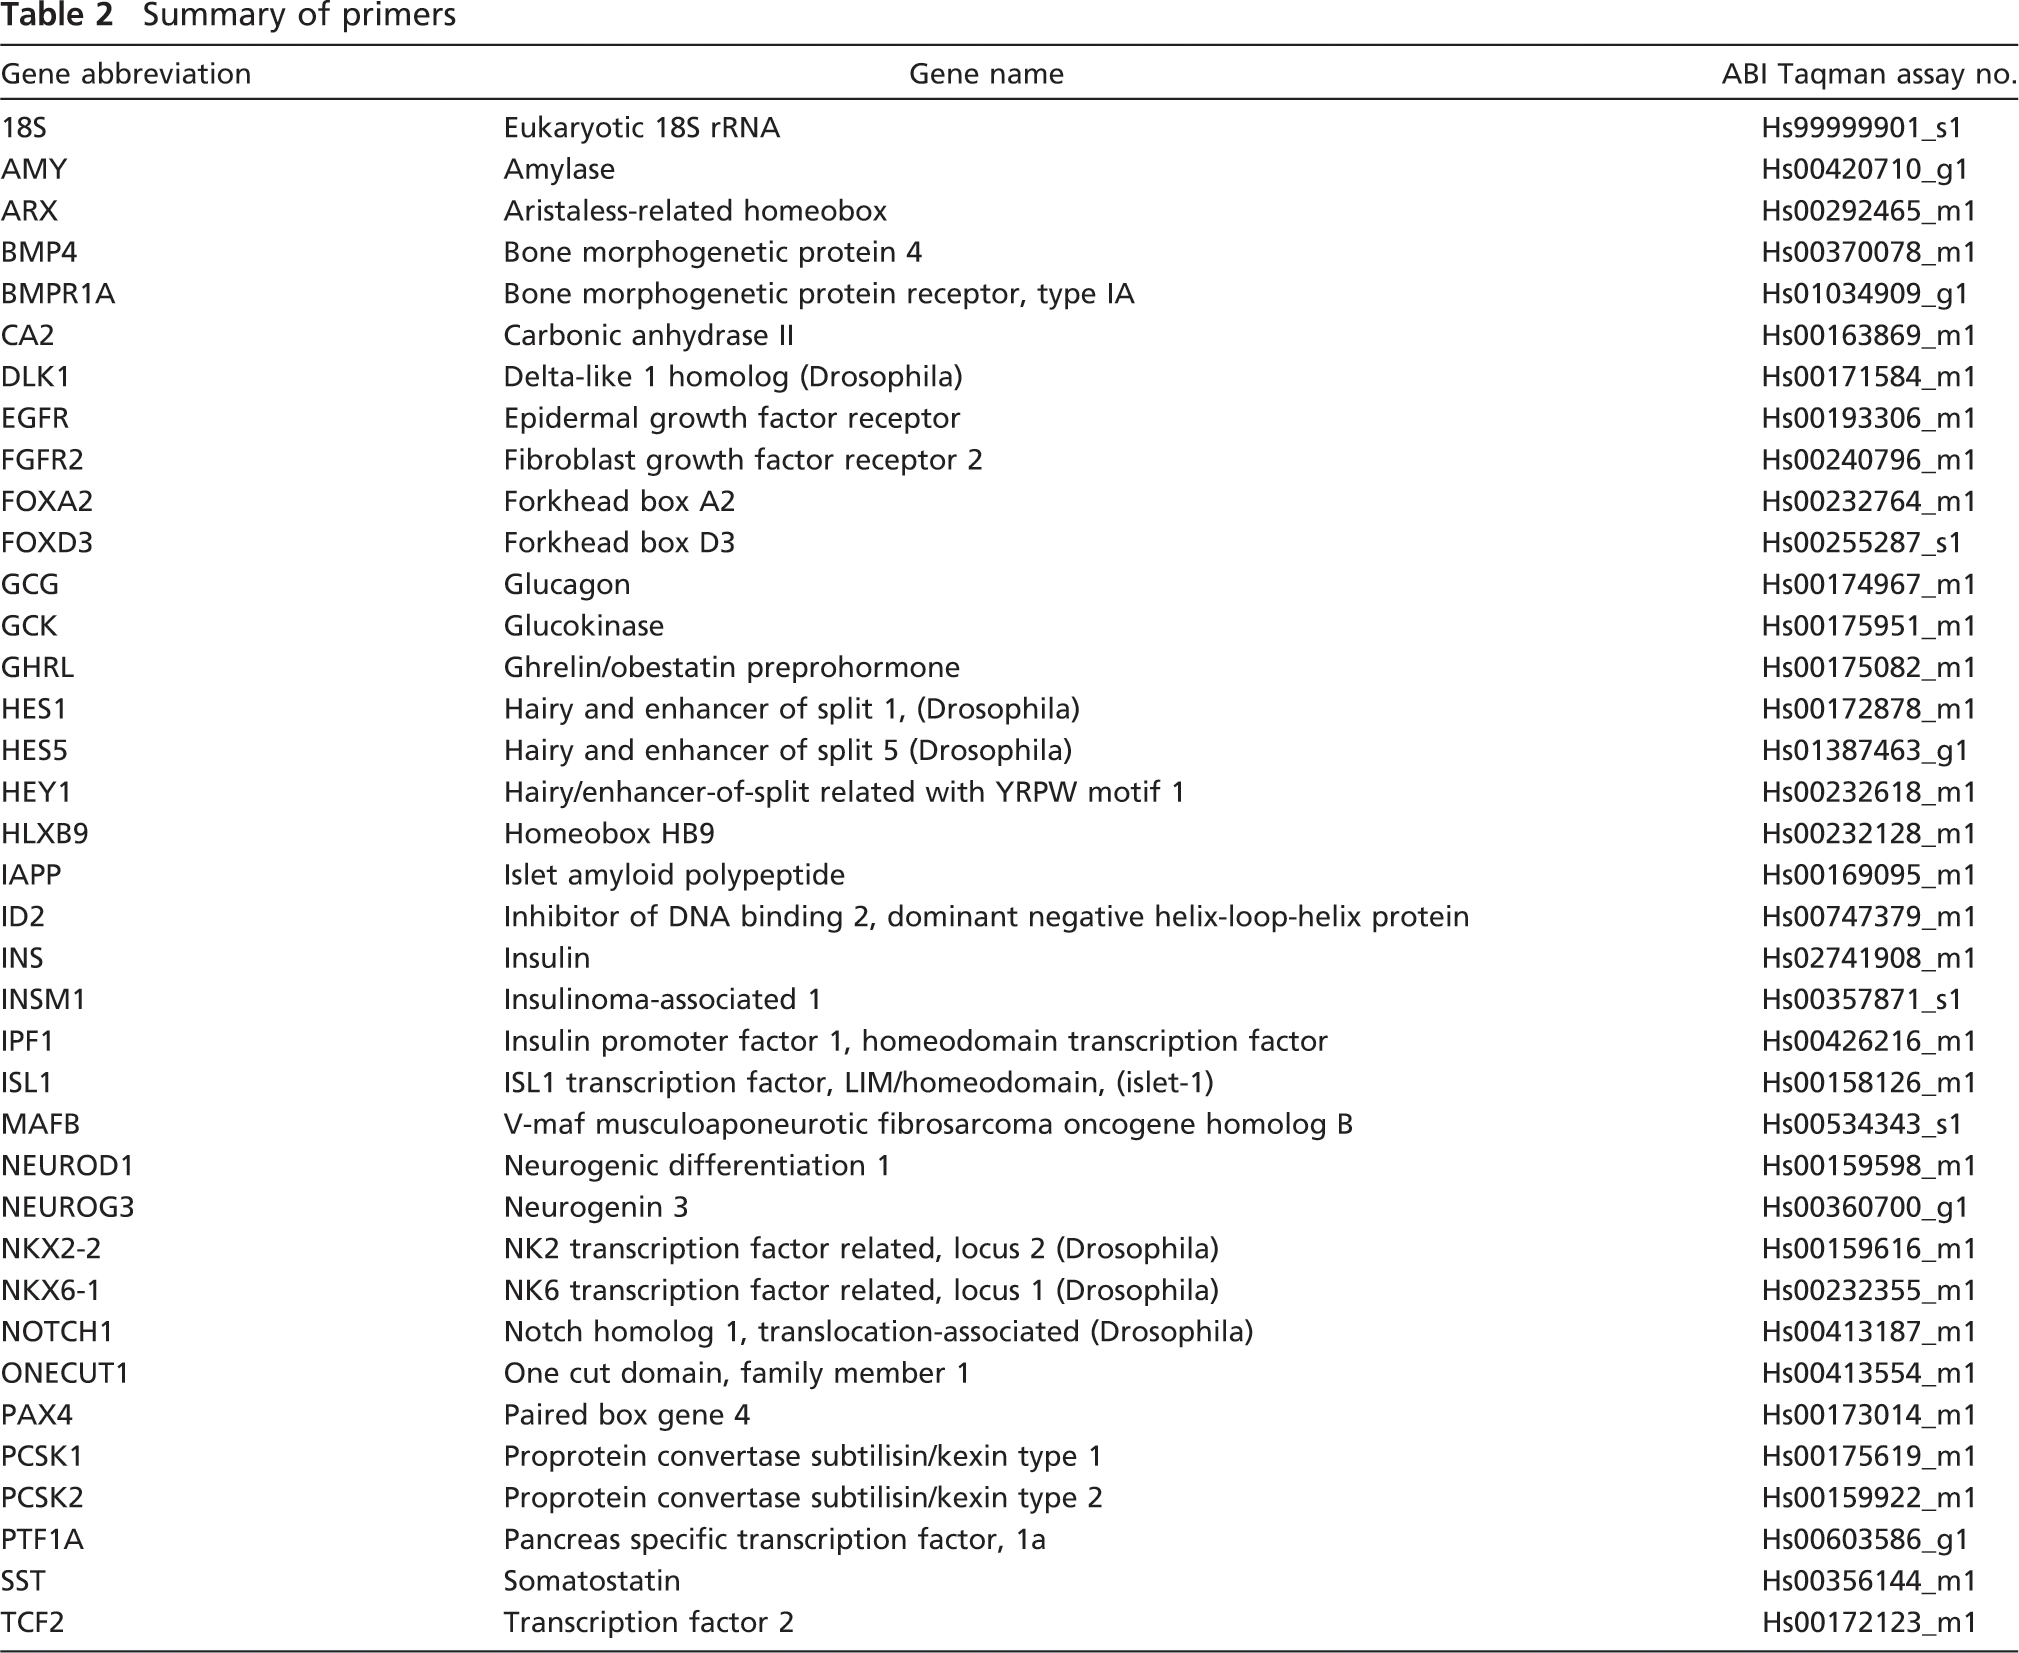
Total RNA was isolated from the sample tissues using the RNeasy Mini kit (Qiagen; Valencia, CA) according to the manufacturer's directions. Of total RNA, 0.5 μg was used for reverse transcription using the first-strand cDNA synthesis kit (Roche; Indianapolis, IN). PCR reactions were run using Taqman gene expression assays according to the manufacturer's directions (Applied Biosystems; Foster City, CA) in a 7900HT fast real-time PCR system (Applied Biosystems). We used low-density array cards (Applied Biosystems), designed in our laboratory, containing 48 genes. The primers used in this article are listed in Table 2; a complete list of the primers contained in the cards is available upon request. Relative quantification (RQ) of the gene expression was calculated based on the equation RQ=2−ΔCt, where ΔCt is the difference between the Ct value (number of cycles at which amplification for a gene reaches a threshold) of the target gene and the Ct value of the ubiquitous housekeeping gene 18S. The data represent the mean. ± SEM of one to three specimens (see Table 1).
In Situ Hybridization
In situ hybridization using a digoxigenin (DIG)-labeled NGN3 probe was performed essentially as described (Obernosterer et al. 2007). A total of 30 ng of DIG-labeled NGN3 probe was diluted in 150 μl of hybridization buffer, applied to the slides, and allowed to hybridize at 70C overnight. Slides were then washed for 1 hr in 0.2 × 150 mM sodium chloride and 15 mM sodium citrate buffer solution (Ambion-Applied Biosystems) and incubated with alkaline phosphatase-conjugated sheep anti-DIG antibody (1:2500; Roche) overnight at 4C. Alkaline phosphatase reaction was carried out in polyvinyl alcohol with 200 μl of MgCl2 1 M and 140 μl of nitroblue tetrazolium chloride/5-bromo-4-chloro-3-indolyl phosphate, toluidine salt stock (Roche) for 1–3 days. Hybridization with sense DIG-labeled NGN3 probe was used as control.
Statistical Analysis
All data are presented as mean ± SEM.
Results
Ontogeny of Pancreatic Endocrine Cells in the Developing Human Pancreas
The appearance of endocrine cells in the developing human pancreas was determined by immunohistochemical analyses. At week 8, a few insulin-expressing cells, but not glucagon-expressing cells, were detectable (data not shown). At week 9, the first glucagon-positive cells emerged, although insulin-expressing cells were more abundant at this stage, and, in addition, occasional insulin/glucagon double-positive cells were observed (Figure 1A). A few somatostatin-expressing cells, but not pancreatic polypeptide (PP)-expressing cells, were observed at week 10 (data not shown), and by week 17, somatostatin-expressing cells were interspersed with glucagon-expressing cells at the periphery of the forming islet cell clusters. By week 17, a few PP cells were also observed at the periphery of the islet cell clusters (Figure 1B).
Summary of primers
Between weeks 8 and 11, the distribution of endocrine cells was scattered, but by week 12, insulin and/or glucagon cells started to form small clusters; by week 14, these clusters were more prominent, with a core of insulin-positive cells surrounded by glucagon-positive cells (Figure 1A). By weeks 16–17, glucagon cells no longer formed a distinct ring of cells surrounding the insulin cells; instead, insulin and glucagon cells appeared to predominantly self-aggregate, and by week 18, distinct, albeit juxtaposed, insulin and glucagon cell clusters had formed. The analysis of these homotypic clusters revealed that they constitute 10% of the total clusters bigger than 70 μm at week 17, 62.5% at week 18, 33.3% at week 19, 33.3% at week 20, and 13.3% at week 21. This type of cluster was not detected before week 17.
By week 21, a few glucagon cells were detected within the clusters of insulin cells and vice versa. The clusters of insulin-positive cells contained fewer replicating cells, as revealed by Ki67 immunostaining, than the group of glucagon cells (Figure 1A). During development, the size of the islet-like structures increased to reach the maximum average diameter at 14 weeks, although occasional huge clusters of cells, some even bigger than adult islets, were observed (Figures 1A and 1C).
We next quantified the number of cells expressing glucagon and/or insulin-positive cells at 9 and 10 weeks, and the total area of glucagon- and insulin-positive cells in tissue sections from 8 to 21 weeks. At 9 and 10 weeks, most of the glucagon-positive cells coexpressed insulin (Figure 2B), although distinct insulin-only cells were clearly detectable at these stages (Figures 1A and 2A). Cells coexpressing insulin and glucagon were observed during the whole period studied (9 to 21 weeks), but they represented merely a small fraction of the total insulin- and glucagon-expressing cells (Figures 2C and 2D). When determining the colocalization index, i.e., the ratio between the double-positive cells and the total cells positive for glucagon or insulin, where 0 indicates only single-hormone expression and 1 complete co-expression, a fair proportion of the glucagon cells were shown to coexpress insulin until week 14 (Figure 2C).

Endocrine cells clustering during human pancreas development. (
After week 15, the percentage of double-positive cells is similar among the glucagon- or insulin-expressing cells (Figure 2C). Interestingly, the cells coexpressing insulin and glucagon after week 14 are mainly found in small aggregates and not in the big clusters (Figure 2A). The total area of insulin-positive cells increased rapidly from 8 to 14 weeks (Figure 2D). The total area of glucagon-positive cells also increased during this period, and from ∼16 weeks, the areas of glucagon and insulin were similar (Figure 2D). These data show that although insulin-positive cells emerge slightly earlier than glucagon-positive cells during human pancreatic development, a near 1:1 ratio resembling that observed in adult human islets (Cabrera et al. 2006) is already observed at mid-gestation.
Next, we analyzed the spatial appearance of the islet-forming structures in the developing pancreas by screening for insulin and glucagon aggregates in the central and peripheral regions of the pancreas (Figure 3A). The clustering of insulin and glucagon cells appeared to begin in the central region of the pancreas and then to spread to the periphery. At week 20, the insulin- and glucagon-positive cells thus appeared less aggregated in the periphery than in the center, even compared with earlier stages (Figure 3A). We must stress that at any given stage, the morphology of the endocrine cell clusters is a compilation of all the previous stages, coexisting single cells and small and big aggregates.
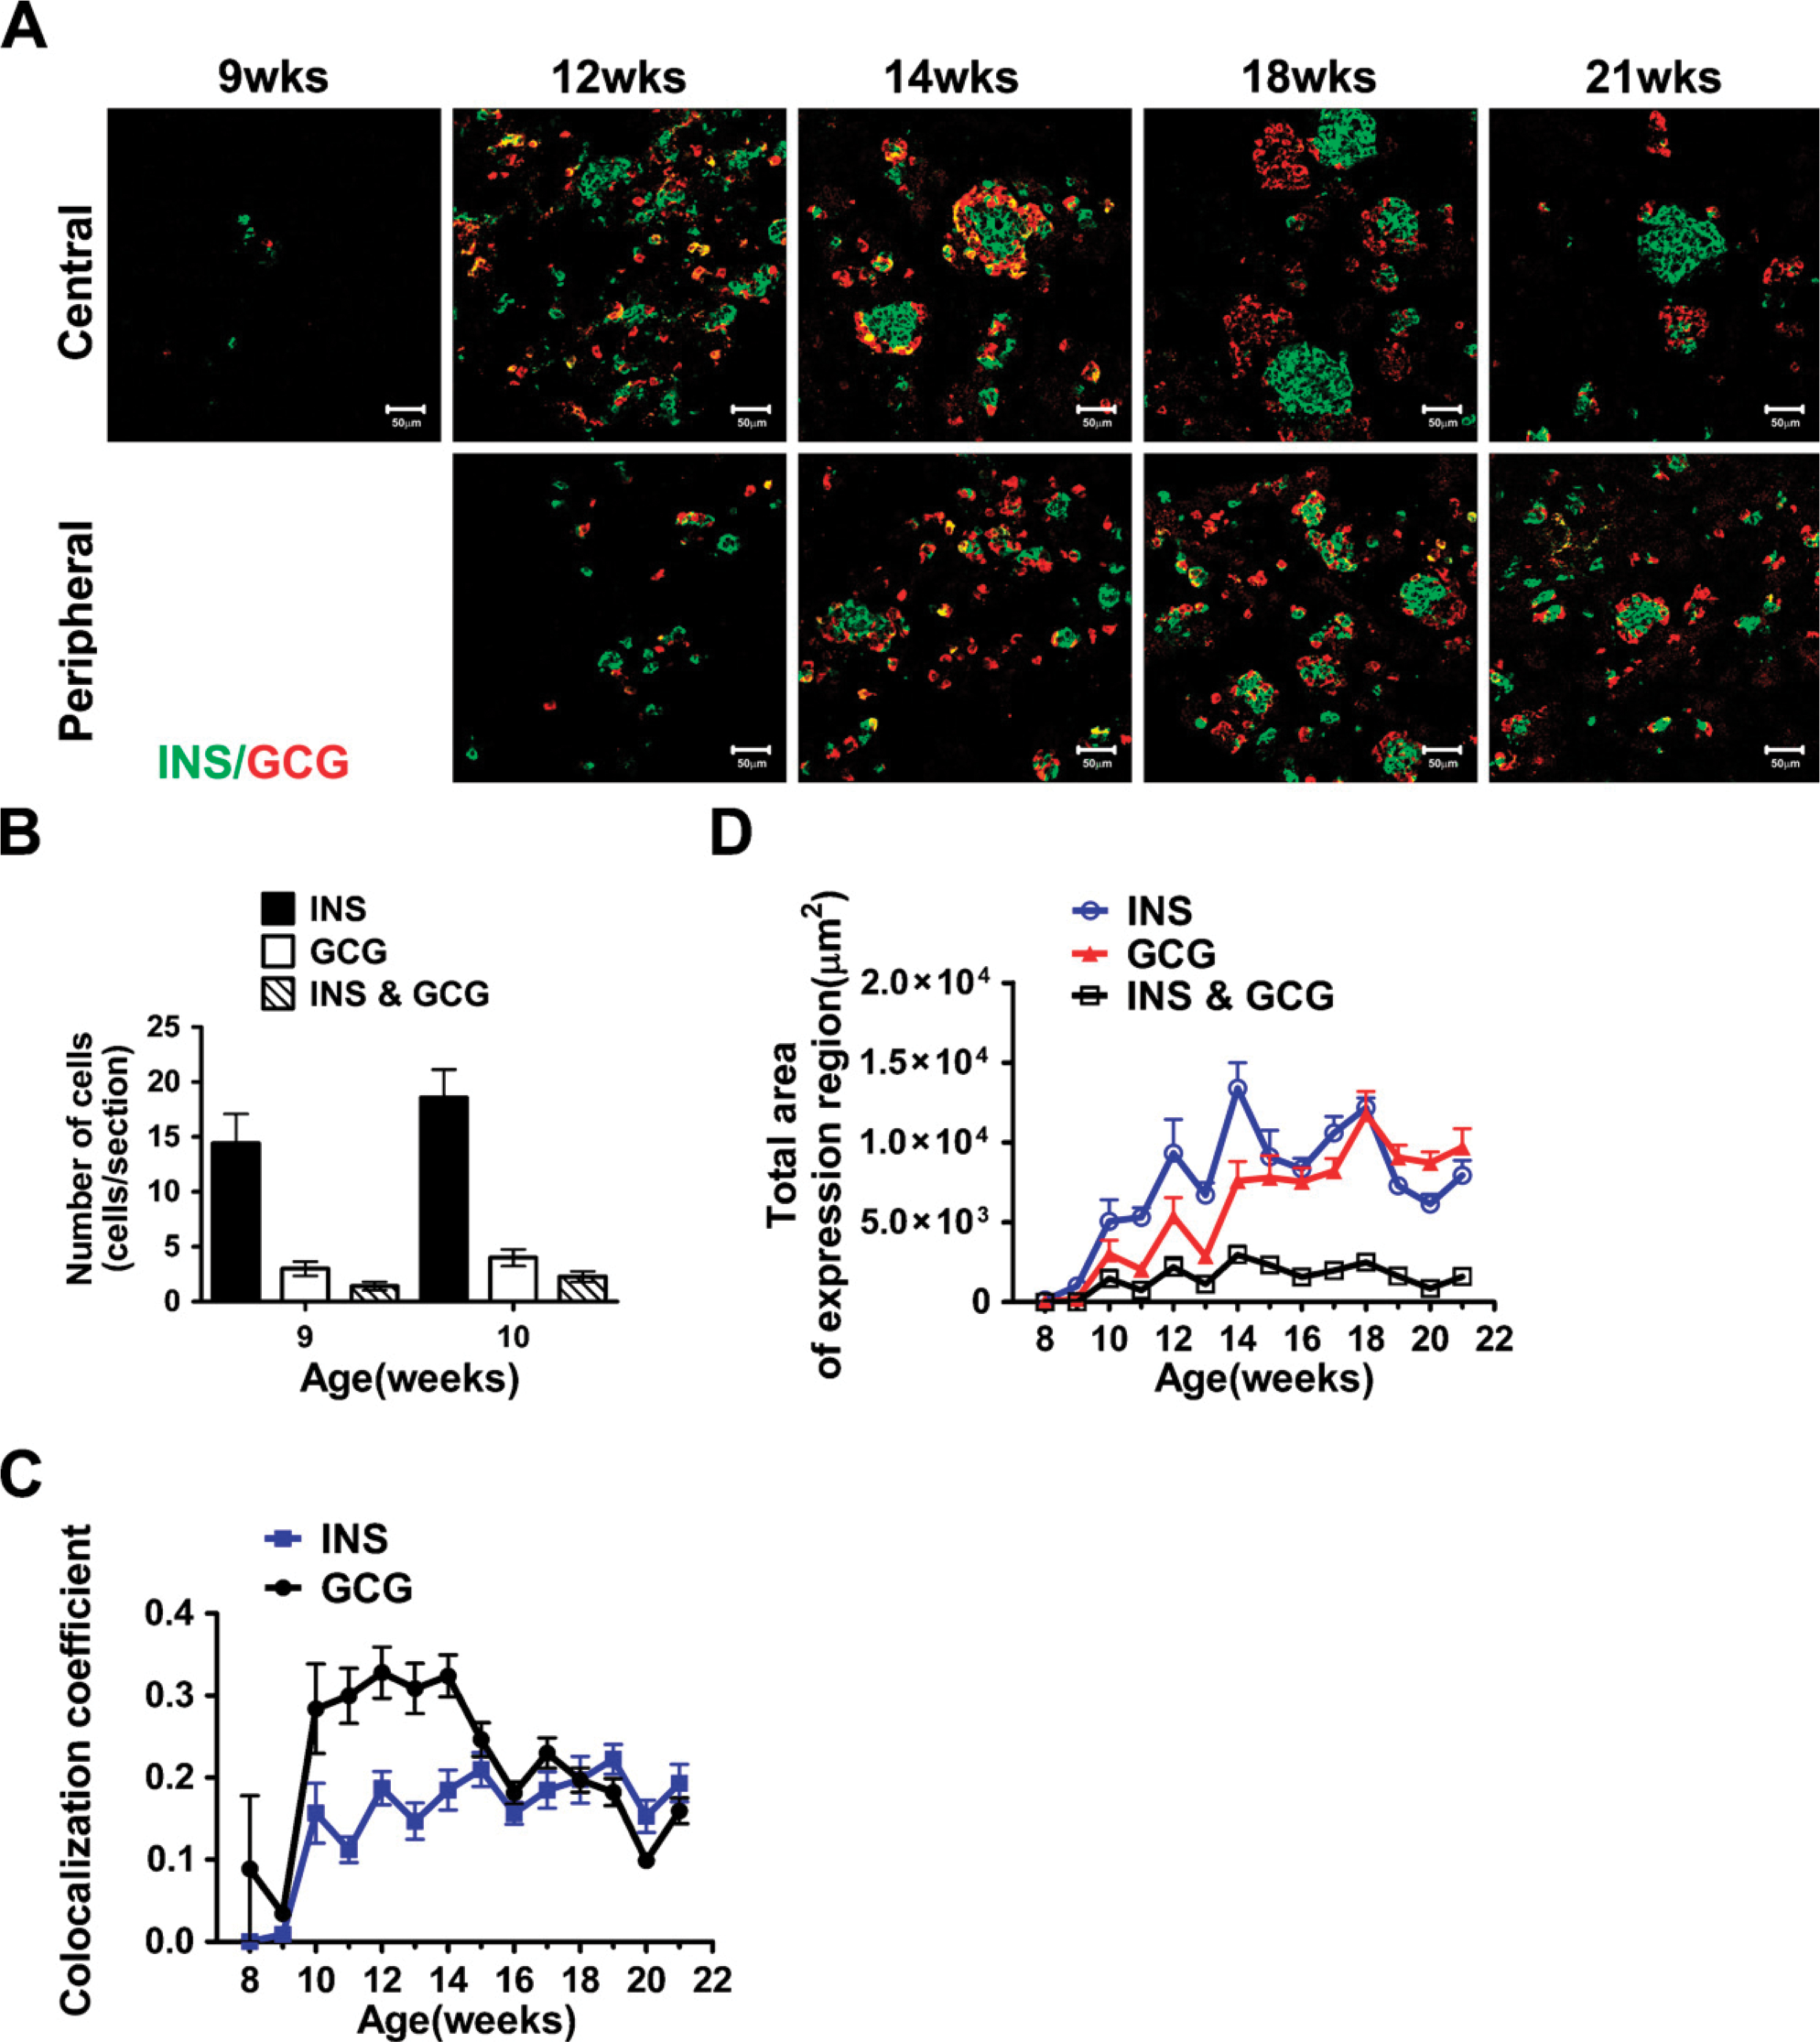
Coexpression of insulin and glucagon during human pancreas development. (

Spatial distribution of clustering endocrine cells. (
Clustering of Endocrine Cells Occurs Concomitantly With Increased Hormonal Expression
To determine the expression of transcription factors, we performed expression analyses using qRT-PCR, in situ hybridization, and immunostaining of human fetal pancreas between 7 and 21 weeks of gestational age. In mouse, the transcription factors Ipf1 (also known as Pdx1), Ptf1a, and Hlxb9 are expressed in early pancreatic progenitors, and their function is critical for pancreatic development (Jonsson et al. 1994; Offield et al. 1996; Edlund 1999,2001; Harrison et al. 1999; Li et al. 1999). All these genes have additional late functions; Ipf1/Pdx1 and Hlxb9 are expressed in β cells as they appear and are important for the expression of key β-cell genes (Ohlsson et al. 1993; Harrison et al. 1999; Li et al. 1999), whereas Ptf1a becomes restricted to differentiated acinar cells, where it regulates the expression of acinar enzymes (Krapp et al. 1996,1998; Li et al. 1999). qRT-pCR analyses revealed the expression of IPF1, HLXB9, and PTF1A in the developing human pancreas from 7 to 21 weeks (Figure 4A).
Immunohistochemical analyses showed that IPF1 is expressed in the epithelial progenitor cells throughout the period from 7 to 21 weeks as well as in insulin-expressing cells as they appear (Figure 4B). IPF1 expression could also be observed in occasional glucagon-expressing cells at early but not at later stages of development (data not shown). The expression of IPF1 in glucagon-expressing cells appeared, however, weaker than that observed in pancreatic progenitor cells or insulin-expressing cells (Figure 4B). Although other studies have described a cytoplasmic localization of IPF1 in human fetal pancreas (Piper et al. 2004; Sarkar et al. 2008), we consistently observed a nuclear localization of IPF1 in all of the tissues and stages analyzed (Figure 4B).

Expression of transcription factors in human fetal pancreas between weeks 7 and 21. (
The relative expression of the proendocrine gene NGN3 (Gasa et al. 2004) was low prior to 9 weeks, but from 9 weeks onward, the expression increased sharply and remained high until 17 weeks, after which the expression declined (Figure 4A). In situ hybridization analysis further demonstrated that NGN3-expressing cells were present at all stages analyzed (Figure 4C). As expected, the relative expression of the differentiated endocrine cell markers ISL1, NEUROD1, and INSM1 (Ahlgren et al. 1997; Naya et al. 1997; Gierl et al. 2006) was initially low but increased from week 15 onward (Figure 4A). Thus, as in mouse, the expression of the proendocrine gene NGN3 precedes that of transcription factors linked to terminal endocrine cell differentiation (Gradwohl et al. 2000; Gu et al. 2002; Johansson et al. 2007). Similar to that observed in the mouse, Isl1 is expressed both in differentiated endocrine cells (Figure 5 and data not shown) as well as early pancreatic mesenchymal cells (Figure 5).
The expression of PAX4, which in mouse initially marks endocrine progenitors (Greenwood et al. 2007) and later β-cell progenitors (Collombat et al. 2003,2005), and ARX, which in mouse marks α-cell progenitors (Collombat et al. 2003,2005), were virtually undetectable at 7 and 8 weeks (Figure 4A). By 9 weeks onward, PAX4 expression was prominent, whereas ARX expression started to increase first after 11 weeks (Figure 4A). NKX2.2 and NKX6.1 expression was detectable at 7 weeks, and the expression of both transcription factors increased throughout the developmental stages analyzed (Figure 4A). MAFB expression also increased from 7 to 21 weeks, whereas the expression of MAFA, a marker for mature β cells, was virtually undetectable at all stages analyzed (Figure 4A and data not shown). Other factors linked to pancreatic cell specification and/or differentiation, such as the MODY5 gene TCF2 (also known as HNF1β), FOXA2, FOXD3, and ONECUT/HNF6, were relatively highly expressed from week 7 until week 21 (Figure 4A).
Expression of Signaling Molecules and Growth Factors in the Developing Human Pancreas
We next analyzed the expression of genes encoding growth factors and signaling molecules involved in pancreatic progenitor cell proliferation and differentiation. First, we analyzed by qRT-PCR the expression of EGF receptor (EGFR) and FGF receptor 2 (FGFR2). The EGF and FGF signaling pathways are implicated in the growth and proliferation of pancreatic progenitor cells; FGFR2B (Revest et al. 2001) and FGF10 (an FGFR2b high-affinity ligand) (Ohuchi et al. 2000; Bhushan et al. 2001) knockout mice show pancreatic hypoplasia. EGFR mutant mice show a pancreatic epithelial cell proliferation defect, a delay in β-cell generation, and perturbed islet cell migration (Miettinen et al. 2000). In the developing human pancreas, the expression of both receptors is high at 7 weeks but declines and is low from 11 weeks onward (Figure 6A).
During mouse pancreatic development, NOTCH signaling controls pancreatic cell differentiation (Apelqvist et al. 1999; Jensen et al. 2000), and qRT-PCR analyses revealed the expression of several NOTCH signaling components in the developing human pancreas. NOTCH1 expression was high at 7 weeks but then declined, whereas the expression of DELTA-LIKE-1 (DLLK1) was low until 11 weeks and then increased (Figure 6A). During the 7- to 21-week period, HES1, but not HES5 or HEY1, was prominently expressed, although the expression levels gradually decreased from 7 to 21 weeks (Figure 6A).
Bone morphogenetic protein (BMP) 4 has been implicated in pancreatic endocrine progenitor cell expansion and inhibition of differentiation through ID2 (Hua et al. 2006). Moreover, BMP4 appears to be required for the acquisition and/or maintenance of β-cell function (Goulley et al. 2007). In the human fetal pancreas, BMP4 and its type 1 receptor, BMPR1A, were expressed between 7 and 21 weeks (Figure 6A); the expression levels decreased sharply from 7 to 11 weeks and increased slightly from 11 to 21 weeks. Interestingly, BMP4 and ID2 showed similar expression profiles between 7 and 13 weeks, but whereas ID2 expression remained low until 21 weeks, BMP4 expression increased (Figure 6A).
Expression of Differentiated Endocrine and Exocrine Genes
qRT-PCR and immunostaining were performed to determine the expression profiles of markers for differentiated pancreatic endocrine cells. qRT-PCR analysis showed that upon an exponential-like increase in the expression of the endocrine hormones (Figure 6B), GLUCAGON (GCG), INSULIN (INS), and SOMATOSTATIN (SST) expression had increased 13,000, 7300 and 840-fold, respectively, at 18 weeks, as compared with that observed at 7 weeks. GHRELIN (GHRL) expression was considerably lower at all stages analyzed (Figure 6B). The expression of the islet amyloid polypeptide (IAPP) was virtually undetectable until week 17, but then increased dramatically, and the expression of GLUCOKINASE (GCK), the rate-limiting enzyme in glucose metabolism, increased 150-fold from 7 to 21 weeks, whereas glucose transporter type 2 (GLUT2 or SLC2A2) expression was barely detectable at all stages analyzed (data not shown). The expression of the prohormone convertases PCSK1 and PCSK2 was initially low but increased 100- and 10-fold, respectively, from 11 weeks onward (Figure 6B). Finally, we analyzed the expression of ductal and acinar markers in the human fetal pancreas. The expression of carbonic anhydrase 2 (CA2), a marker for ductal cells, decreased 10-fold between 7 and 11 weeks, but then increased 13-fold between weeks 13 to 21 (Figure 6B). The expression of the acinar enzyme AMYLASE (AMY) was low throughout the period from 7 to 21 weeks (Figure 6B) and undetectable by immunohistochemistry (data not shown).
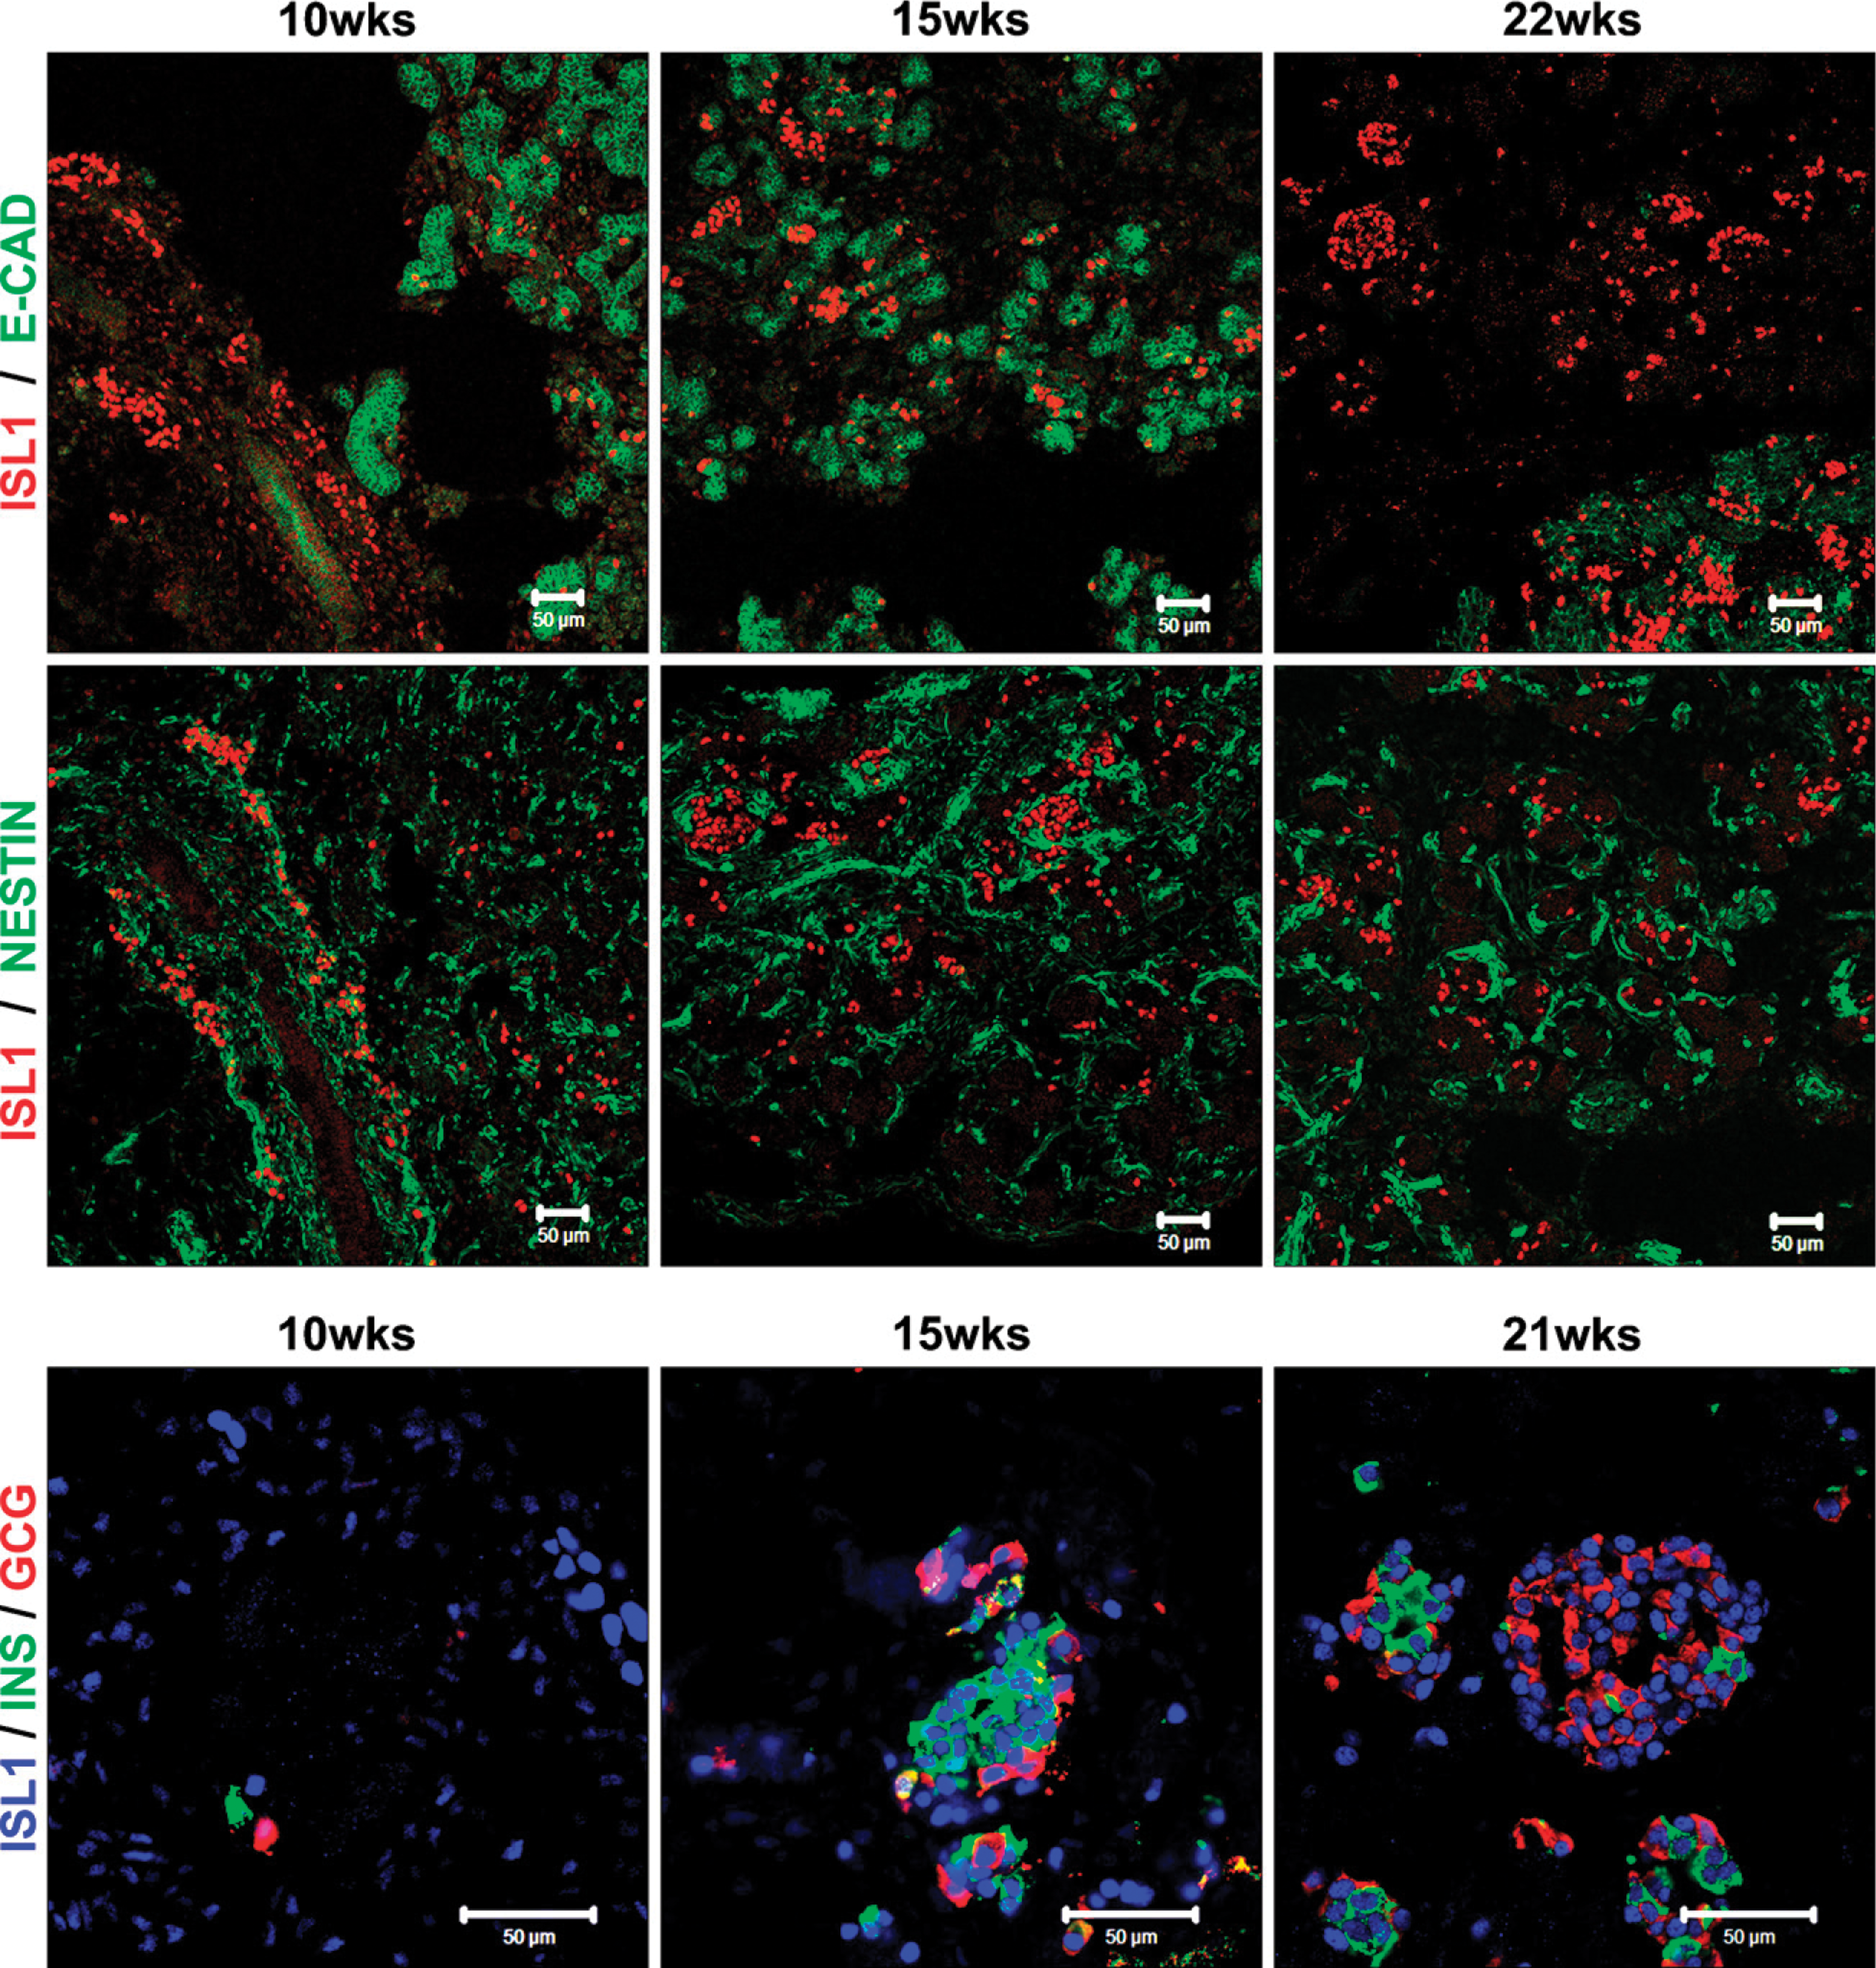
Isl1 expression during human pancreas development. Immunostaining of 10-, 15-, 21-, and 22-week fetal human pancreas using anti-Isl1 (red) and E-cadherin (green) (upper images), anti-Isl1 (red) and nestin (green) (middle images), and anti-Isl1 (blue), insulin (green), and glucagon (red) (lower images) antibodies. Bar = 50 μm.

Expression of signaling molecules, growth factors, and endocrine markers in human fetal pancreas between weeks 7 and 21. Expression analysis by qRT-PCR of (
Discussion
One of the most promising approaches to alleviating the lack of pancreatic donors needed for cell transplantation-based therapy is the generation of new insulin-producing cells, either from hES cells or embryonic pancreatic progenitor cells. Human stem cells represent a promising alternative source of insulin-producing cells, and recent reports by Baetge and coworkers (D'Amour et al. 2006; Kroon et al. 2008) have described encouraging protocols aiming to generate β cells in vitro from hES cells. These protocols failed, however, to produce fully mature β cells in vitro and resulted in the generation of cells equivalent to immature, fetal islet or pancreatic progenitor cells that required further development in vivo to generate glucose-responsive, insulin-producing cells capable of reversing diabetes in streptozotocin-treated mice (Kroon et al. 2008). Hence, increased knowledge regarding molecular mechanisms regulating the generation and maturation of human islets during normal development is critical for further improvements of these in vitro differentiation protocols. Animal models, in particular mouse, have been extensively used to study pancreatic developmental processes, and the results obtained are frequently extrapolated to the human pancreas. Recent studies (Brissova et al. 2005; Cabrera et al. 2006) have, however, demonstrated that differences between human and mouse islet cytoarchitecture have functional implications, stressing the necessity of fully deciphering human fetal islet development.
In this study, we have performed immunohistochemical analyses, examined the morphology of the forming islets, and analyzed the coexpression of insulin and glucagon during the period of hormone expression and islet clustering. Our study also includes sequential gene expression profile analyses of 36 human fetal pancreases, from 7 to 21 weeks, thus linking gene expression to organogenesis. The immunohistochemical analyses show that insulin- and glucagon-positive cells initially appear scattered within the pancreas, but by week 14, a characteristic structure with the insulin-positive cells in the center and the glucagon-positive cells in the periphery was apparent (Figure 1A). Next, the ring of glucagon-positive cells surrounding the core of insulin-positive cells appeared to “open up,” and later, insulin- and glucagon-positive cells had expanded and now formed insulin cell and glucagon cell homogeneous clusters, respectively. Figure 1 shows images representative of the most advanced cell clusters, but at each stage, it is possible to find less-aggregated and single cells, mostly dependent on their intra-organ localization (Figure 3A). Figure 3B shows a schematic summary of the islet-like cluster formation that we observed through our immunohistochemical analyses of the fetal pancreas. The complete determination of the sequence of events that ultimately results in the formation of the typical adult human islet with intermingled insulin and glucagon cells would, however, require the analyses of fetal stages beyond weeks 21–22. Our results imply, however, that the process leading to the formation of mature human islets with intermingled β and α cells (Figure 1A) (Cabrera et al. 2006) occurs after 21 weeks of gestation. The mechanism and factors involved in the final organization of human islets remain unknown but are expected to involve cell migration events. Studies on the expression of various adhesion molecules during this period are likely to provide further insight into the process involved in the formation of mature human islets.
In agreement with previous observations (Bocian-Sobkowska et al. 1999), our immunohistochemical analyses revealed occasional insulin and glucagon double-positive cells, predominantly at early stages (Figure 2A). We also quantified the relative and absolute values of glucagon and insulin coexpression in human fetal pancreas from 8 to 21 weeks of gestational age (Figures 2B–2D). The method used to quantify the double expression of insulin and glucagon, i.e., the Zeiss LSM510 software (version 3.2), is based not on the visual observation of the change in color (i.e., from green and red to yellow), but on the measurement of light emission at different wavelengths within the same point, which makes the results more accurate and reproducible. The low number of cells coexpressing insulin and glucagon is constant from 10 to 21 weeks, although the relative number decreases. These results suggest that in the human developing pancreas, a small subfraction of immature endocrine cells may express more than one hormone, at least until week 21. At all stages analyzed, cells coexpressing insulin and glucagon are mainly restricted to small aggregates, suggesting that they represent newly formed endocrine cells.
Another interesting observation is that islet cell aggregation is heterogeneous within the developing pancreas; thus, it appears to initiate at the center of the tissue and then spread toward the periphery (Figure 3A), confirming previous studies (Polak et al. 2000). This observation suggests that endocrine cells are formed at the central region of the developing pancreas and migrate toward the periphery of the organ, where they start to cluster or, alternatively, that endocrine cells are continuously generated from progenitor cells present in the expanding ductal epithelium.
IPF1/Pdx1 plays an important role both during early pancreatic development and in adult β cells of both mice and men (Ohlsson et al. 1993; Jonsson et al. 1994; Offield et al. 1996; Stoffers et al. 1997a,b; Edlund 2001). Consistent with this dual role for IPF1, and in agreement with that seen during mouse pancreatic development, we observed strong nuclear IPF1 expression in both early pancreatic progenitor cells and emerging β cells of human fetal pancreas. Although some studies have described a cytoplasmic location of IPF1 (Piper et al. 2004; Sarkar et al. 2008) and attributed a regulatory function to a presumed shuttling from the nucleus to the cytoplasm (Piper et al. 2004), we consistently observe a nuclear localization for IPF1 at all analyzed stages of human and mouse pancreatic development. From our experience, the procedure of fixation is critical in this respect because poor fixation leads to leakage of nuclear factors, including IPF1, to the cytoplasm.
The period of islet cell differentiation and clustering coincides with the expression of NGN3. In fact, the appearance of endocrine cell aggregates occurs simultaneously with the exponential increase in the expression of insulin and other hormones. At this point, our results differ from those reported by Lyttle et al. (2008). Thus, whereas they showed the NGN3 expression level slightly declining from 8 to 21 weeks, we show a Gaussian distribution-like gene expression profile of NGN3. The fact that we performed our qRT-PCR analyses using samples from each individual gestational week from 8 to 21, whereas they pooled their samples in three groups (8–10 weeks, 14–16 weeks, and 19–21 weeks) may explain this difference. Our results suggest that similar to mouse and as hypothesized by others (Sarkar et al. 2008), a secondary transition that lasts for weeks, rather than days, occurs also during human pancreatic development.
In the developing mouse pancreas, Isl1 is required independently for the formation of the dorsal pancreatic mesenchyme, and hence, dorsal pancreatic growth, as well as for islet cell differentiation (Ahlgren et al. 1997). Here we show that Isl1 is abundantly expressed in both early pancreatic mesenchymal cells and differentiated endocrine cells as they appear also in the human developing pancreas. This expression pattern suggests that Isl1 function is conserved from mice to humans.
The expression of PAX4 and ARX, that defines the β- and α-cell fate, respectively (Collombat et al. 2003,2005) is evident already at 7 weeks, but whereas PAX4 expression increases rapidly between 7 and 13 weeks, ARX expression increases first after week 13. This differential expression of PAX4 and ARX may in part explain why, in contrast to mouse pancreatic development, insulin-expressing cells appear earlier than glucagon-expressing cells during human pancreatic development, and why insulin-positive cells initially outnumber glucagon-positive cells. The developmental significance, if any, of the earlier appearance of insulin-positive cells in the developing human pancreas, as compared with mouse pancreas, is unclear. The expression of the retinoic acid-synthesizing enzyme RALDH1 coincides, however, with the appearance of insulin-positive cells in both mouse and humans, and retinoic acid has been shown to positively influence β-cell differentiation from mouse pancreatic progenitor cells (Ostrom et al. 2008).
Previous studies have shown that fetal β cells are non-functional, i.e., they do not respond to glucose (Hoffman et al. 1982; Tuch et al. 1990). In agreement with those studies, the insulin-positive cells formed during the period analyzed do not express the mature β-cell marker MAFA (Nishimura et al. 2006), although other β-cell markers, such as GCK, IAPP, PCSK1, and PCSK2 are expressed. The homotypic nature of the endocrine cell clusters at 18–21 weeks of gestation further strengthens the notion that the islet cells are immature at this stage.
In summary, we present here a detailed analysis of the morphological changes that occur during human pancreatic islet formation and the concomitant gene expression profiles of key markers during endocrine pancreas ontogeny. The data presented here may contribute to a better understanding of human islet formation and thus to the design of protocols aimed at generating insulin-producing cells, or islets, from human stem or progenitor cells for cell replacement therapies.
Footnotes
Acknowledgements
This work was supported by a grant from the Stanley Glaser Foundation (to JAD) and the Diabetes Research Institute Foundation ( ).
).
We thank Kevin Johnson, George MacNamara, and Ainhoa Martin-Pagola for technical assistance, the Human Islet Cell Processing Facility at the Diabetes Research Institute, University of Miami, for providing the human adult pancreatic tissue, and Karen Bookbinder and Dr. Gerald Applegate for assistance with human fetal tissue procurement.