




Abstract
Magnetic resonance angiography (MRA) is now a widely accepted technique used to characterize vascular pathology such as stenosis, dissection, fistula, and aneurysms. Magnetic resonance techniques are increasingly driving clinical decision making by vascular physicians. The physics behind MRA can contribute to the general understanding and interpretation of the anatomic images. We seek to provide a window into how magnetic resonance images are generated, which techniques may be employed, and the potential advantages and limitations of various techniques and to discuss the future role MRA may have for the vascular physician.
Keywords
The Theory
Magnetic resonance angiography (MRA) is now a widely accepted technique to diagnose vascular pathology such as arteriosclerosis, vasculitis, stenosis, dissection, fistula, and aneurysms. The physics can contribute to the general understanding and interpretation of the anatomic images. We seek to provide a window into how magnetic resonance images are generated and the most commonly used MRA techniques and to discuss the future role MRA may have for the vascular physician.
Magnetic resonance imaging (MRI), including MRA, is the result of applying an external magnetic field to a subject and then applying a spectrum of radiofrequency (RF) waves. Nuclei with an unpaired proton such as hydrogen have magnetic moments owing to the unpaired spin of the odd proton. 1 When exposed to an external magnetic field (let us define it to be along the longitudinal or z-axis), precessing protons align either parallel or antiparallel to the magnetic field, with a population bias toward the parallel configuration (because it requires less energy), giving the population a net magnetization (convention puts this along the positive z-axis). If nuclei experience an RF pulse that has energy equal to the difference in energy between the parallel and antiparallel configurations, the nuclei resonate and are excited into a higher energy state. Through a series of RF pulses or a combination of RF pulses and magnetic field gradient pulses, the nuclei can acquire a magnetization in the transverse plane (or the x-y plane). Subsequently, when these RF pulses are stopped, the nuclei will transition to thermal equilibrium and align with the main magnetic field as they were before the RF pulses, with emission of electromagnetic energy corresponding to the transition.
Nuclei in different electron environments can be differentiated because the electrons surrounding the nucleus shield the nucleus from the magnetic field, causing the effective magnetic field to be weaker than the applied magnetic field, lowering the difference in energy between the parallel and antiparallel configurations. Therefore, the nucleus will resonate at a lower frequency, and this variable allows for the differentiation of nuclei. The human body is composed mostly of water and fat. Conventional MRI, including MRA, essentially images the hydrogen protons of water and fat in tissue. The hydrogen protons within different tissues such as blood, muscle, or bone resonate at slightly different frequencies when placed in the magnet and are exposed to varying magnetic fields. Since the various tissues in the body are affected by the magnetic forces slightly differently, differing signals are generated that can be mapped out and transformed into images. If the RF pulses cease, the nuclei will spontaneously return to thermal equilibrium and align with the magnetic field as they were before being bombarded by the RF pulses.
The return to equilibrium is determined by the T1 relaxation times of tissue, typically measured in hundreds of milliseconds. T1 relaxation time, also known as the longitudinal relaxation, characterizes the time it takes the spins of the nuclei to realign with the main magnetic field. Longitudinal relaxation of magnetization is an exponential process, governed by the time constant T1, and after five T1periods, more than 99% of magnetization has recovered to its equilibrium alignment. More specifically, it is the time that it takes the net magnetization in the z-axis to return to 0.63 times its original value and is represented by the following equation:

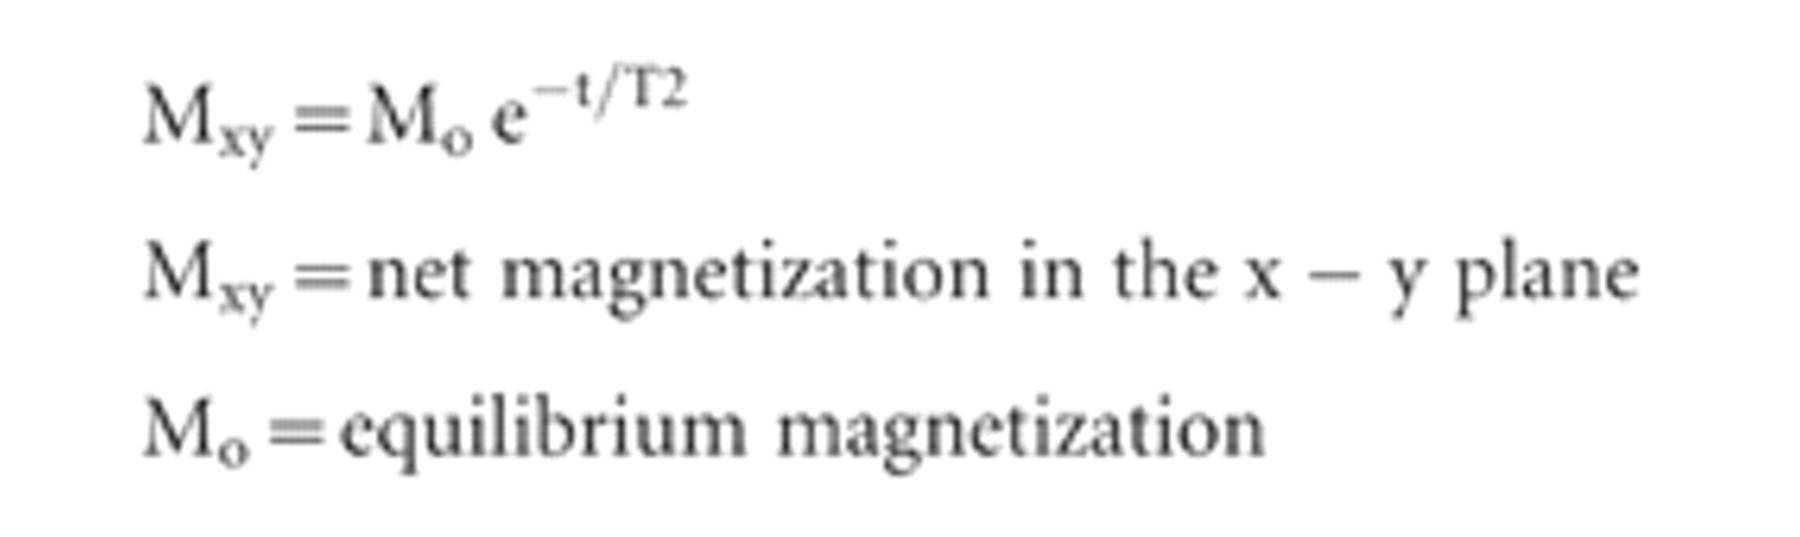
T2 relaxation time refers to transverse relaxation and is the time it takes for net magnetization in the x-y axis to decay. 1 When there is a net magnetization in the x-y plane, precession, that is, rotation of the net magnetization vector around the z-axis, will occur. Net magnetization dephases while rotating about the x-y axis and decays such that the net magnetization becomes negligible in the x-y plane. 1 T2 is defined as the time it takes the transverse magnetization to decrease by a factor of 0.37 and is represented by this equation:
In reading the literature on MRA, one may come across the term k-space (or frequency space), which is the format in which the data from the transverse or x-y magnetization are recorded. The k-space representation considers information on the wave number (the inverse of the wavelength) of the transverse magnetization signals. Individual coordinates in k-space representation correspond to individual wave patterns. The superimposed pattern of all of the waves from k-space obtained by fast Fourier transformation convert k-space into the image that we recognize and use in daily practice.
MRA may be performed with various techniques, each with its advantages, disadvantages, and pitfalls. For the purposes of this review, the techniques will be divided into those that require an exogenous intravenous contrast agent and those that do not.
Contrast-Enhanced MRA
Contrast-enhanced magnetic resonance angiography (ceMRA) has proven to be highly accurate, especially when compared with noncontrast techniques (see the diagnostic accuracy section below). ceMRA is a robust, reproducible technique that can be performed in seconds rather than minutes with few flow-related artifacts, unlike the noncontrast techniques (Figure 1). 2
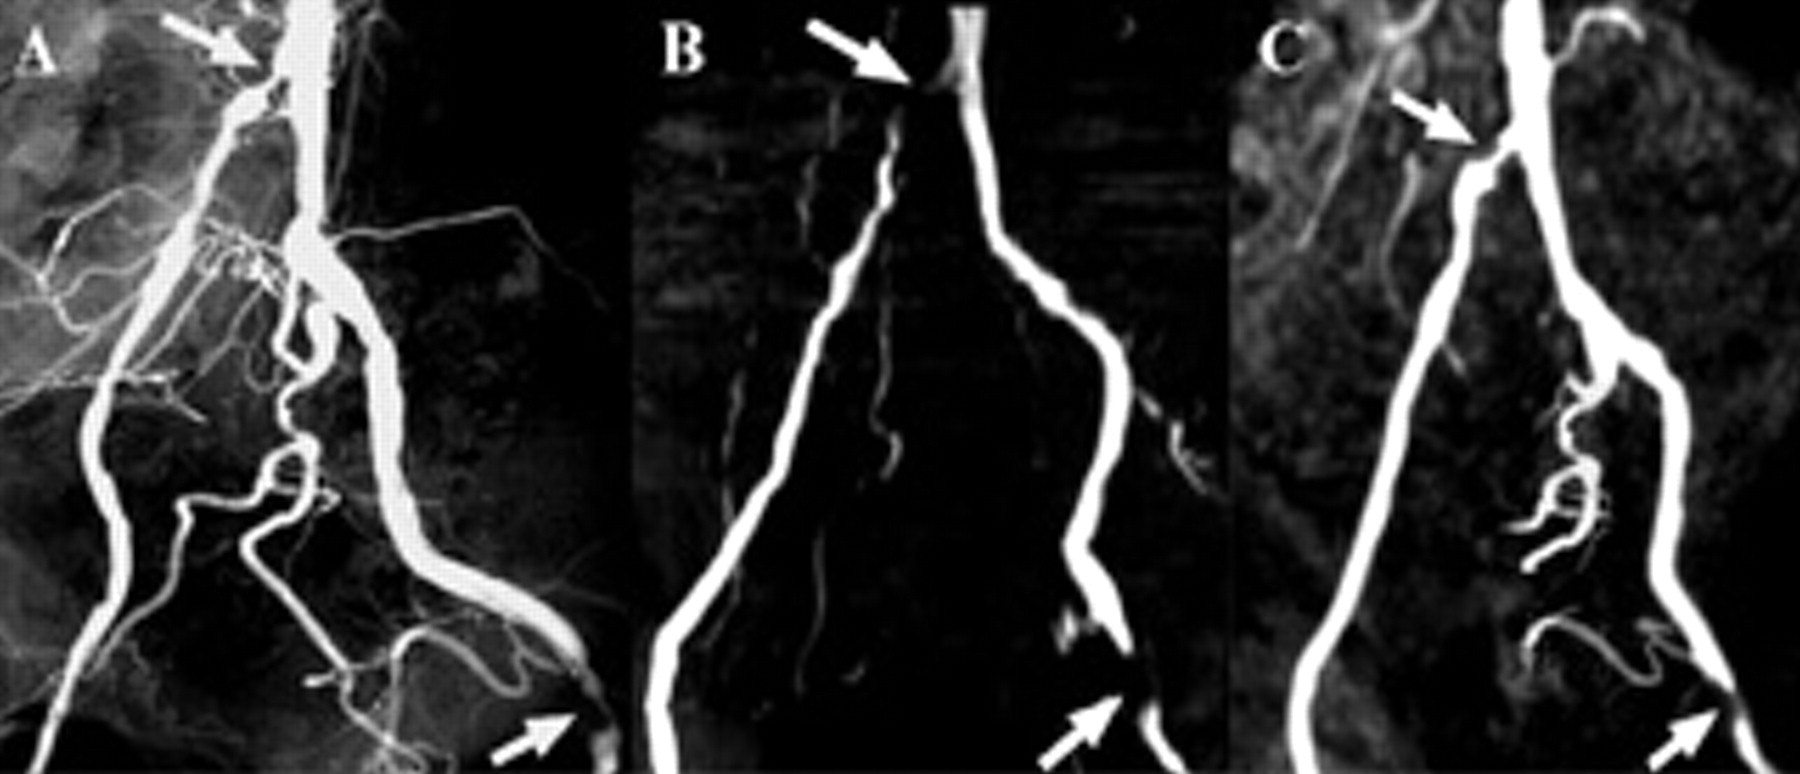
A, Conventional digital subtraction angiogram of the iliac and common femoral arteries; B, two-dimensional time-of-flight (TOF) maximum intensity projection (MIP); and C, three-dimensional gadolinium-enhanced magnetic resonance angiography MIP demonstrating overestimation of stenoses in the right common iliac and left common femoral arteries on the TOF images. The arrows indicate stenoses and how the same stenosis is imaged differently with different techniques.
Gadolinium chelate agents are typically used for ceMRA because they are paramagnetic. This means that they cause shortening of the T1 relaxation of blood compared with background tissue leading to the high signal intensity of blood on T1-weighted sequences. Unlike, time-of-flight (TOF) or phase contrast (PC) imaging, the signal of the blood in ceMRA is based on the intrinsic T1 signal of blood and rather less on flow effects; therefore, this technique is less flow sensitive.
To obtain high-quality images, it is important to have specialized coils overlying the patients to ensure a high signal to noise ratio. 3 Initially, a noncontrast data set is acquired to act as a mask and eliminate background signal. Imaging of the abdomen and chest should be performed in a breathhold so that respiratory motion artifact is limited. Postcontrast images are obtained, and the unenhanced data set is subtracted from the contrast-enhanced data set. Images can be further postprocessed with maximum and minimum intensity projections and volume rendering to generate more visually appealing images (Figure 2), but it should be noted that these images should not typically be used for image interpretation as manipulation of the original data can lead to over- or underestimation of critical dimensions (Figures 3 and 4) (eg, in the context of stenosis, extravascular pathology may also be obscured or overlooked).
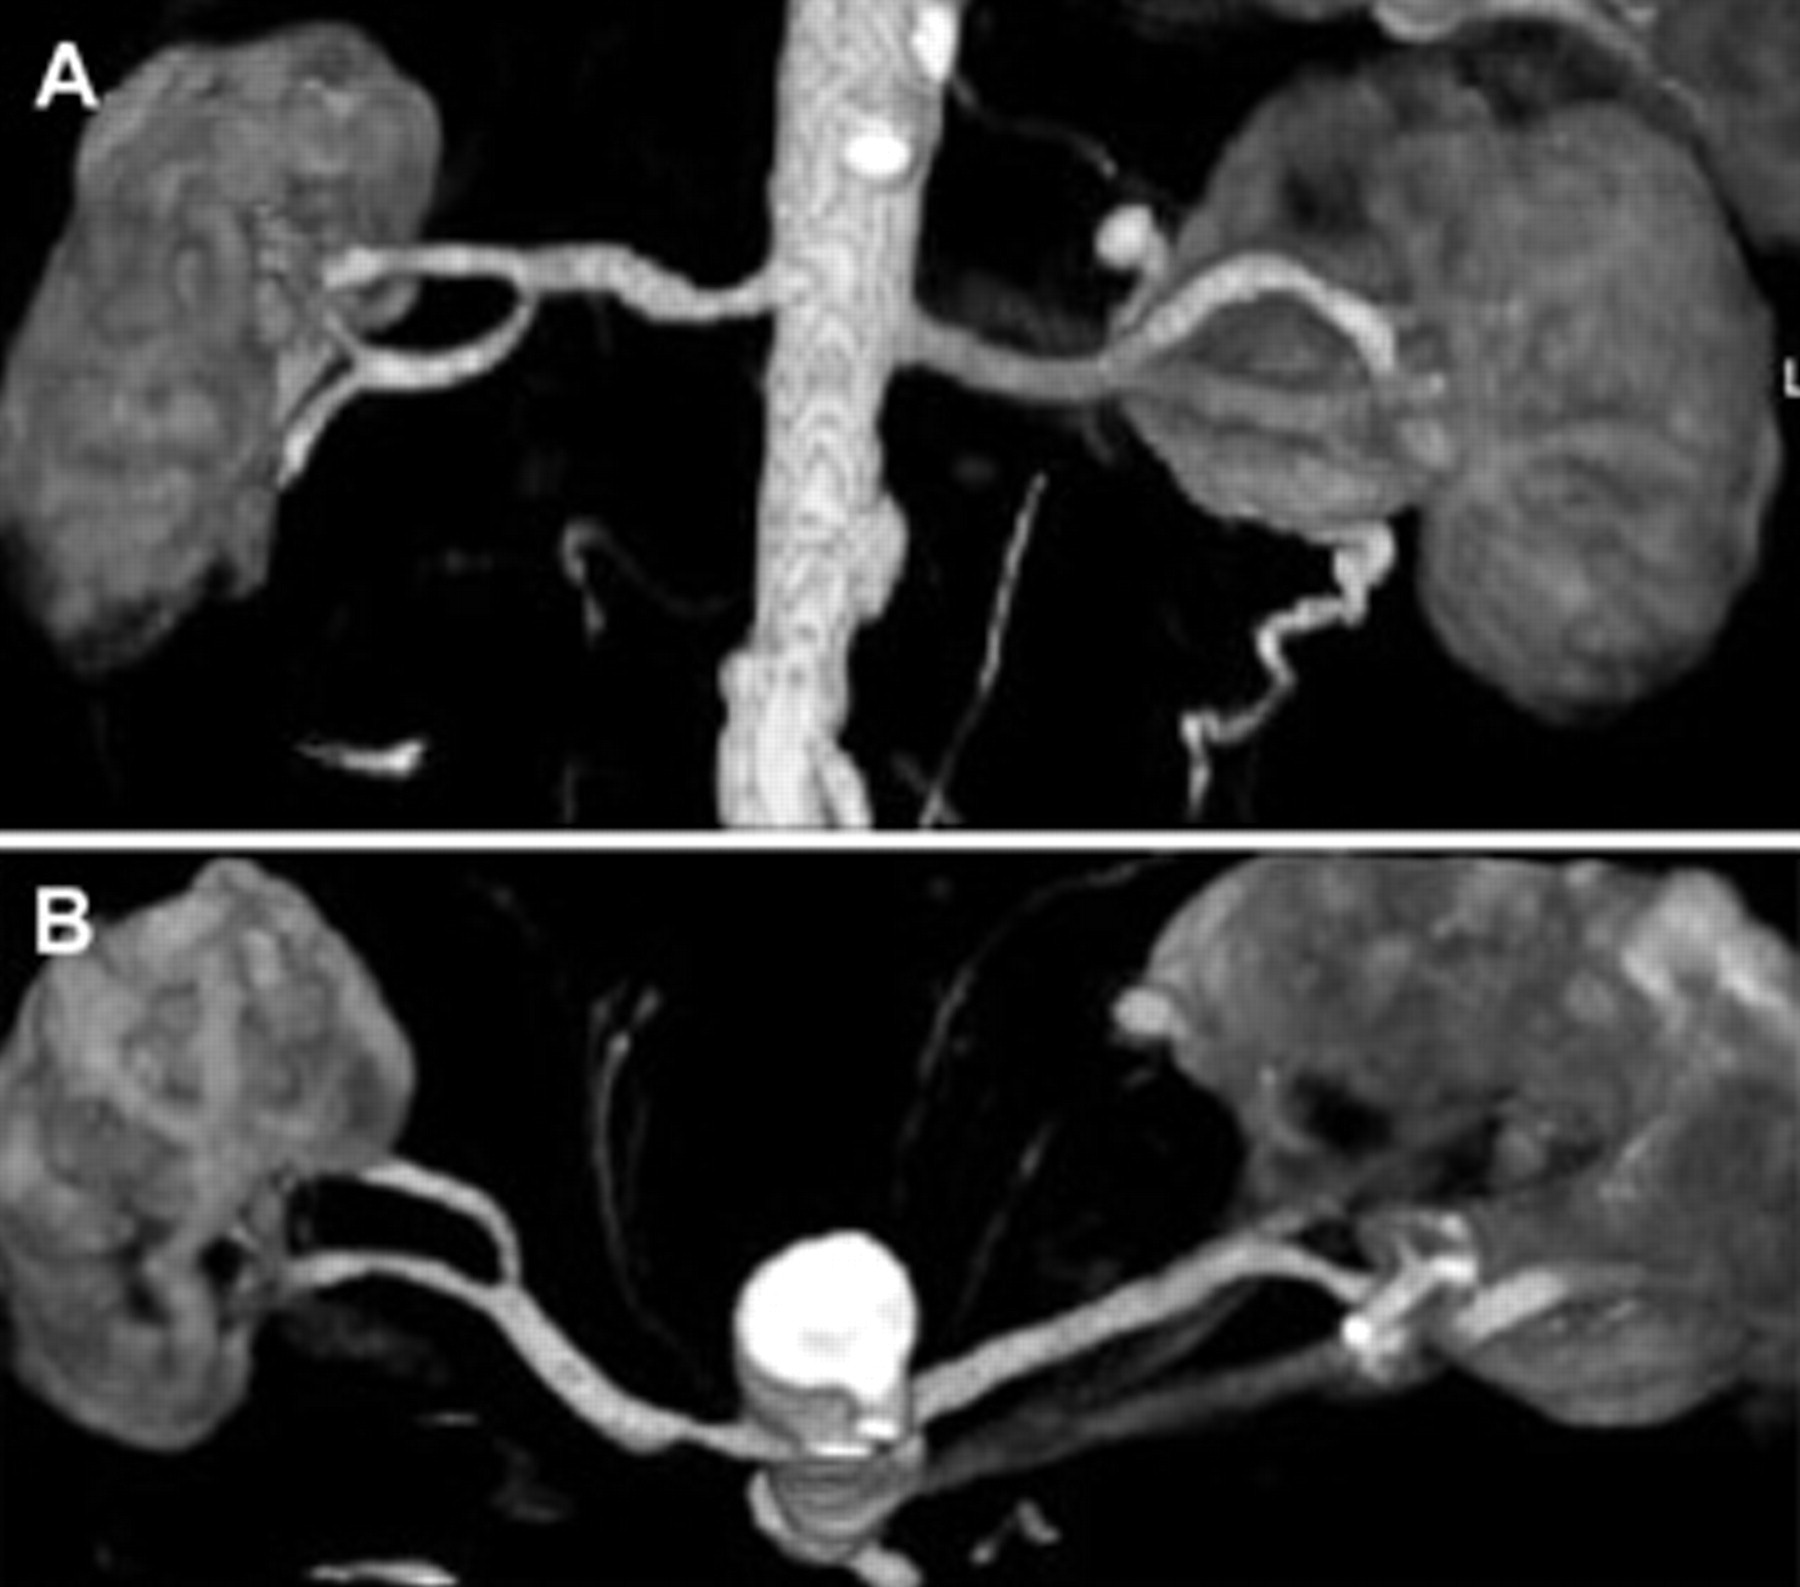
A, Coronal maximum intensity projection (MIP) of a three-dimensional magnetic resonance angiogram of the renal arteries; B, oblique axial MIP of the renal arteries. The degree of stenosis is underestimated in the coronal projection. Having three-dimensional capability to view images in any plane is an advantage over digital subtraction angiography (DSA) as this stenosis would likely be underestimated on DSA.
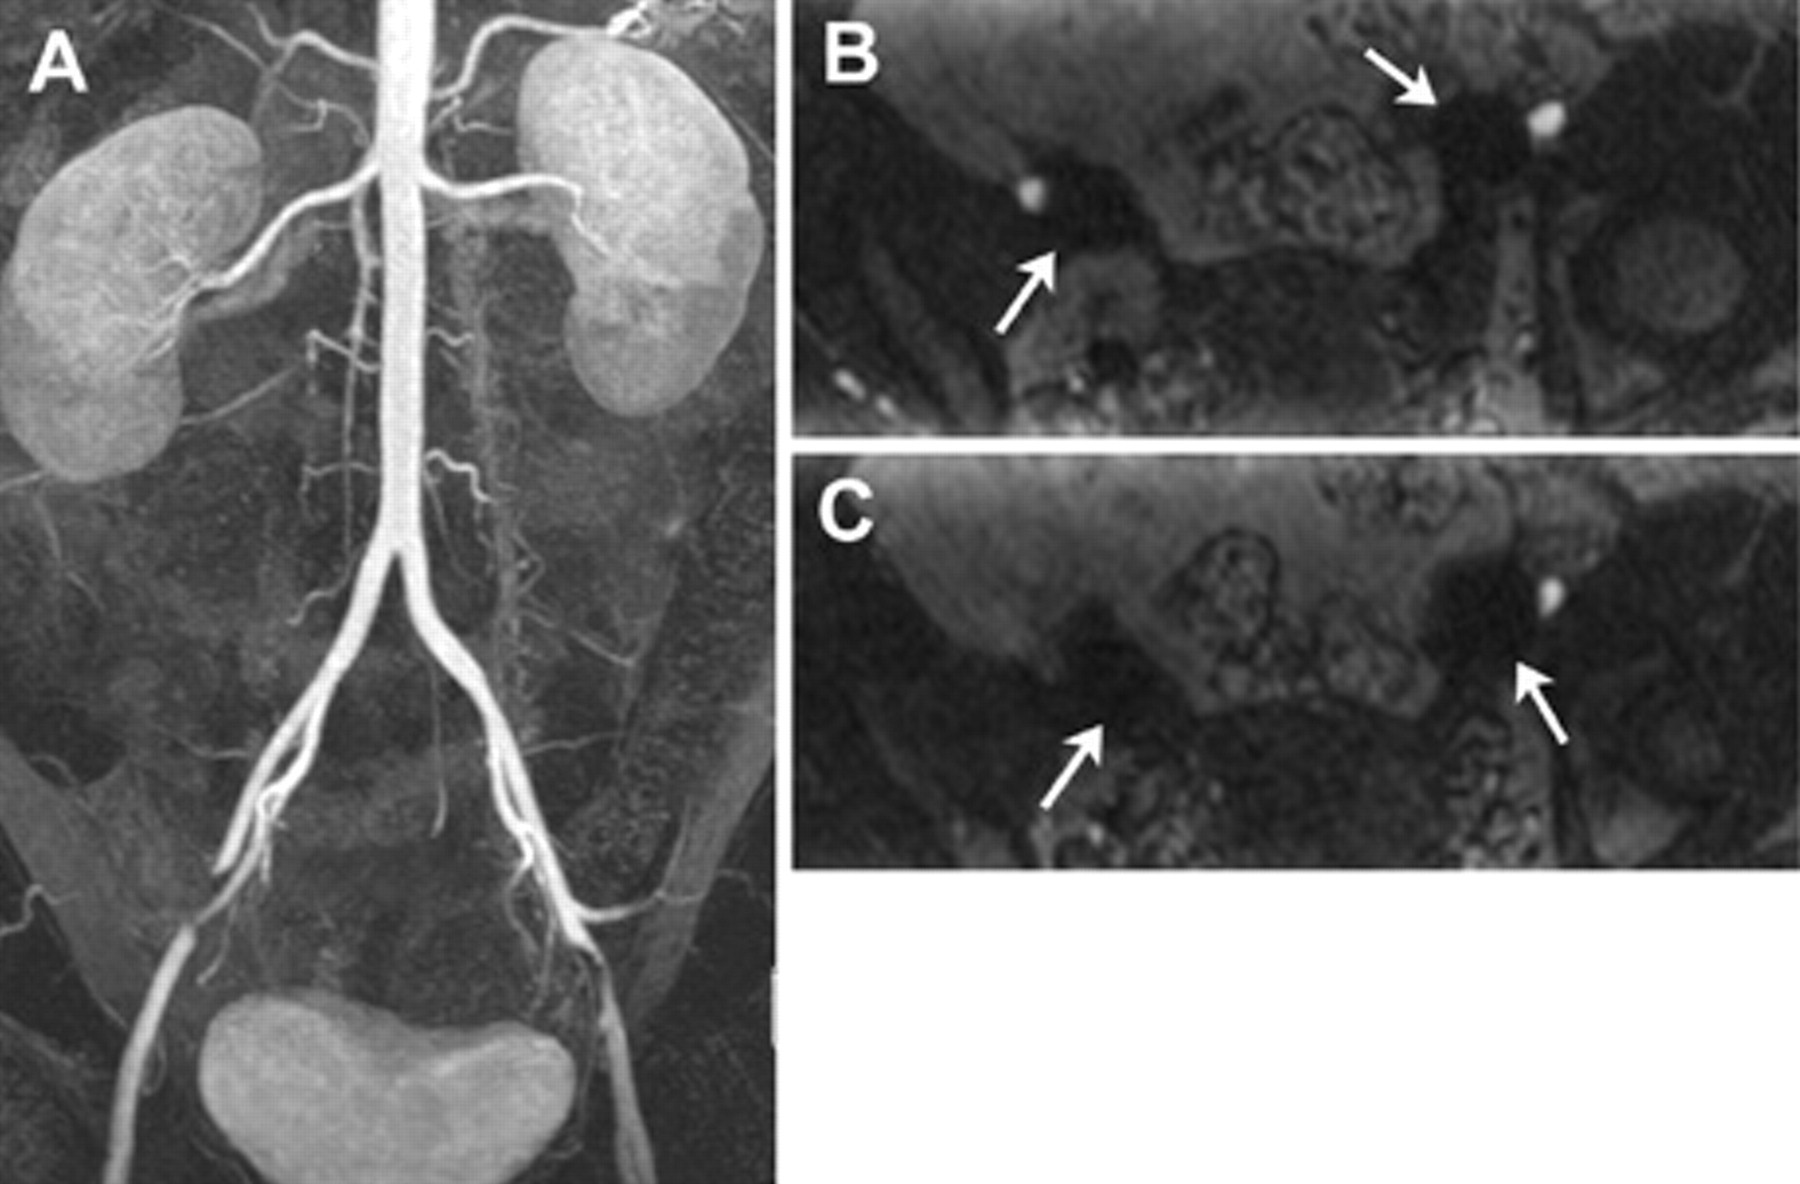
A, Coronal maximum intensity projection of a three-dimensional magnetic resonance angiogram of the abdominal aorta in a young female patient demonstrated apparent stenosis in the external iliac arteries; B and C, source data reveal that there are “blooming” artifacts (arrows) in this region owing to metallic clips related to previous tubal ligation, a potential pitfall leading to overestimation of stenosis.
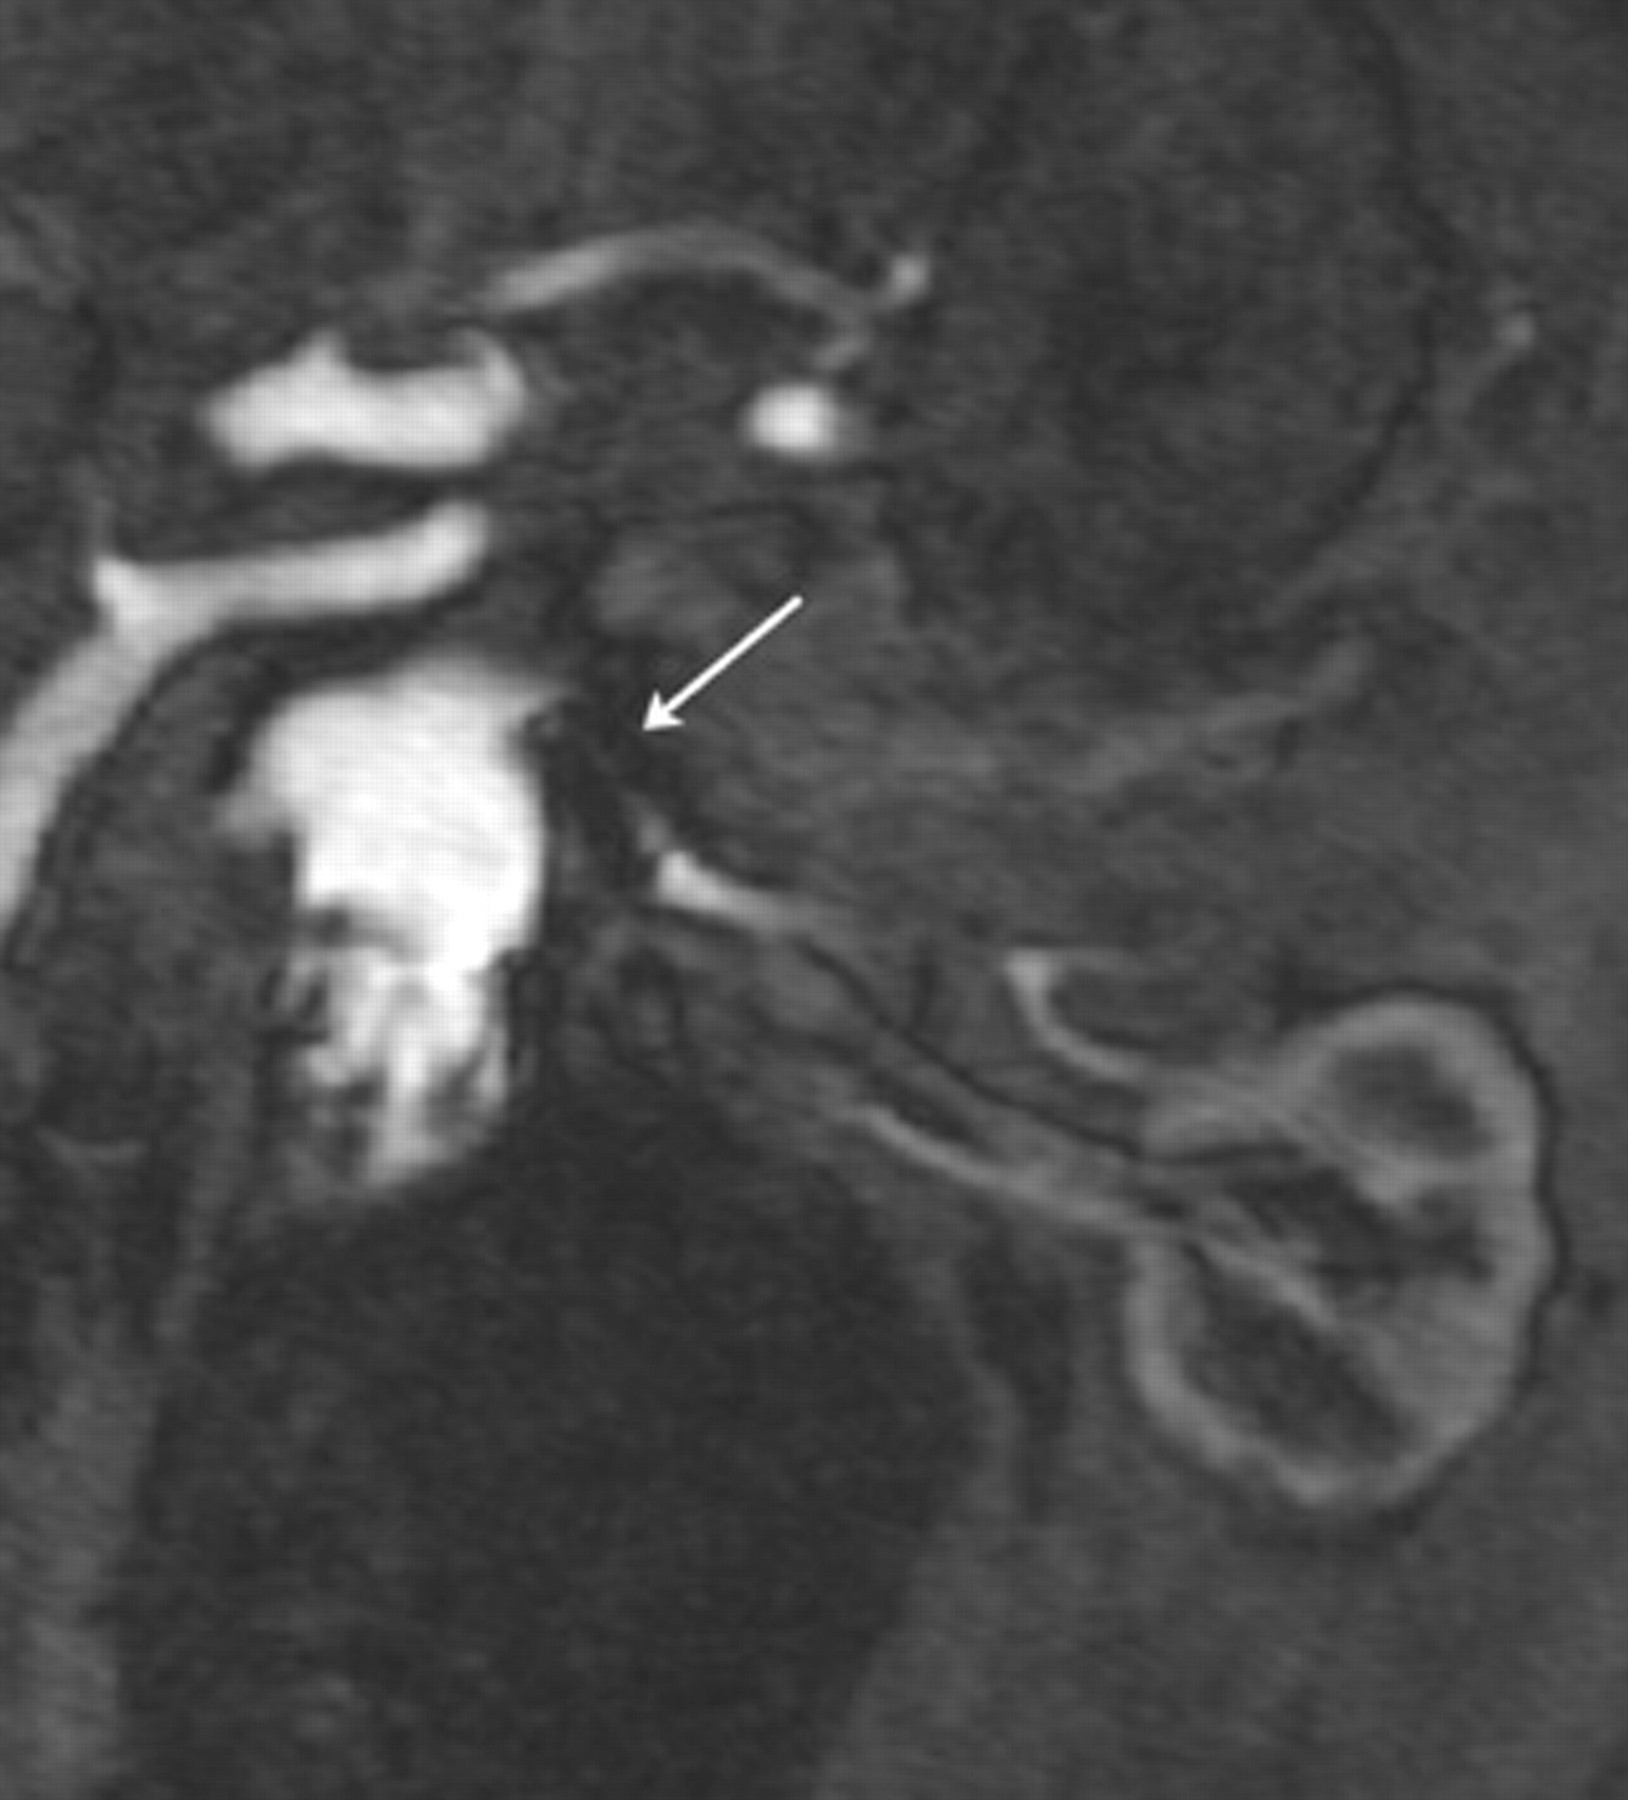
Coronal source data from a three-dimensional magnetic resonance angiogram of the abdominal aorta in a patient with an endovascular aortic stent graft (not shown) and a renal artery stent (arrow) demonstrating “blooming” artifact, a common pitfall that can lead to overestimation of stenosis.
Several important issues must be taken into consideration for image optimization, including the timing, amount, and rate of the injection of contrast agent. The goal is to record the central region of k-space during the maximum enhancement of the artery. 4 The center of k-space contains the lowest (spatial) frequency wave data, so it represents the major structures of the image and thus most of the gross image form and contrast; therefore, the center of k-space should be acquired during the time of highest contrast agent concentration. Also, a high rate of change of the contrast agent concentration during the acquisition of central k-space must be avoided to prevent ringing artifacts, arising in the Fourier transform. 2 When agent administration and imaging are timed properly, ringing artifacts can be reduced or even eliminated. 5 This timing can be coordinated using several methods. 2,4–6 Special considerations with respect to timing must be undertaken with certain vascular problems such as aneurysms: since the flow can be much slower through an aneurysm, more time must be allowed between the injection of contrast agent and the image acquisition. 4
The amount and rate of contrast agent injection have been an extensively studied topic. 2,4 Gadolinium chelate agents do have minor side effects and can even cause severe anaphylaxis and renal dysfunction. Although they are generally considered safe in patients even with abnormal renal function, the dose and potential complications, such as nephrogenic systemic fibrosis, need be considered. There are US Food and Drug Administration (FDA) limits as to how much gadolinium can be injected; thus, the injection duration must be short, and this, in turn, requires care to ensure proper timing of central k-space acquisition. 2
One of the largest problems in using ceMRA is how to avoid venous enhancement, especially in peripheral ceMRA. Timing may be determined by a test bolus and timing formula, fluoroscopic triggering, or time-resolved imaging (Figure 5). 2 A variety of techniques are employed to limit venous contamination, including shortening acquisition time, using a moving table, altering the method of filling k-space, using venous compression devices, and altering the sequence of imaging rather than imaging from head to toe, imaging the head and neck, and moving to the calves and then back up to the abdomen and thighs with a dual injection. 4 Furthermore, a variety of elegant postprocessing approaches have been proposed for resolving ambiguity between arteries and veins in MRA. It should be noted that ceMRA may be combined with other MRA techniques, such as the noninvasive techniques that follow.
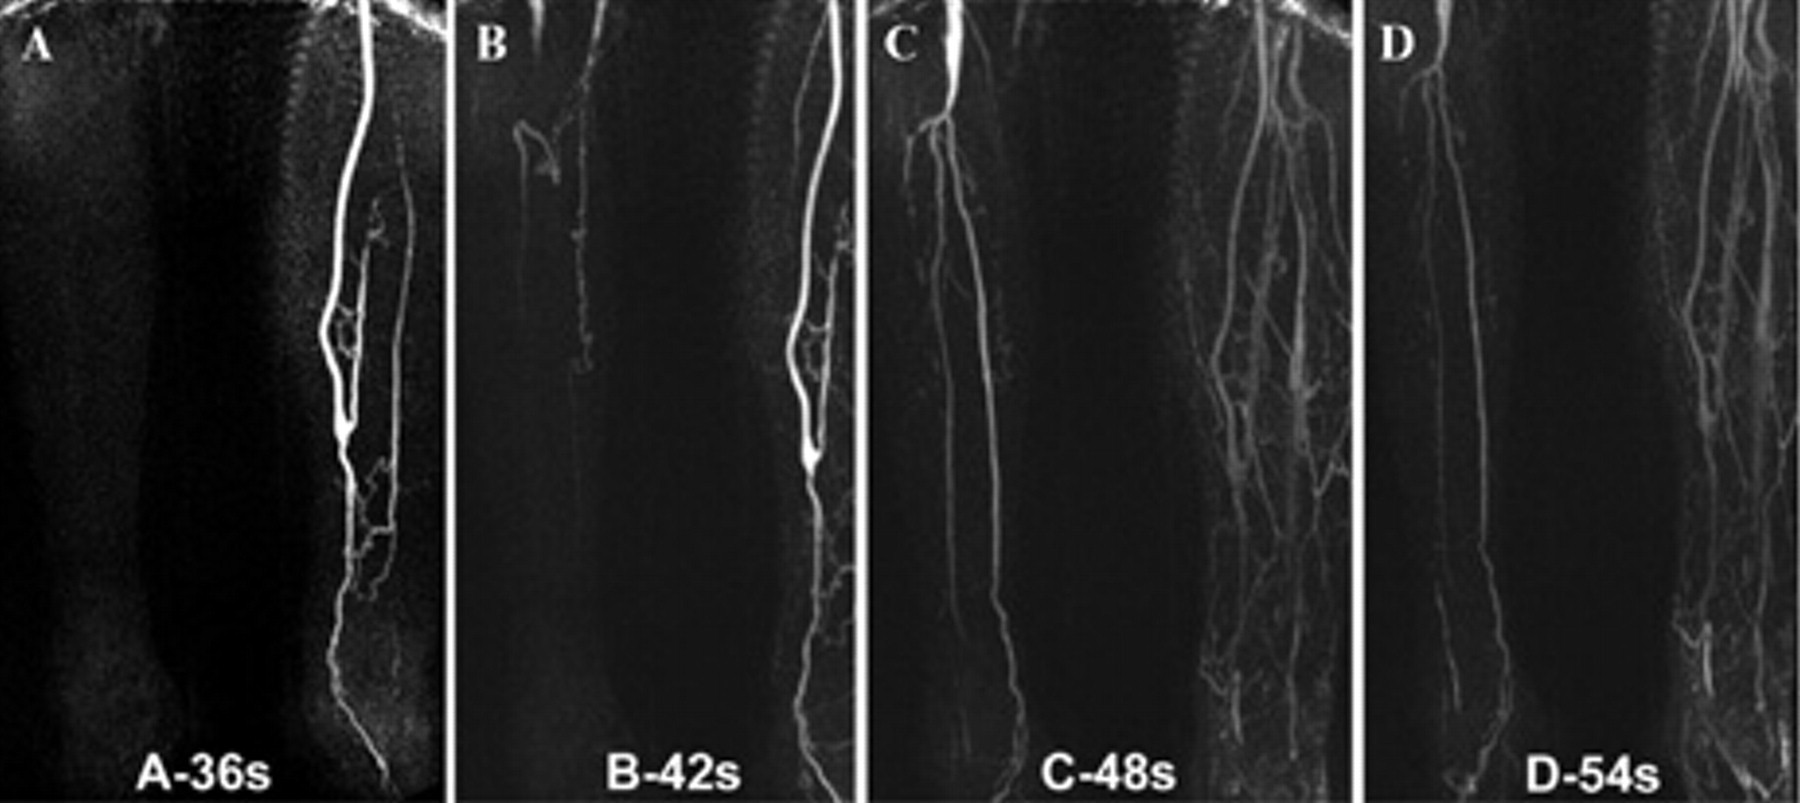
Multiple sequential maximum intensity projection images from a gadolinium-enhanced time-resolved magnetic resonance angiogram (MRA) of the calves in a patient status left common femoral to posterior tibial bypass grafting. Note that there is relatively (A) early filling of the left leg but (B) delayed retrograde filling of the left dorsalis pedis. There is (C) delayed filling of the right calf arteries owing to superficial femoral artery disease and a popliteal artery aneurysm with (D) retrogade opacification of the left dorsalis pedis.
Noncontrast Techniques
Time-of-Flight MRA
Time-of-flight magnetic resonance angiography (TOF-MRA) is dependent on the flow and the movement of protons in blood through the imaging plane (Figure 6). To accomplish this, the technique involves saturating the signal in the slice that is to be imaged with rapid RF pulses. Background or stationary tissues will be suppressed by the RF pulse, whereas fresh-moving blood entering the slice after the RF pulse will retain its signal intensity and create contrast between blood and background tissue. To decrease the time flowing blood spends in the selected slice, slices are chosen perpendicular to blood flow, and often acquisition is coordinated with systolic flow using pulse or electrocardiographic gating (see Figure 5). 7 Overestimation of stenosis may occur if blood is flowing parallel to the slice of interest because flowing blood can be inadvertently suppressed. This artifact is often seen in the foot and proximal anterior tibial artery, otherwise known as in-plane saturation. TOF imaging may be used for arterial or venous imaging. A saturation band may be placed above or below the slice of interest to eliminate flow from artery or veins as needed. For peripheral MRA, venous enhancement can be prevented by saturating a slice distal to the imaging slice so that venous blood is saturated when it reaches the imaging slice. 4
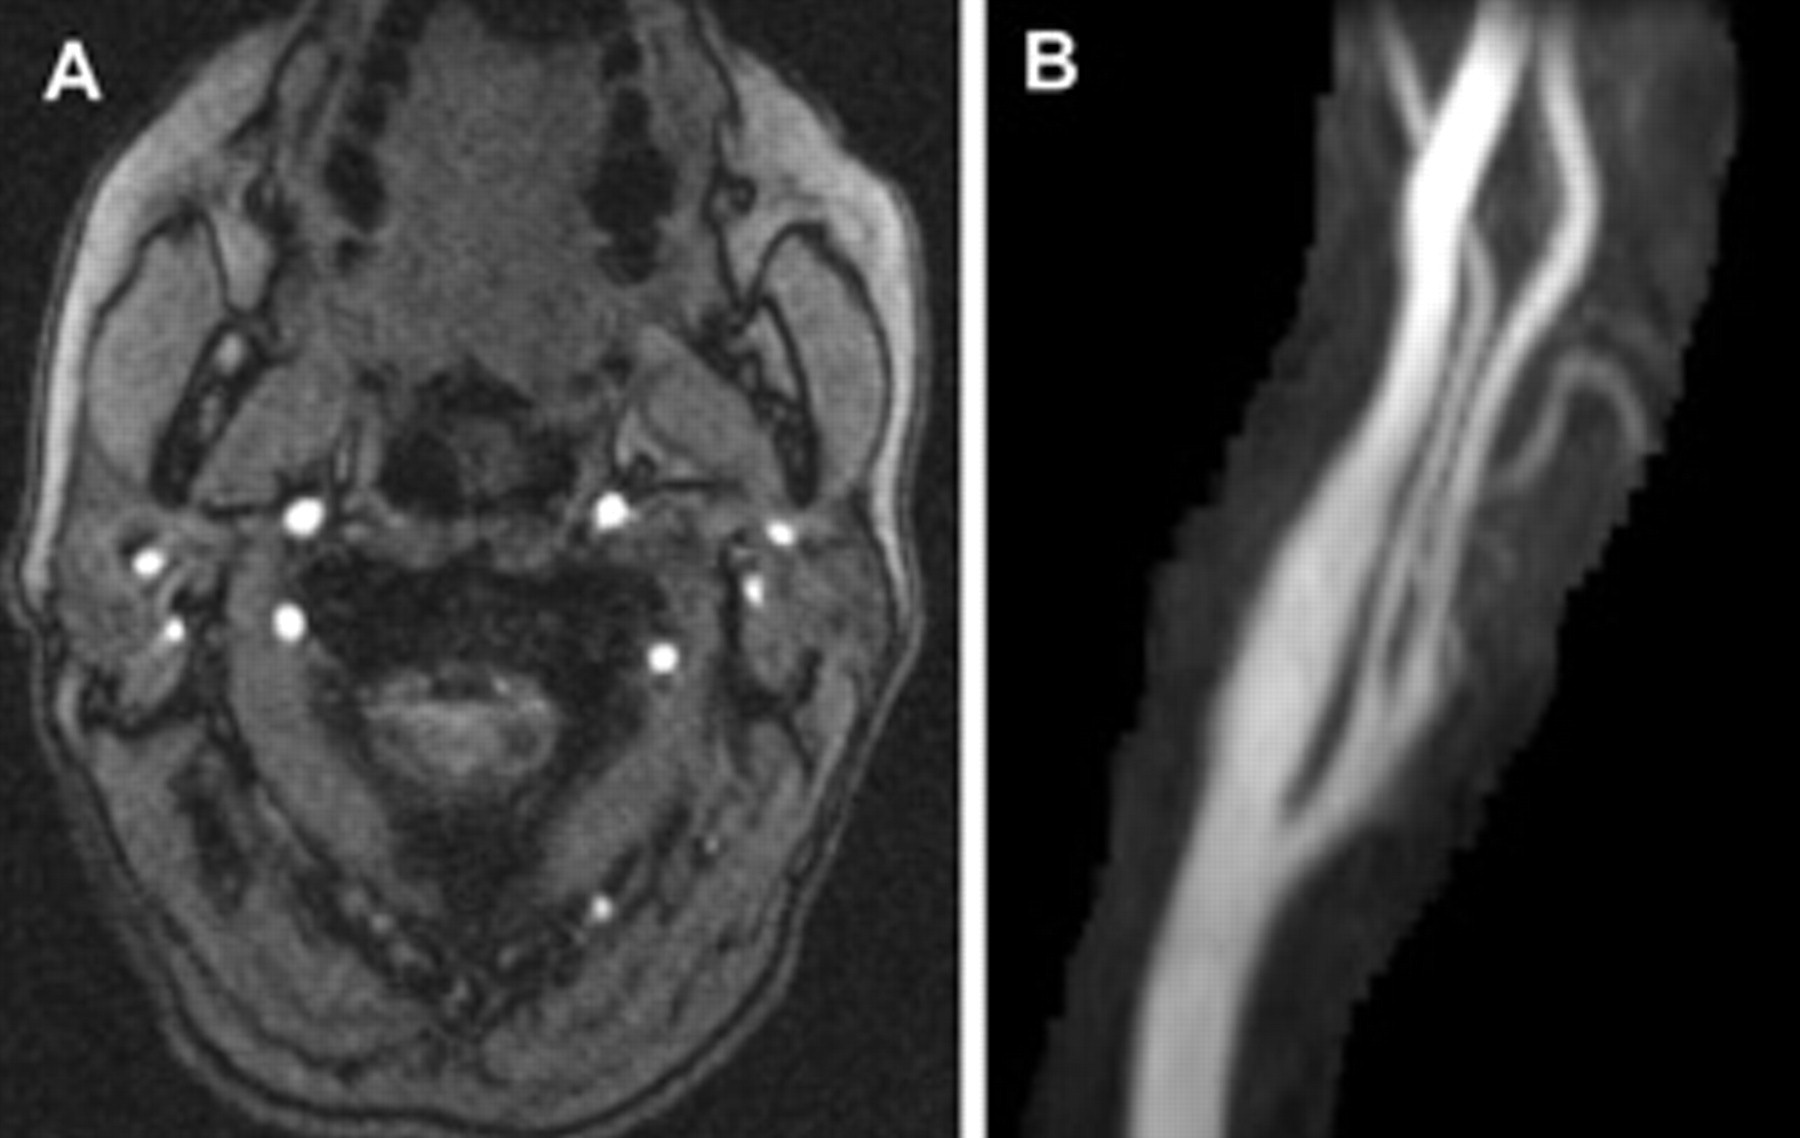
Two-dimensional time-of-flight magnetic resonance angiogram of the carotid and vertebral arteries. The source data (A) acquired in the axial plane are on the left, and a coronal oblique maximum intensity projection image (B) of a normal left carotid bifurcation is on the right.
TOF-MRA is hampered by flow voids or low signal intensity regions intravascularly. Flow voids can be caused by in-plane saturation, which occurs when a blood vessel travels in the same plane as the imaging slice, thereby saturating the aortic blood, and also by post-stenotic turbulence distal to a stenosis, which accelerates the phase dispersion. 7 TOF-MRA can also exaggerate the length of occlusion and stenosis. 8 Another problem with TOF-MRA is long imaging times (minutes to hours depending on the distance covered and patient cooperation) owing to the necessity of saturation pulses orienting the imaging slice perpendicular to the blood flow. 4 With parallel imaging techniques (an innovative way of filling k-space), imaging time can be reduced, but this requires special RF receiver coils. TOF-MRA may be performed using two- and three-dimensional techniques and is still used as an essential component of neurovascular imaging because it is very sensitive to flow and can be performed with very high resolution. Like the other MRA techniques, it is sensitive to artifacts from metallic stents and other devices.
Phase Contrast MRA
Phase contrast magnetic resonance angiography (PC-MRA) also involves exploiting the motion of blood, although it is not limited by the in-plane flow voids that plague TOF-MRA. 9 PC-MRA involves using a bipolar flow-encoding gradient, which is basically a magnetic field gradient that reverses directions at the midpoint. This bipolar gradient will induce a velocity-dependent phase shift in moving systems but no phase shift in stationary ones. 10 During PC-MRA, two images are obtained immediately after each other, typically using opposite bipolar gradients, which will induce opposite phase shifts in the moving blood data (Figure 7). The images are subtracted from each other, which amplifies the signal from vascular tissue flow in which the subtraction of opposite phase shifts results in an addition. An alternate implementation of PC-MRA acquires two sets of images in which one set has a flow-encoding gradient, whereas the second set has no flow-encoding gradient (also known as a reference image).
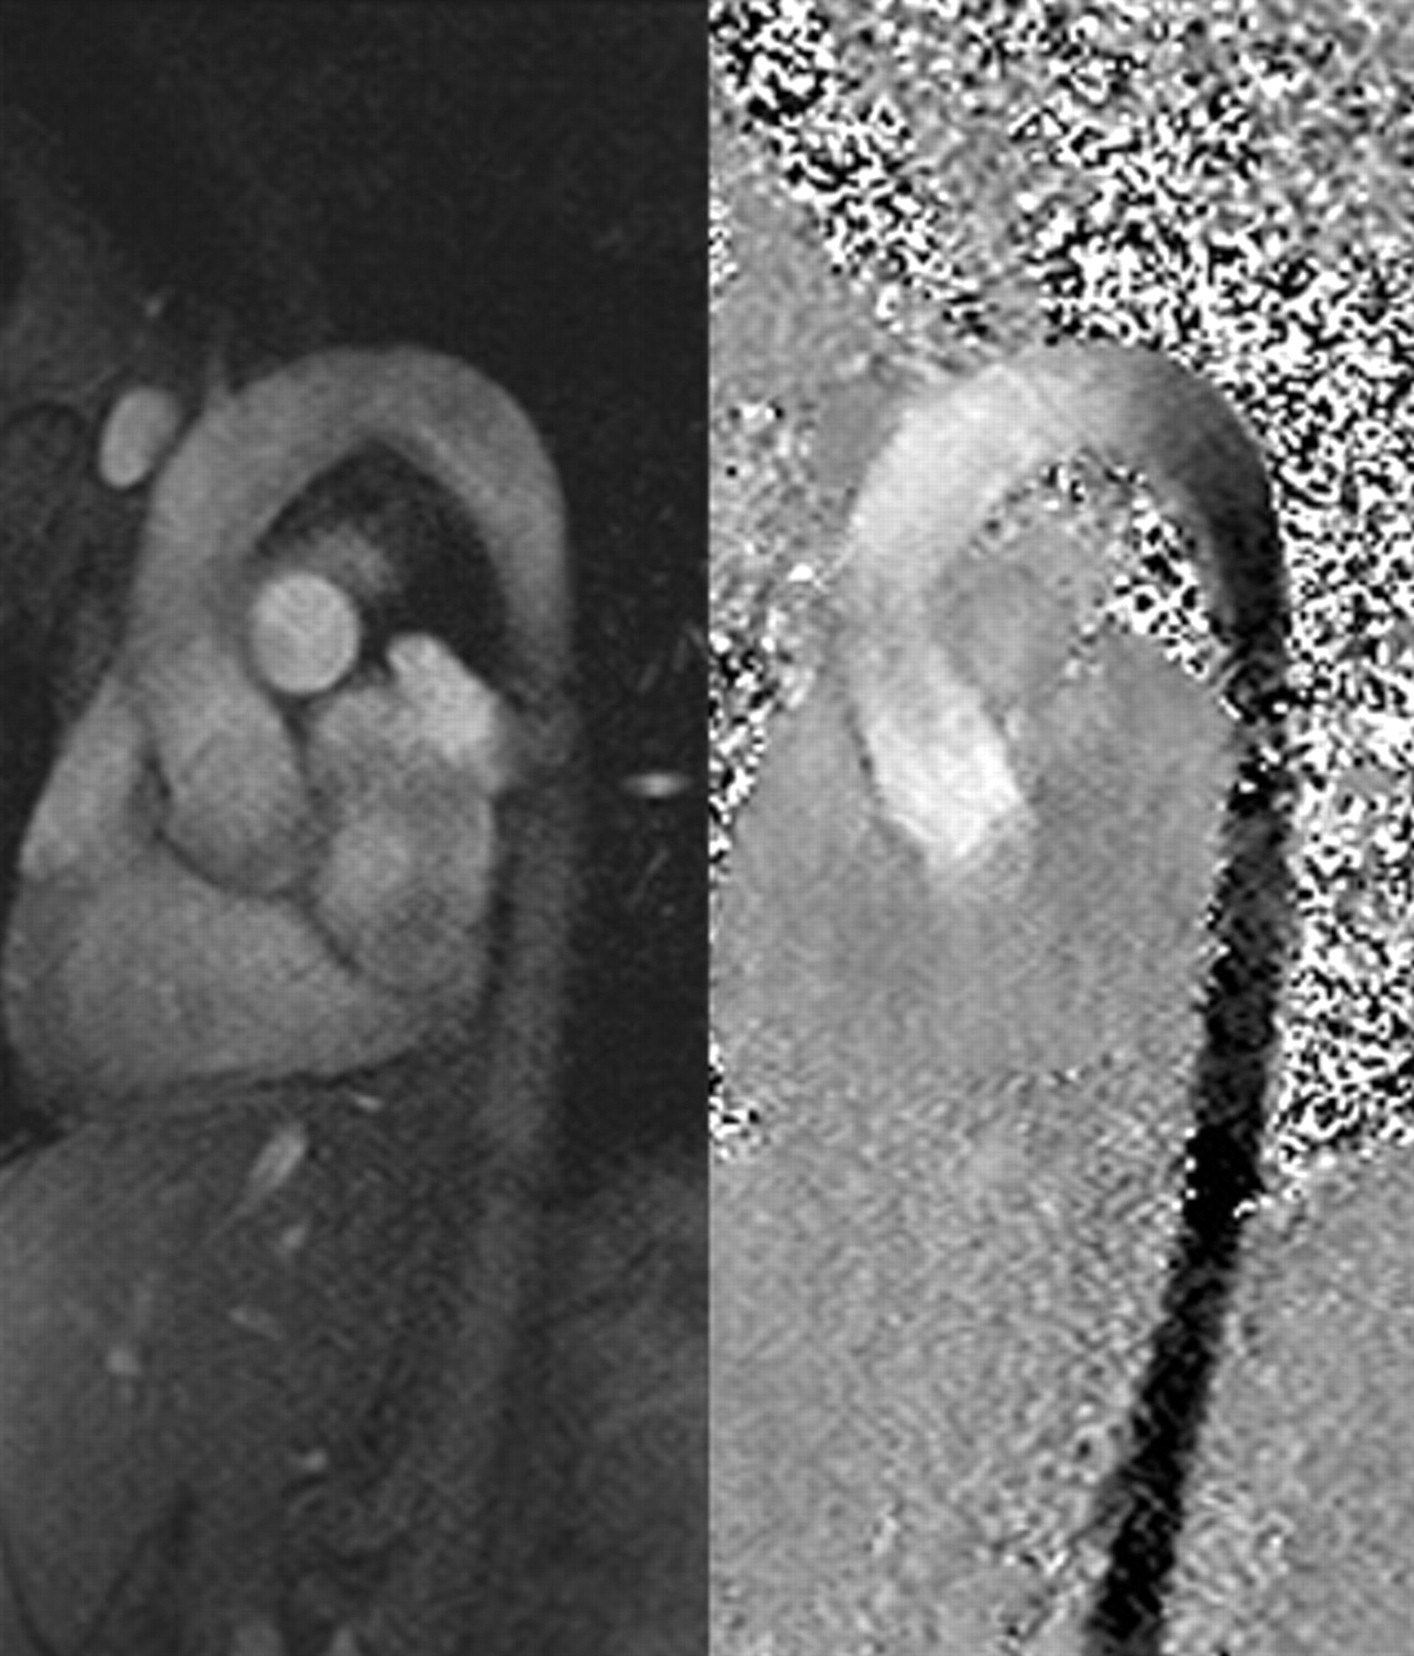
Magnitude (left) and phase (right) images of a phase contrast magnetic resonance imaging study of the aortic arch. The flow-encoding gradients encode for flow in the superior-inferior direction, with flow in the superior direction being bright and that in the inferior direction appearing dark. Also note the variation in color, which is an indicator of the change in velocity.
The magnitude and duration of the flow-encoding gradient determine the maximum velocity that can be encoded for over a phase range of −180° to +180°. This maximum velocity is known as VENC (or encoding velocity), and if this value is not chosen correctly, flow velocities greater than this value can generate an aliasing artifact owing to the phase aliasing over the −180° to 180° range. When the VENC is chosen correctly, the phase shift is proportional to the velocity of the blood and can be used to determine the velocity of the blood. 11 It should also be noted that PC-MRA can be used to encode for flow both parallel and perpendicular to the imaging slice and that many postprocessing techniques use the complex data from the PC-MRA images to determine velocity and volume flow rate in the blood vessels. 11 This technique is particularly useful when flow and velocity information is needed, as in cardiac and thoracic aorta imaging.
Balanced Steady-State Free Precession
Balanced steady-state free precession (bSSFP) imaging (also known as TrueFISP or FIESTA) is a bright-blood technique that is fast and provides an extremely high signal to noise ratio. bSSFP imaging can be employed for a variety of applications, including cardiac, thoracic aorta, and renal MRA (Figure 8). Although bSSFP is very fast and can provide an extremely high signal to noise ratio, there is a very bright fat signal, which can interfere with the signal from the blood. 4 This can be countered by using fat saturation techniques or a contrast agent (negating its usual noninvasive nature). 12 Also, this technique is more sensitive to off-resonance effects arising owing to local variations in magnetic field homogeneity, and this is seen by the generation of dark bands (also known as the banding artifact). This artifact can be reduced by minimizing the off-resonance by shimming the scanner (ie, making the magnetic field more homogeneous in a volume surrounding the region of interest); alternatively, the dark bands can be moved away from the region of interest by shifting the center frequency of the scanner. One current application of bSSFP imaging is in the depiction of aneurysms. A bSSFP image can differentiate between luminal blood and thrombus. 4
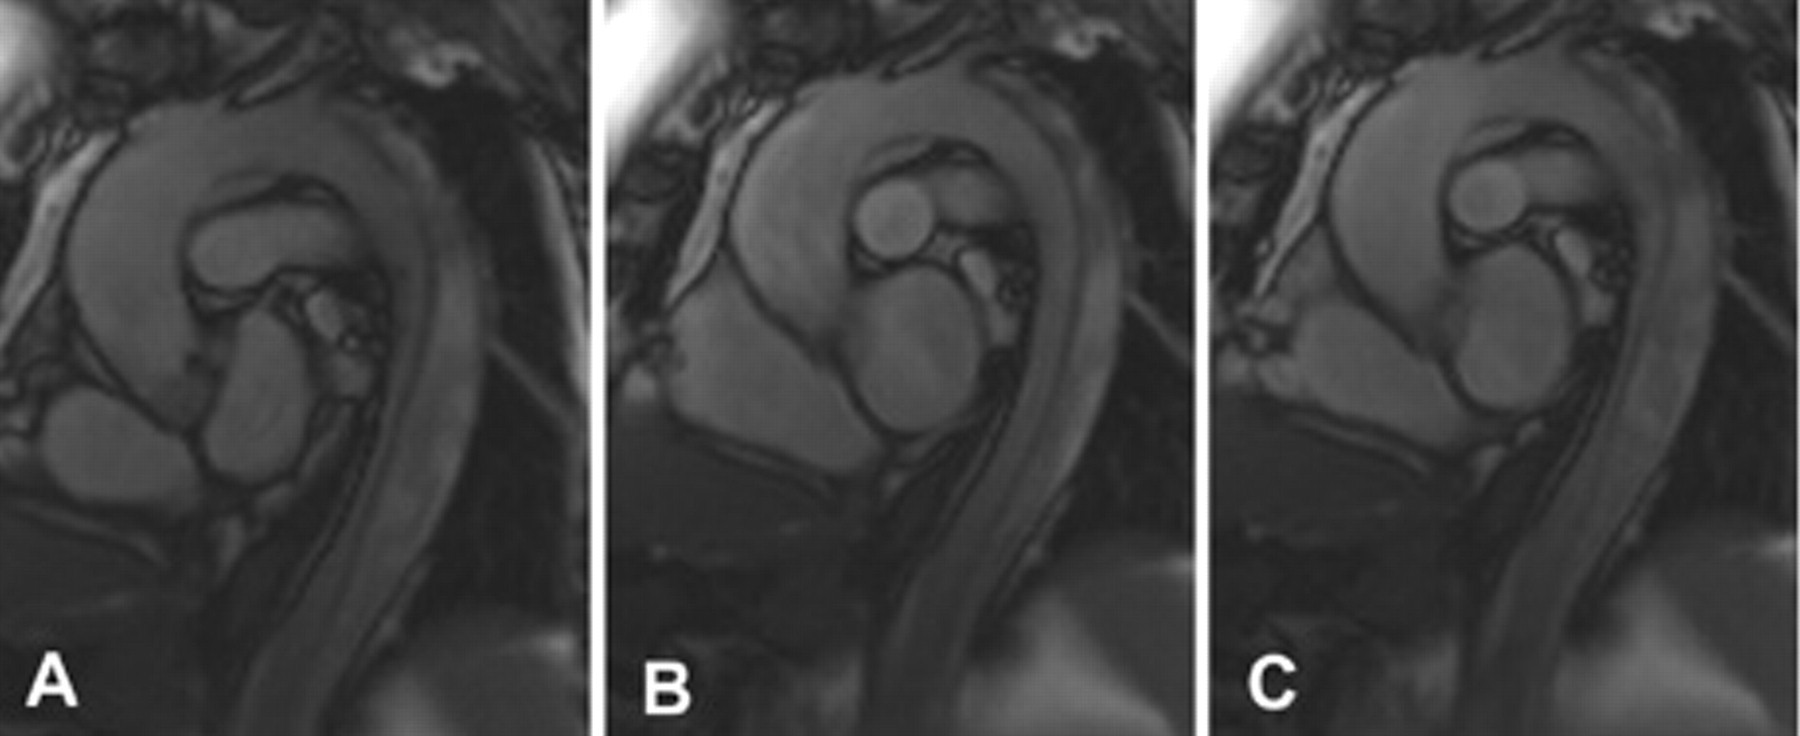
Selected sagittal oblique electrocardiography-gated cine axial balanced steady-state free precession images of the thoracic aorta in (A) systole and (B) early and (C) late diastole demonstrating a type B aortic dissection and mobility of the dissection flap. These images are typically viewed in a cine loop.
Three-Dimensional Half-Fourier Fast Spin Echo MRA
Three-dimensional half-Fourier fast spin echo MRA involves the use of additional RF pulses for refocusing the echo to generate the signal rather than magnetic field gradients, as in PC-MRA and bSSFP. Acquisition of images is synchronized with the cardiac cycle to obtain images in systole and diastole. 13 The imaging delay time is determined after the acquisition of a series of preparatory scans, which vary the delay time to determine the best configuration. 13
For fast-flow vessels, the arteries are dark (low signal) in systole owing to a flow void in which blood travels out of the imaging slice before it can receive the totality of necessary pulses to produce a signal, whereas the veins appear bright (high signal) because the flow is not fast enough to produce this flow void. 13 In diastole, both the arteries and the veins produce a strong signal and are bright. 14 Hence, the systole images can be subtracted from the diastole images to produce the arterial images.
For slow-flow and peripheral vessels, both arteries and veins produce a signal in both systole and diastole. 4 Consequently, a flow-spoiling magnetic gradient pulse is applied that causes the blood in the arteries to dephase or become a flow void during systole, therefore giving no signal. 14 Again, the systolic phase images are subtracted from the diastole images to give the arterial images.
This is not widely used as there are many technical challenges that need to be overcome, and few clinical studies have supported its generalized utility.
In Practice
Diagnostic Accuracy
In the imaging of the abdominal aorta, ceMRA has an accuracy similar to that of conventional digital subtraction angiography (DSA). 15 A review article of five ceMRA assessments of symptomatic peripheral arterial disease found that all reported sensitivities and specificities greater than 90% when compared with DSA, and one study reported 100% sensitivity and specificity compared with DSA. 4 One study on ceMRA in the grading of body artery stenosis found that for detection of stenosis greater than 50% in the common and external iliac and left and right internal carotid arteries, ceMRA had on-site sensitivity and specificity no lower than 95% and 94%, respectively, when compared with DSA. 16
A recent study of the diagnostic accuracy of ceMRA in carotid stenosis found that ceMRA had a specificity of 80.6% and a sensitivity of 93.0%. Although these numbers mean that DSA is still the gold standard, the ceMRA clinical misclassification rate is only 15%, and only in 6% of the total cases would this misclassification have changed the course of treatment, a number that is low enough to warrant its use in place of DSA. 17 One of the biggest problems in the diagnostic accuracy of ceMRA is the overestimation of stenosis. 17,18 Another study using ceMRA for endograft sizing as opposed to computed tomography (CT) found that using only ceMRA to size the endograft resulted in clinical equipoise compared with that of CT. 19 Using a peripheral vascular coil, separate calf and pelvis acquisitions, and a moving-table technique (“scoot-and-shoot”), the ceMRA detection of stenosis of more than 50% in the lower extremities had specificity, sensitivity, and accuracy all of 95%. 20 An earlier meta-analysis examining lower extremity disease using ceMRA concluded that three-dimensional ceMRA was accurate in examining stenosis greater than 50% of the lower extremities, with a sensitivity and specificity of 94%. 18
The Future
Although ceMRA is a highly accurate technique and has gained wide acceptance, it would be preferential to attempt a move toward completely noninvasive MRA if a suitable method can be found with comparable image quality and accuracy. A consideration in ceMRA is the use of gadolinium contrast agents. A number of recent studies have suggested that gadolinium contrast agents may play a role in nephrogenic systemic fibrosis in patients with renal disease. 21–25 In fact, for patients with advanced kidney failure, the FDA suggests using gadolinium contrast agents only if necessary, and even then recommends dialysis soon after the MRA. 25 Future work with ceMRA may involve finding safer contrast agents.
MRI provides excellent anatomic imaging, but it also has the potential to provide functional, nonanatomic information on blood velocity, flow pattern, and flow volume. 26 Three-dimensional (two-dimensional in space and one-dimensional in time) and four-dimensional cine MRA (three-dimensional in space and one-dimensional in time) are general techniques that are synchronized with an electrocardiogram and involve taking a rapid series of temporally equally spaced images, with portions of each image being acquired over multiple cardiac cycles. In the literature, cine PC-MRA has been used to determine the spatial distribution of blood flow velocities and to calculate flow rates and shear stresses in the abdominal aorta. 27 Another advantage of four-dimensional PC-MRA is that it can obtain complete spatial and temporal coverage of a desired volume. 28 The four-dimensional MRA technique has also been used to examine flow dynamics and pulsatile blood flow in the recipients of valve-sparing aortic root replacement. 29 Our own group has proposed the potential usefulness of cine MRA in the sizing of endografts in abdominal aortic aneurysm repair. 30,31 Given that the aortic diameter fluctuates over the duration of the cardiac cycle, cine MRA is attractive because it can demonstrate aortic pulsatility pre- and postoperatively and may improve sizing and eventual endograft design. Furthermore, we have used cine MRA to resolve important physical parameters of the aorta, including stiffness and elastic modulus, and to document the effect that aneurysm exclusion has on these variables. 31 Improvements to temporal and spacial resolution of cine PC-MRA may be accomplished in the future through improvements in the design of the pulse sequences. 32
In conclusion, we have sought to provide the reader with a basic introduction to the physics behind MRA information acquisition and imaging, and we hope that this information helps contribute to the physician's general understanding of the MRA technique.
Footnotes
The project described was supported by National Institutes of Health grant number K08HL079927 from the National Heart, Lung, and Blood Institute.