
Abstract
Objective:
To characterize glymphatic- and cerebrospinal fluid (CSF)-related imaging alterations in moderate-to-advanced, deep brain stimulation (DBS)-eligible Parkinson’s disease (PD) using a multidimensional magnetic resonance imaging (MRI) framework.
Methods:
We studied 60 moderate-to-advanced, DBS-eligible patients with PD and 30 frequency-matched healthy controls with 3.0 T MRI. The “Source-Dynamics-Function-Structure” framework integrated choroid plexus volume fraction, C1–C2 phase-contrast MRI, diffusion tensor image analysis along the perivascular space index, and perivascular space volumetry. Multivariable analyses were used to examine associations between imaging biomarkers and motor severity, anxiety, and sleep quality.
Results:
Patients with PD showed reduced diffusion tensor image analysis along the perivascular space index, a nominal increase in choroid plexus volume fraction, and a low-net-flow CSF pattern with nominal evidence of increased reflux and marked spatial heterogeneity, despite preserved gross perivascular morphology. Ventral CSF dynamics showed significant partial correlations with motor severity, whereas selected dorsal flow metrics remained significantly associated with anxiety severity in covariate-adjusted regression analyses. The combined logistic model showed modest diagnostic performance (area under the curve = 0.686), with the highest area under the curve numerically but no statistically significant advantage over individual imaging metrics in paired DeLong comparisons.
Conclusion:
This framework provides an exploratory neuroimaging reference for moderate-to-advanced, DBS-eligible PD and may support future validation studies and DBS-related investigations.
Keywords
1 Introduction
Parkinson’s disease (PD) is characterized by the progressive degeneration of dopaminergic neurons in the substantia nigra pars compacta and the pathological aggregation of α-synuclein[1, 2]. Current treatments, such as dopamine replacement and deep brain stimulation (DBS), provide mainly symptomatic relief and do not modify the underlying disease process or halt prion-like protein propagation[3, 4]. Accumulating evidence indicates that a homeostatic imbalance in the production and clearance of central nervous system (CNS) macromolecules fundamentally drives this neurotoxic protein aggregation[5, 6].
The glymphatic system (GS) serves as the principal CNS pathway for clearing toxic metabolic waste, including α-synuclein. Its microscale solute exchange is intricately coupled to macroscopic cerebrospinal fluid (CSF) hydrodynamics under physiological conditions[7, 8]. Our prior phase- contrast magnetic resonance imaging (PC-MRI) studies mapped the physiological baseline of craniospinal CSF circulation and identified distinct ventral and dorsal flow patterns within the spinal subarachnoid space. The present study addresses a critical gap in understanding how PD-specific pathology alters these macroscopic hydrodynamics and thereby impairs microscale GS clearance. Previous investigations have often relied on isolated metrics, such as the diffusion tensor image analysis along the perivascular space (DTI-ALPS) index or perivascular space (PVS) morphology, resulting in an incomplete understanding of the GS-CSF hydrodynamic coupling mechanism in PD[9, 10].
Addressing the limitations of single-metric evaluations, we hypothesize that PD pathology manifests not only as diminished microscale glymphatic clearance but also as a macroscopic craniospinal CSF hydrodynamic imbalance, where the latter may contribute to glymphatic impairment[11]. To test this hypothesis, we developed a multidimensional MRI evaluation framework integrating four axes: source [choroid plexus volume fraction (CPV)], dynamics (CSF hydrodynamics), function (DTI-ALPS index), and structure (PVS volumetry). This framework enables an integrated analysis of CSF production, driving force, parenchymal exchange, and drainage. Using a prospective case-control design, this study systematically evaluates multidimensional imaging alterations in a moderate-to-advanced, DBS-eligible PD cohort and examines their associations with motor severity and selected non-motor phenotypes, including anxiety, sleep quality, and exploratory cognitive measures[9]. Importantly, the present study should not be interpreted as defining a universal pathophysiological baseline across the full PD spectrum. Rather, it focuses on a clinically relevant DBS-eligible subgroup. Prior PD glymphatic- or CSF-related imaging studies have more commonly examined isolated markers or single physiological dimensions. The incremental contribution of the present work therefore lies in evaluating source-, dynamics-, function-, and structure-related MRI measures within the same cohort, and in identifying a spatially differentiated ventral- dorsal imaging pattern that maps onto distinct clinical dimensions in this DBS-eligible PD population. This framework may also provide an exploratory quantitative imaging reference for future validation studies and for the evaluation of DBS-related neuromodulatory effects[12].
2 Methods
2.1 Participants and Study Design
This prospective case-control study enrolled patients with PD admitted to the Department of Neurosurgery, Yuquan Hospital, Tsinghua University, between September 2023 and
December 2025. This study was approved by the Institutional Review Board and Ethics Committee of Tsinghua University Yuquan Hospital (Approval No. 2024KY014). Concurrently, we recruited healthy controls (HCs) who were frequency matched to the PD group at the group level for age and sex, rather than individually matched on a 1 : 1 basis. All participants in both groups had an educational level of junior high school or above.
The inclusion criteria for PD participants were: (1) age 45–75 years; (2) diagnosis of idiopathic PD according to Movement Disorder Society criteria, with a disease duration ≥ 5 years; (3) a Movement Disorder Society–Unified Parkinson’s Disease Rating Scale (MDS-UPDRS) Part III score ≥ 30 in the medication “OFF” state and Hoehn–Yahr stage ≥ 2.5; and (4) clinical eligibility for DBS surgery. Exclusion criteria included atypical or secondary parkinsonism, structural brain lesions impeding CSF flow (e.g., severe hydrocephalus, extensive infarction, severe spinal stenosis), significant systemic comorbidities, implanted pacemakers or defibrillators, and severe cognitive or psychiatric disorders precluding MRI or clinical assessment [Montreal Cognitive Assessment (MoCA) score < 10]. HCs were required to exhibit normal neurological and cognitive function, with no history of neuropsychiatric disorders, significant sleep disturbances (e.g., obstructive sleep apnea), or structural brain abnormalities on MRI. All participants provided written informed consent.
Standardized sample size calculations for neuroimaging evaluations of the GS remain challenging owing to methodological heterogeneity. Although classic neuroimaging literature suggests a minimum of 12–16 participants for basic statistical power[13, 14], prior studies in related glymphatic- and neuroimaging contexts have typically used sample sizes within a broadly comparable range for exploratory imaging analyses[15-17]. According to this empirical and feasibility-oriented rationale, and considering anticipated effect sizes and potential attrition, we recruited 60 patients with PD and 30 frequency-matched HCs for this investigation (Figure 1A).

Study design and multidimensional “Source-Dynamics-Function-Structure” MRI framework. (A) Flowchart of participant enrollment and assessments. The study included 60 moderate-to-advanced, DBS-eligible patients with Parkinson’s disease (PD) and 30 frequency-matched healthy controls (HCs). PD assessments were performed in the practically defined medication “OFF” state. (B) The MRI framework integrates four dimensions of glymphatic- and CSF-related pathophysiology: source (CPV), dynamics (C1–C2 PC-MRI), function (DTI-ALPS), and structure (PVSVF from T2-weighted imaging). CPV and PVSVF are reported as scaled ratios (×10-3).
2.2 Clinical and Neurocognitive Assessments
Clinical evaluations for all patients with PD were performed in the practically defined medication “OFF” state to establish baseline disease severity. Motor symptoms were quantified using the MDS-UPDRS Part III and Hoehn–Yahr staging. We assessed non-motor symptoms and quality of life with the Non-Motor Symptoms Scale, Parkinson’s Disease Sleep Scale (PDSS), and Parkinson’s Disease Questionnaire-39. Cognitive and psychiatric profiles were measured using the MoCA, Mini-Mental State Examination (MMSE), Hamilton Depression Rating Scale, and Hamilton Anxiety Rating Scale (HAMA). Certified specialists conducted these assessments, and critical ratings, such as the MDS-UPDRS, were averaged across up to three independent evaluators to enhance reliability.
2.3 MRI Acquisition
Multimodal MRI data were acquired on a 3.0 T system (Achieva, Philips, the Netherlands) equipped with a 32-channel phased-array head coil. To minimize motion artifacts, the head was immobilized with foam pads, and participants were instructed to remain still and awake with their eyes were closed. The imaging protocol included: (1) 3D T1-weighted imaging [repetition time/echo time (TR/TE) = 7.6/3.7 ms, resolution = 1 mm × 1 mm × 2 mm]; (2) T2-weighted imaging (TR/TE = 5,000/339 ms, field of view = 230 mm × 211 mm × 180 mm, acquired resolution = 0.8 mm × 0.8 mm × 1.5 mm); (3) neurite orientation dispersion and density imaging (TR/TE = 5,558/69 ms, resolution = 2.95 mm × 2.95 mm × 3 mm); and (4) PC-MRI (TR/TE = 13/8.6 ms, resolution = 0.8 mm × 0.8 mm × 8 mm.
2.4 Image Processing and Metric Quantification
A multidimensional imaging framework for evaluating the “Source-Dynamics-Function- Structure” of the GS and CSF circulation was implemented using MATLAB R2022b (The MathWorks Inc., Natick, MA, USA), Advanced Normalization Tools (ANTs; Penn Image Computing and Science Laboratory, University of Pennsylvania, Philadelphia, PA, USA), FMRIB Software Library (FSL; FMRIB Analysis Group, University of Oxford, Oxford, UK), Quantitative Imaging Toolkit (QIT), FreeSurfer (Athinoula A. Martinos Center for Biomedical Imaging, Massachusetts General Hospital, Harvard Medical School, Boston, MA, USA), and Statistical Parametric Mapping 12 (SPM12; Wellcome Centre for Human Neuroimaging, University College London, London, UK)(Figure 1B). All image- processing steps were performed according to predefined pipelines to reduce operator-dependent variability.
2.4.1 Choroid Plexus Volume Fraction (Source)
CPV was quantified using a pre-trained 3D U-Net convolutional neural network. T1-weighted images were non-linearly registered to the Montreal Neurological Institute–152 space template via ANTs. This deep learning model, whose per- formance is comparable to manual segmentation, automatically generated choroid plexus masks in standard space for subsequent volume calculation[18]. The CPV was then calculated as the ratio of segmented choroid plexus volume to intracranial volume using the predefined automated pipeline. CPV values are reported as scaled ratios (×10-3).
2.4.2 CSF Hydrodynamics (Dynamics)
PC-MRI data were processed using Philips Q-Flow software. After applying background phase correction to minimize stationary tissue offset, the region of interest (ROI) was consistently placed at the atlantoaxial (C1–C2) level according to predefined anatomical landmarks. Ventral and dorsal ROIs were delineated on the corresponding magnitude and phase images within the visible CSF space at the same anatomical slice, while avoiding adjacent vascular, osseous, and non-CSF soft-tissue structures as far as possible within the standardized workflow. This anatomical level was selected as the optimal standardized cross-section because it is minimally susceptible to respiratory artifacts and serves as the critical biomechanical nexus between cranial and spinal CSF compartments. Hydrodynamic parameters were extracted over a cardiac cycle synchronized via peripheral pulse gating. These parameters included net flow, antegrade flow, retrograde flow, stroke volume, reflux fraction, stroke distance, and velocity-based measures (mean, peak, maximum, and minimum velocity). Reverse- direction volumetric flow measures are reported as retrograde flow (mL/beat), whereas reflux fraction is reported separately as a percentage- based descriptor of reverse-direction oscillatory flow.
2.4.3 DTI-ALPS Index (Function)
The DTI-ALPS index was computed from tensor-derived diffusivity maps reconstructed from the multi-shell diffusion/neurite orientation dispersion and density imaging acquisition. On color-coded fractional anisotropy (FA) maps, 5-mm spherical ROIs were positioned within the projection and association fiber tracts adjacent to the lateral ventricular bodies using DTI-Studio, with ROI placement guided by standardized anatomical landmarks. ROIs were placed in regions visually corresponding to the projection and association fibers on color FA maps while avoiding ventricular margins, visible lesions, and areas with obvious partial-volume contamination as far as possible within the predefined workflow. Diffusivities along the x-axis (perpendicular to major fibers, corresponding to the PVS orientation), y-axis, and z-axis were extracted. The ALPS index was computed as the ratio of the mean x-axis diffusivity to the mean orthogonal diffusivities across both fiber tracts, averaged bilaterally[19], and ROI placement was reviewed for anatomical plausibility by an experienced neuroradiologist to reduce operator-dependent variability. ROI placement followed predefined anatomical landmarks to improve consistency across participants. Mathematically, it was calculated as follows:

where Dxx, Dyy, and Dzz represent the diffusivities along the x, y, and z axes, respectively; the subscripts proj and assoc denote the projection and association fiber tracts, respectively.
2.4.4 PVS Volume (Structure)
PVS volume fractions (PVSVFs) in the basal ganglia, white matter, and whole brain were automatically segmented from T2-weighted images using SPM12 and the CAT12 toolbox. T2-weighted images were used for PVSVF quantification because PVS is more conspicuous on T2-weighted contrast images, whereas T1-weighted images were used for choroid plexus segmentation and intracranial volume normalization rather than for PVS extraction. After spatial normalization to diffeomorphic anatomical registration through exponentiated lie algebra Montreal Neurological Institute–152 space and adaptive non-local means denoising, a Frangi filter was applied to enhance and extract tubular PVS-like structures. The PVSVF was then calculated as the ratio of the segmented PVS volume to the corresponding regional brain tissue volume within the predefined anatomical region, using a predefined automated pipeline to minimize operator-dependent variability and improve processing consistency across participants. PVSVF values are reported as scaled ratios (×10-3).
2.4.5 Measurement Standardization and Quality Control
Imaging measurements and processing steps were performed according to predefined anatomical landmarks and standardized workflows to improve consistency across participants. Initial ROI placement for both PC-MRI and DTI-ALPS was performed without knowledge of whether a participant belonged to the PD or HC group. For PC-MRI, measurements were obtained on the same predefined axial slice at the atlantoaxial (C1–C2) level, selected using consistent anatomical landmarks on the magnitude images. Ventral and dorsal ROIs were delineated within the visible CSF space on the corresponding magnitude and phase images while avoiding adjacent vascular, osseous, and non-CSF soft-tissue structures to the extent possible. ROI placement was restricted to the visible CSF space on the same predefined slice in all participants, and no participant-specific slice shifting was allowed once the target atlantoaxial level had been selected. Cases with substantial motion artifacts or inadequate visualization of the target CSF compartment were considered unsuitable for metric-specific analysis.
For DTI-ALPS, bilateral 5-mm spherical ROIs were placed in regions visually corresponding to the projection and association fiber tracts adjacent to the lateral ventricular bodies on color- coded FA maps, using predefined anatomical landmarks and a fixed ROI size. ROI placement avoided ventricular margins, visible lesions, and areas with obvious partial-volume contamination to the extent possible. The same fixed ROI size and landmark-guided placement strategy were used across all participants, and anatomically implausible placements were corrected during expert review. DTI-ALPS ROI placement was additionally subjected to independent expert review for anatomical plausibility by an experienced neuroradiologist.
For PVSVF, a predefined automated processing pipeline, including spatial normalization, denoising, and Frangi filter–based tubular structure extraction, was used to reduce operator- dependent variability and improve consistency across participants.
These procedures were prospectively designed to improve methodological consistency and reduce avoidable measurement variability. However, they should not be interpreted as a substitute for formal reproducibility validation. Formal repeated measurement analyses and intra-/inter-rater reproducibility testing were not performed in the present study; therefore, measurement reliability was not formally established and should be addressed in future validation work.
2.5 Statistical Analysis
Statistical analyses were performed using IBM SPSS Statistics version 27.0 (IBM Corp., Armonk, NY, USA). All statistical analyses were two-sided, and a nominal significance threshold of p < 0.05 was used unless otherwise specified. Continuous variables were assessed for distributional characteristics using the Shapiro–Wilk test and are presented as mean ± standard deviation or median (interquartile range), as appropriate for descriptive purposes. Categorical variables are presented as counts and percentages. Baseline continuous variables were compared using independent-samples t-tests or Mann–Whitney U tests, as appropriate, and categorical variables were compared using Chi-square tests.
For the primary case–control imaging analyses, quantitative MRI metrics were compared between the PD and HC groups using analysis of covariance (ANCOVA), with age and sex included as covariates. To preserve a consistent inferential framework across imaging domains, group effects for imaging variables were derived from covariate-adjusted ANCOVA models, whereas descriptive summaries are reported according to the observed distribution of each variable. Before interpretation, model residuals were examined for approximate normality and homoscedasticity.
To control for multiplicity while preserving the structure of the predefined hypotheses, Benjamini–Hochberg false discovery rate (FDR) correction was applied separately within each prespecified family of comparisons. For the primary between-group imaging analysis presented in Table 2, q values were calculated across the 11 predefined imaging metrics. Secondary PC-MRI-derived flow measures not included in the primary comparison set were analyzed as exploratory outcomes and are reported in Supplementary Table S1; where applicable, q values for these secondary measures were calculated within a separate exploratory multiple comparison framework.
Associations between imaging biomarkers and clinical phenotypes within the PD group were restricted to prespecified biomarker– phenotype pairs selected a priori on the basis of the study hypothesis and physiological prioritization. Age-, sex-, and disease duration- adjusted Spearman partial correlations were first used to characterize the direction and strength of these prespecified associations. Covariate-adjusted linear regression models were then fitted as complementary model-based analyses, with age, sex, and disease duration entered as covariates and one imaging biomarker entered per model. FDR correction was applied separately to the partial correlation analyses and to the regression- based analyses shown in Table 3. For these analyses, q < 0.05 was considered statistically significant.
Secondary exploratory analyses, including MMSE-related associations and additional PC-MRI-derived parameters, are reported in the Supplementary Material and should be interpreted as supportive rather than confirmatory.
Diagnostic performance was evaluated in the full study sample using receiver operating characteristic analyses for individual imaging biomarkers, and for a multivariable logistic regression model integrating the four dimensions of the proposed framework. Areas under the curve (AUCs) were compared using paired DeLong tests. To assess collinearity among predictors included in the final diagnostic model, variance inflation factors (VIFs) and tolerance values were examined. Internal validation of the combined model was performed using bootstrap resampling (1,000 resamples), and model performance was summarized using apparent and optimism- corrected AUCs and Brier scores, together with bootstrap-derived calibration slopes and calibration intercepts.
3 Results
3.1 Demographic and Clinical Characteristics
A total of 60 patients with PD and 30 frequency- matched HCs were enrolled, with their baseline characteristics summarized in Table 1. The PD and HC groups were well matched for age (62.03 ± 8.08 vs. 62.73 ± 4.95 years, p = 0.665) and sex (men/women: 26/34 vs. 16/14, p = 0.370). All participants in both groups had an education level of junior high school or above. Within the PD cohort, the median disease duration was 9 years, and 58/60 patients (96.7%) were classified as Hoehn–Yahr stage 3. Assessed in the practically defined “OFF” medication state, patients exhibited a mean MDS-UPDRS Part III score of 52.69 ± 9.55, indicating substantial motor impairment. Further clinical evaluations revealed moderate-to-severe impacts on quality of life (median Parkinson’s Disease Questionnaire-39 score = 84.00) and sleep quality (median PDSS score = 80.00), whereas cognitive function, as measured by the MoCA, was at the boundary of mild cognitive impairment (median score = 25.00).
Demographic characteristics of the study participants.

Education level was not statistically tested because all participants in both groups were junior high school or above.
3.2 Multidimensional Imaging Alterations in PD
Group differences across the “Source-Dynamics- Function-Structure” imaging axes were analyzed via ANCOVA, with age and sex included as covariates (Table 2, Figure 2). Patients with PD exhibited FDR-significant alterations in microscopic clearance and ventral net flow, whereas CPV and other ventral hydrodynamic measures showed only nominal between-group differences that did not remain significant after FDR correction. By contrast, gross PVS morphometry did not differ significantly between the groups.
Comparison of multimodal MRI metrics between patients with PD and HCs.

Notes: Data are presented as median (interquartile range) for variables marked with superscript a and as mean ± standard deviation for variables marked with superscript b. Group comparisons were performed using analysis of covariance (ANCOVA), with age and sex included as covariates. The reported F and p values correspond to the group effect in the ANCOVA model. q values represent Benjamini–Hochberg false discovery rate-adjusted P values across the 11 imaging metrics. Bold values indicate statistically significant FDR-adjusted q values (q < 0.05). CPV and PVSVF values are reported as scaled ratios (×10-3).
Abbreviations: ALL, all brain regions; BG, basal ganglia; CPV, choroid plexus volume fraction; DTI-ALPS, diffusion tensor image analysis along the perivascular space; HC, healthy control; MRI, magnetic resonance imaging; PD, Parkinson’s disease; PVSVF, perivascular space volume fraction; WM, white matter.

Multidimensional imaging alterations across the “Source-Dynamics-Function-Structure” axes in Parkinson’s disease. (A) Source (CPV): CPV showed a nominal increase in patients with PD relative to healthy controls (P = 0.021, q = 0.076). (B) Dynamics (CSF Hydrodynamics): Panel B displays ventral net flow at the C1–C2 level, which remained significant after FDR correction (p = 0.007, q = 0.038). Complementary ventral mean velocity and reflux fraction results are summarized in Table 2 and are interpreted as nominal findings after correction (mean velocity: p = 0.036, q = 0.080; reflux fraction: p = 0.035, q = 0.080). (C) Function (DTI-ALPS Index): The DTI-ALPS index, reflecting microscale glymphatic clearance, was significantly lower in patients with PD than in healthy controls (p < 0.001, q = 0.005). (D) Structure (PVSVF): Perivascular space volume fraction in the basal ganglia showed no significant group difference (p = 0.139, q = 0.254). White-matter and whole-brain PVSVF results are provided in Table 2.
3.2.1 Source (CPV)
Patients with PD exhibited a nominal increase in CPV compared with HCs (median: 0.433 vs. 0.365, p = 0.021, q = 0.076), which did not remain significant after FDR correction (Figure 2A).
3.2.2 Dynamics (CSF Hydrodynamics)
Macroscopic CSF flow dynamics at the ventral atlantoaxial level were altered in the PD group, with reduced net flow remaining significant after FDR correction (p = 0.007, q = 0.038), whereas the reduced mean velocity (p = 0.036, q = 0.080) and increased reflux fraction (p = 0.035, q = 0.080) were nominal findings (Figure 2B).
3.2.3 Function (DTI-ALPS Index)
The DTI-ALPS index, reflecting microscopic glymphatic clearance, remained significantly lower in the PD group than in HCs (1.431 ± 0.189 vs. 1.576 ± 0.243, p < 0.001, q = 0.005) (Figure 2C).
3.2.4 Structure (PVSVF)
No significant group difference was detected in PVSVF-BG (p = 0.139, q = 0.254) (Figure 2D). White-matter and whole-brain PVSVF results are summarized in Table 2 and were likewise not significant (all q > 0.05).
3.3 Spinal CSF Hydrodynamics
To quantify craniospinal CSF dynamics, we analyzed PC-MRI at the atlantoaxial (C1–C2) level, compartmentalizing the spinal subarachnoid space into ventral and dorsal flow regions. The corresponding hydrodynamic parameters are detailed in Table 2.
Within the ventral flow space, patients with PD exhibited an altered hydrodynamic profile characterized primarily by reduced net forward movement, with only nominal findings suggestive of greater oscillatory flow components. The PD group demonstrated a significantly lower median net flow (0.010 vs. 0.015 mL/beat, p = 0.007, q = 0.038) (Figure 2B), whereas the lower mean velocity (0.060 vs. 0.105 cm/s, p = 0.036, q = 0.080) and higher reflux fraction (88.53% vs. 83.81%, p = 0.035, q = 0.080) were nominal findings that did not remain significant after FDR correction. Stroke volume and other secondary ventral flow metrics did not show consistent between-group differences and are summarized in Supplementary Table S1. Conversely, the dorsal flow space remained hydrodynamically stable, with no significant group differences observed in the prespecified primary dorsal metrics shown in Table 2 (all q > 0.05). Secondary dorsal flow metrics are provided in Supplementary Table S1 for completeness. This spatial heterogeneity, characterized by more evident ventral impairment alongside relative dorsal preservation, summarizes the macroscopic CSF flow pattern observed in this PD cohort.
3.4 Correlation Between Multimodal Imaging and Clinical Phenotypes
Spearman partial correlation and covariate- adjusted linear regression analyses were conducted to evaluate the associations between multidimensional imaging metrics and clinical symptoms, controlling for age, sex, and disease duration (Table 3, Figure 3). After FDR correction, the partial correlation findings remained significant, whereas among the regression-based associations, only the anxiety- and sleep-related findings remained significant.
Associations between multidimensional MRI biomarkers and clinical phenotypes in the PD group.

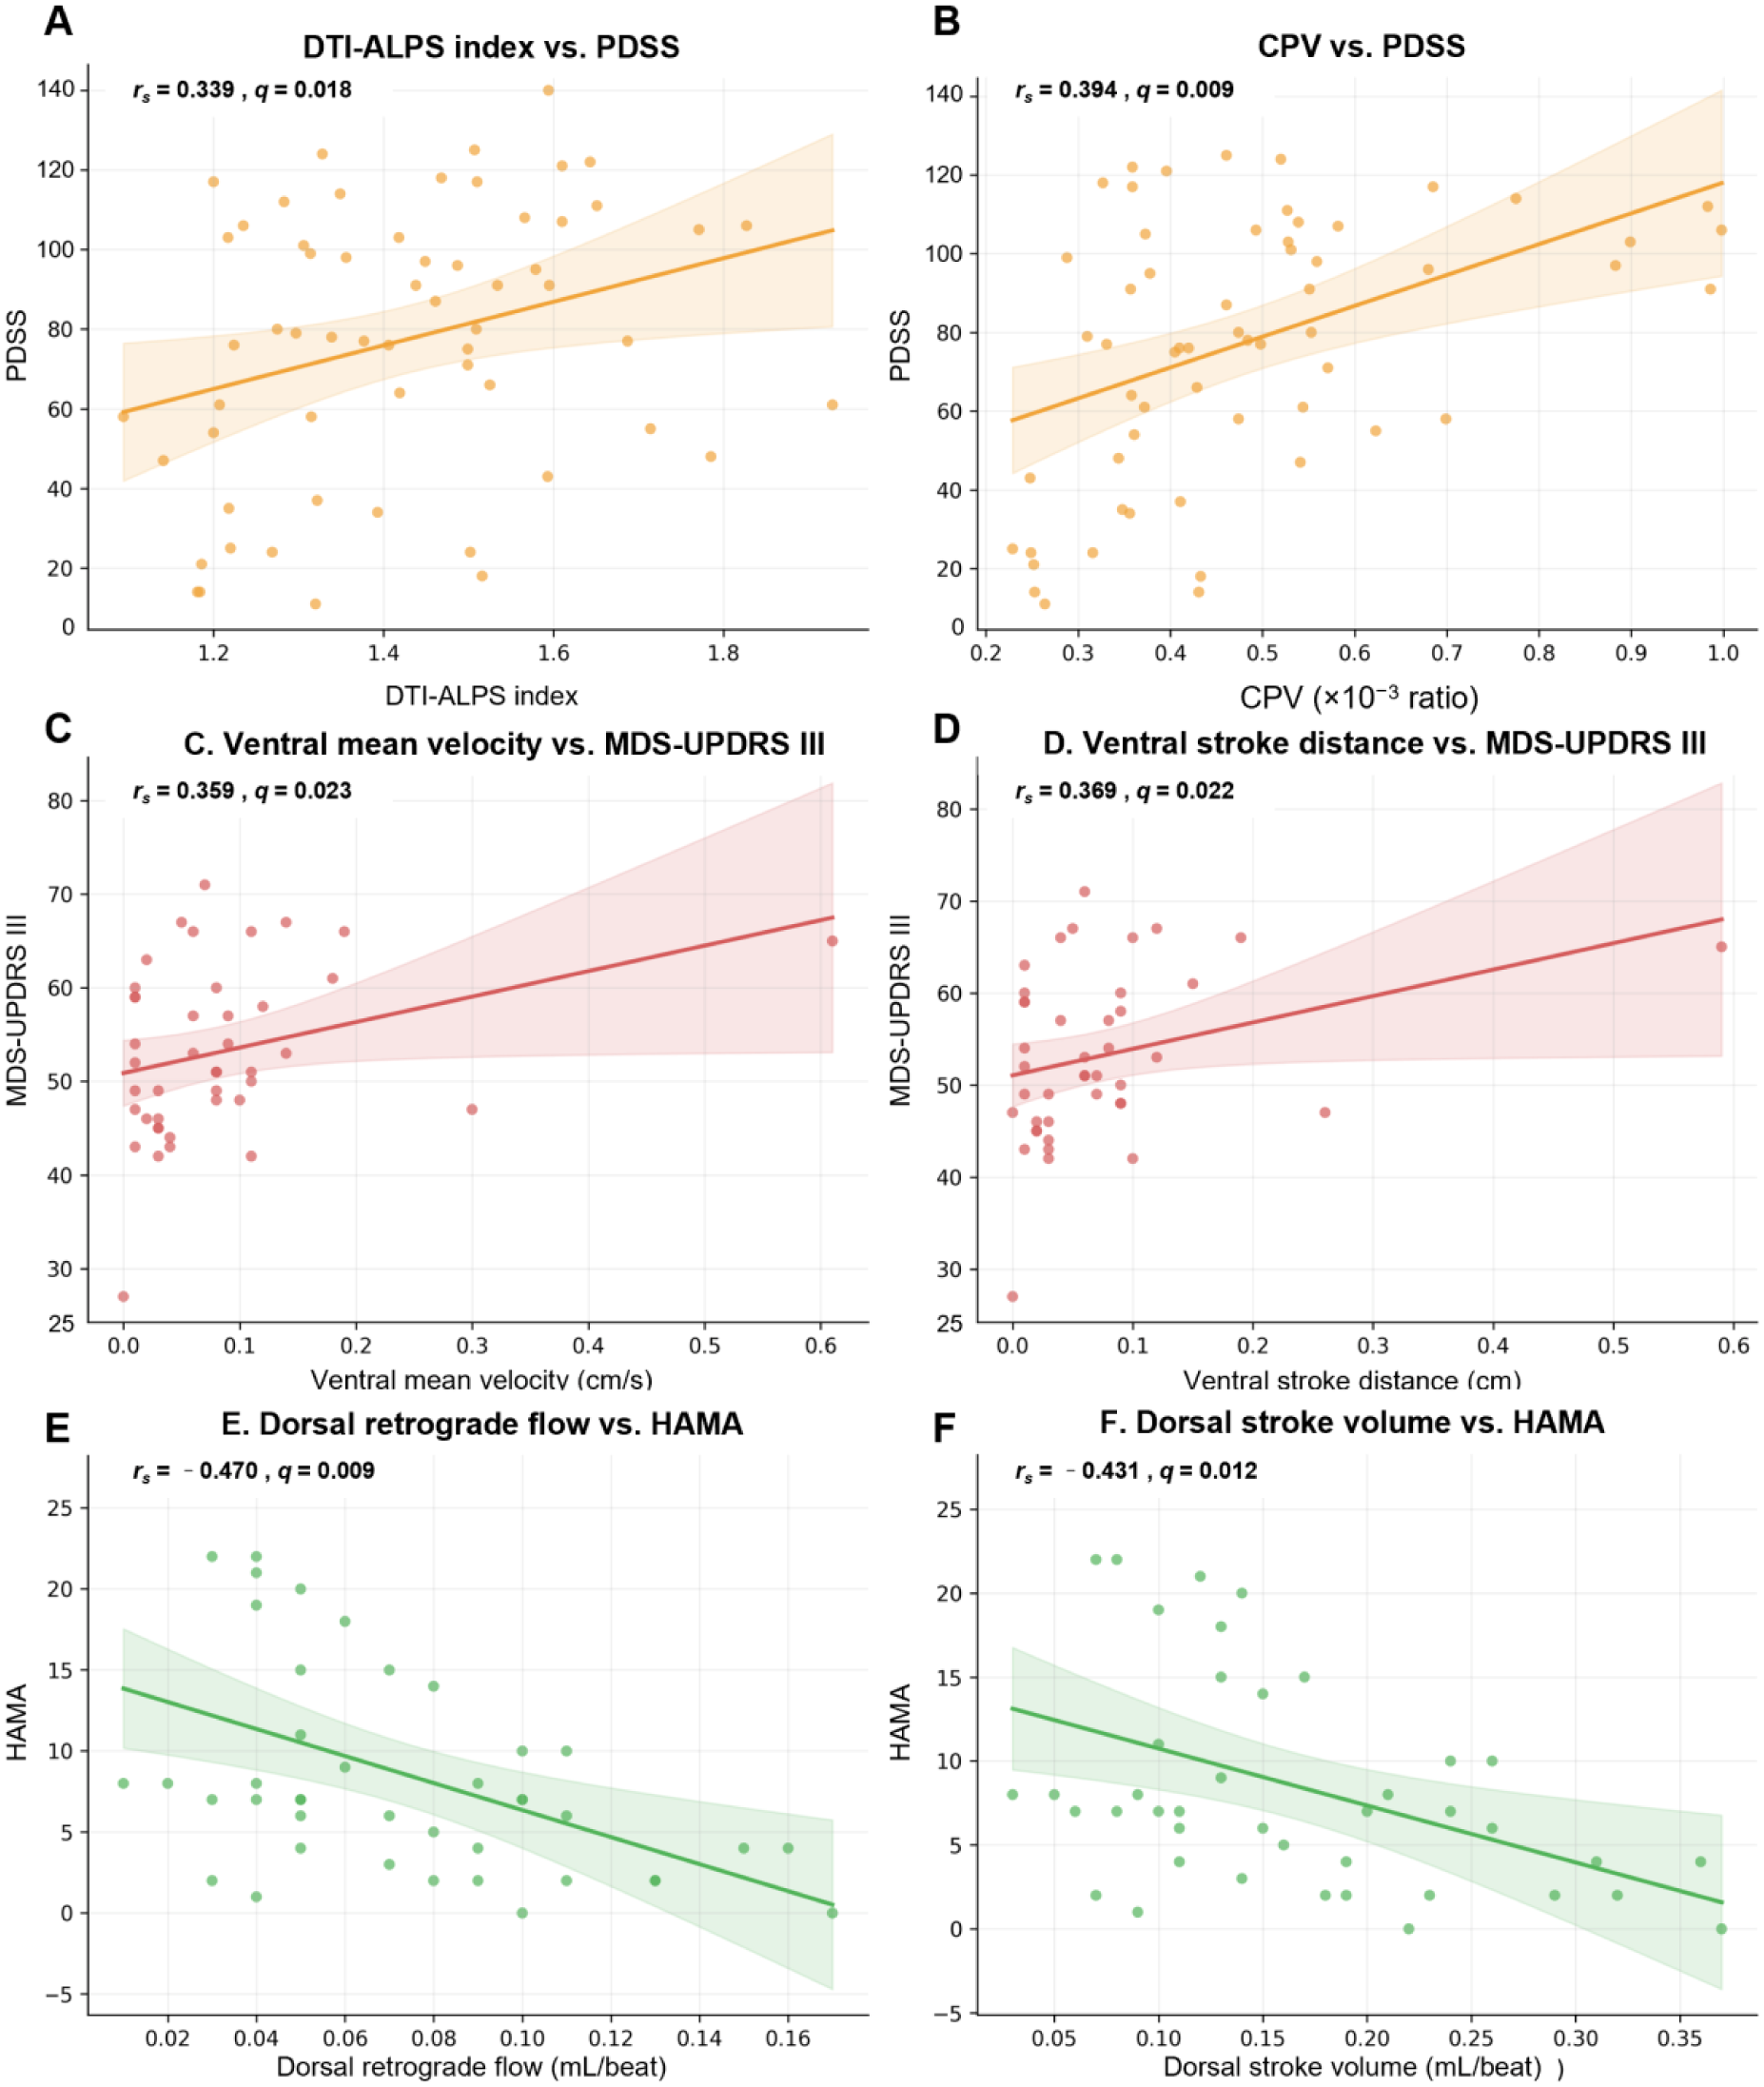
Partial correlations between multidimensional MRI biomarkers and clinical phenotypes in PD. (A, B) Non-motor symptoms: microscale glymphatic clearance (DTI-ALPS index) and source metrics (CPV) remained significantly associated with PDSS sleep scores after FDR correction. (C, D) Motor severity: ventral CSF hydrodynamics, specifically ventral mean velocity and stroke distance, showed significant partial correlations with MDS-UPDRS III scores, although the corresponding regression-based associations did not remain significant after FDR correction. (E, F) Anxiety severity: selected dorsal CSF hydrodynamic metrics remained significantly and negatively associated with HAMA scores after FDR correction.
3.4.1 Non-Motor Symptoms
Glymphatic and source metrics showed the most consistent associations with sleep quality, whereas cognition showed a more limited MoCA- based exploratory signal. The DTI-ALPS index (rs = 0.339, p = 0.008, q = 0.018) and CPV (rs = 0.394, p = 0.002, q = 0.009) correlated positively with the PDSS sleep score (Figure 3A, 3B). For cognitive assessment, dorsal peak velocity showed a negative partial correlation with MoCA scores (rs = -0.340, p = 0.027, q = 0.027), although this association did not remain significant in the corresponding regression analysis (Table 3). In an exploratory supplementary analysis, MMSE did not show significant associations with any of the prespecified imaging biomarkers under the same covariate-adjusted framework after multiple comparison correction (Supplementary Table S2). For example, dorsal peak velocity, which showed a significant partial correlation with MoCA in the primary analysis, was not significantly associated with MMSE (partial rs = -0.265, p = 0.089; standardized β = -0.159, p = 0.371).
3.4.2 Motor Symptoms vs. Ventral Hydrodynamics
Ventral CSF flow dynamics showed significant associations with motor severity in the partial correlation analyses. UPDRS III scores were positively associated with both ventral mean velocity (rs = 0.359, p = 0.020, q = 0.023) (Figure 3C) and ventral stroke distance (rs = 0.369, p = 0.016, q = 0.022) (Figure 3D). Furthermore, dorsal peak velocity exhibited a negative partial correlation with UPDRS III scores (rs = -0.366, p = 0.017, q = 0.022). However, these motor-related associations did not remain significant in the corresponding regression analyses after FDR correction and should therefore be interpreted as suggestive rather than definitive.
3.4.3 Anxiety vs. Dorsal Hydrodynamics
By contrast, selected dorsal CSF hydrodynamic metrics showed consistent negative associations with anxiety severity. Covariate-adjusted linear regression identified dorsal retrograde flow (β = -0.471, p = 0.002, q = 0.009) and dorsal
stroke volume (β = -0.425, p = 0.006, q = 0.018) as significant negative correlates of HAMA scores in the covariate-adjusted regression models. Dorsal antegrade flow was also negatively associated with HAMA (β = -0.388, p = 0.013, q = 0.029). Consistent partial correlation patterns for these anxiety-related associations are visually presented in Figure 3E and 3F.
3.4.4 Multimodal Independence (Correlation Heatmap)
A correlation heatmap of the multimodal imaging metrics and selected clinical variables (Supplementary Figure S1) was constructed to provide an overall view of inter-relationships across domains and to visually assess potential collinearity among candidate imaging predictors. Although low-to-moderate correlations were observed across the majority of inter-axis comparisons (mostly rs < 0.3), a strong within- domain correlation was detected between ventral net flow and ventral mean velocity (rs = 0.93). Despite this within-domain dependence, the predominance of low-to-moderate cross- domain correlations supports the relative complementarity of the multimodal framework. Consistent with this exploratory correlation structure, VIF- and tolerance-based collinearity diagnostics for the four predictors included in the final diagnostic model indicated no substantial multicollinearity (VIF range: 1.067–1.184; tolerance range: 0.845–0.937; Supplementary Table S3).
3.5 Diagnostic Performance and Multivariable Model Construction
The diagnostic utility of individual and combined imaging biomarkers for differentiating PD from HCs was evaluated using receiver operating characteristic curve analysis in the full study sample. Secondary PC-MRI-derived flow metrics were analyzed using all available data and are summarized in Supplementary Table S1.
3.5.1 Performance of Isolated Metrics
Individual metrics demonstrated modest discriminatory performance. The DTI-ALPS index yielded an AUC of 0.631 [95% confidence interval (CI): 0.481–0.781], with 28.3% sensitivity and 100.0% specificity at a cutoff of < 1.224. Ventral net flow produced an AUC of 0.620 (95% CI: 0.463–0.778), with 88.3% sensitivity and 40.0% specificity at a cutoff of < 0.020 mL/beat. CPV achieved an AUC of 0.653 (95% CI: 0.511–0.795), with 60.0% sensitivity and 70.0% specificity at a cutoff of > 0.405, whereas PVSVF-BG exhibited an AUC of 0.621 (95% CI: 0.480–0.763), with 43.3% sensitivity and 83.3% specificity at a cutoff of < 0.018. These cutoff-based performance estimates should be interpreted as descriptive within-sample results. CPV- and PVSVF-based cutoff values are expressed on the same scaled- ratio (×10-3) scale used throughout the manuscript.
3.5.2 Multidimensional Combined Model
To address the limited performance of isolated metrics, a multivariable diagnostic model was constructed via binary logistic regression, integrating four dimensions: function (DTI-ALPS), source (CPV), dynamics (ventral net flow), and structure (PVSVF-BG). The combined model yielded the numerically highest apparent AUC (0.686; 95% CI: 0.540–0.832), with 38.3% sensitivity and 93.3% specificity at a cutoff of > 0.776. However, DeLong’s test showed that the AUC of the combined model was not significantly different from those of CPV (p = 0.572), DTI-ALPS (p = 0.462), PVSVF-BG (P = 0.490), or ventral net flow (p = 0.420). These findings indicate that the integrated model provided the numerically highest discrimination in the derivation sample, although its advantage over the individual imaging metrics did not reach statistical significance. Bootstrap internal validation of the combined model yielded an optimism-corrected AUC of 0.621 and an optimism-corrected Brier score of 0.213. The optimism-corrected calibration slope was 0.722, with a calibration intercept of 0.198, suggesting modest overfitting and limited calibration stability; accordingly, the current model should be interpreted as exploratory.

Diagnostic performance of isolated imaging biomarkers and the integrated multivariable model. (A) Receiver operating characteristic (ROC) curves for individual imaging metrics (CPV, ventral net flow, DTI-ALPS index, and PVSVF-BG) and the combined “Source-Dynamics-Function-Structure” model for differentiating patients with PD from HCs. (B) Area under the curve (AUC) values with 95% confidence intervals for the individual metrics and the combined model. (C) Paired DeLong comparisons between the combined model and each individual imaging metric.
4 Discussion
This study integrated glymphatic-related and macroscopic CSF imaging measures within a multidimensional “Source-Dynamics-Function- Structure” magnetic resonance imaging framework in patients with moderate-to-advanced Parkinson’s disease eligible for deep brain stimulation. In this cohort, we identified a distinct imaging profile characterized by impaired microscale clearance, altered macroscopic cerebrospinal fluid flow, and preserved gross perivascular morphology. Overall, these findings indicate functional clearance deficits and macroscopic flow stagnation, without corresponding gross structural perivascular remodeling. This cohort specificity is important for interpreting the present findings. Because the study population predominantly comprised moderate-to-advanced, DBS-eligible patients, the observed imaging profile should be understood as a pattern identified within a clinically selected subgroup rather than as a uniform biological signature of the entire PD continuum. In this context, the value of the present study lies less in claiming universal stage-spanning generalizability and more in demonstrating that a multidimensional MRI framework can capture convergent yet spatially heterogeneous alterations in glymphatic- related function and CSF hydrodynamics within a clinically relevant population. This distinction may also help explain why the current findings should be viewed as an exploratory reference framework for this cohort, such that broader validation across prodromal, early-stage, and non- DBS-selected PD populations remains necessary.
4.1 Multidimensional Case-Control Imaging Differences
A principal case-control finding was the significant reduction in the DTI-ALPS index, indicating impaired microscale glymphatic clearance in PD. One possible interpretation is that the reduced DTI-ALPS index reflects disruption of fluid exchange at the astrocytic endfeet. Within the PD microenvironment, α-synuclein-related neuroinflammation and astrocyte reactivity may contribute to aquaporin-4 depolarization[20], thereby impairing glymphatic exchange and promoting macromolecule retention[21]. By contrast, CPV showed only a nominal increase after FDR correction, whereas PVSVFs in the basal ganglia, white matter, and whole brain did not differ significantly between groups.
The coexistence of reduced DTI-ALPS, nominal increase in CPV, and preserved gross PVS morphology suggests that detectable functional alterations may be more prominent than macroscopic structural remodeling in this cohort. The nominal increase in CPV may reflect either a compensatory hypersecretory response aimed at maintaining CSF turnover or an inflammatory change involving the choroid plexus itself[22]. At the same time, concurrent cortical atrophy may partially mask fluid-related PVS expansion, contributing to the apparent dissociation between functional and structural findings.
The absence of significant PVS dilation in our moderate-to-advanced PD cohort suggests that detectable macroscopic structural remodeling of fluid conduits may be less prominent than functional alterations in this cohort. Concurrent cortical atrophy may also physically mask fluid-driven PVS expansion. This temporal dissociation highlights the superior sensitivity of dynamic imaging modalities, such as PC-MRI and DTI-ALPS, over static structural MRI for detecting subtle or functionally predominant pathophysiological alterations in PD.
At the macroscopic level, patients with PD exhibited an altered ventral hydrodynamic profile, with reduced ventral net flow remaining significant after FDR correction, whereas the increase in reflux fraction and reduction in mean velocity were nominal findings. By contrast, dorsal hydrodynamic metrics did not differ significantly between the groups. Taken together, these findings support the presence of a spatially heterogeneous low-net-flow state in PD, with more pronounced abnormalities in the ventral compartment than in the dorsal compartment. These findings may be consistent with a mechanical coupling framework in which increased resistance in spinal CSF drainage elevates hydrostatic pressure within the ventricular system[23], further reducing effective long-range convective transport and prolonging the residence time of neurotoxic proteins within the CNS[24].
Together, these findings define the core case- control imaging profile in this cohort and provide the basis for the symptom-related associations examined below.
4.2 Clinical-Radiological Mapping: Spatial Heterogeneity
Beyond the case-control differences, the present study further examined how these imaging alterations map onto distinct clinical dimensions. The results support a spatially differentiated clinical-radiological pattern in which ventral CSF dynamics are linked primarily to motor severity, dorsal hydrodynamics are linked more strongly to anxiety-related symptoms, and glymphatic/source metrics are linked to sleep- related phenotypes.
In the ventral compartment, CSF hydrodynamic measures were associated primarily with motor severity. Ventral stroke distance and ventral mean velocity showed significant partial correlations with MDS-UPDRS Part III scores, although the corresponding regression-based associations did not remain significant after FDR correction. Anatomically, the ventral subarachnoid space lies adjacent to the vertebral bodies and major pulsatile vascular structures, and is therefore likely to be exposed to substantial pulsatile energy[25]. Within this context, the ventral low-net-flow profile observed here may be relevant to motor symptom burden, at least at the level of correlation. In addition, altered ventral CSF dynamics may influence the local neurovascular microenvironment and impose abnormal biomechanical stress on ventral spinal structures, thereby potentially contributing to motor dysfunction[26]. Importantly, the between-group reduction in ventral mean velocity and its positive within-PD association with motor severity should not be interpreted as directly contradictory, because these findings address different inferential levels. Under an overall low-net-flow state, relatively higher local mean velocity within the PD cohort may not indicate more effective forward transport, but may instead reflect greater oscillatory inefficiency, altered pulsatile redistribution, or different compensatory/decompensatory states across disease severity. Accordingly, this directional relationship should be interpreted cautiously and regarded as hypothesis-generating rather than mechanistically established.
By contrast, selected dorsal CSF hydrodynamic metrics were more strongly related to anxiety severity. In particular, dorsal retrograde flow, dorsal stroke volume, and dorsal antegrade flow remained significantly associated with HAMA scores in covariate-adjusted regression analyses after FDR correction. Dorsal peak velocity also showed a significant partial correlation with MoCA scores, although this relationship did not remain significant in regression analysis. These results suggest that the dorsal compartment may be linked more closely to selected non-motor dimensions than to the ventral motor-related profile, although this interpretation should remain confined to the specific dorsal metrics that retained significance in the present analyses. One possible interpretation is that dorsal hydrodynamics may be more relevant to long-distance volume transmission processes involving monoaminergic signaling and interstitial fluid homeostasis[27, 28]. However, this interpretation remains inferential and should be considered hypothesis-generating.
Sleep-related associations added a further layer to this spatially heterogeneous pattern. The DTI-ALPS index and CPV were both positively associated with PDSS scores, supporting a relationship between glymphatic function, CSF- related source metrics, and sleep quality in PD[29]. This finding is consistent with the concept that sleep architecture is closely linked to glymphatic exchange and CNS metabolic homeostasis, and that sleep disruption may further aggravate α-synuclein-related clearance failure[30]. In addition, higher CPV was associated with better sleep quality in our cohort, a direction that is also compatible with recent work linking choroid plexus enlargement to glymphatic-related changes in PD[31]. By comparison, exploratory MMSE-based analyses did not reveal significant imaging associations after multiple comparison correction, suggesting that the cognitive associations observed in the present study were more evident for MoCA-based characterization than for MMSE.
Overall, this layer of analysis is data-driven and should be distinguished from the mechanistic interpretations discussed below.
4.3 Mechanistic Interpretations and Translational Relevance
The mechanistic interpretations proposed below should be regarded as hypothesis-driven rather than directly established by the current cross- sectional data. Nevertheless, the observed imaging pattern provides a useful framework for considering how glymphatic dysfunction and macroscopic CSF hydrodynamic alterations may be coupled in PD.
One possible model is that reduced glymphatic exchange, reflected by a lower DTI-ALPS index, coexists with a transient compensatory response at the level of the choroid plexus. Within such a framework, neuroinflammatory signaling may promote changes in choroid plexus epithelial activity, including pathways involving Toll-like receptor 4/nuclear factor kappa B and sodium– potassium chloride cotransporter 1, thereby modifying CSF production dynamics[32, 33]. Under a limited compensatory range, this response might partially offset impaired outflow resistance and help preserve waste clearance and sleep architecture; however, such compensation would be expected to fail as tissue remodeling and hydrodynamic inefficiency progress[34].
The ventral-dorsal dissociation observed in this study also permits a working physiological model in which the ventral compartment reflects impaired pulsation buffering (“Windkessel failure”), whereas the dorsal compartment may
be more relevant to volumetric transmission and selected non-motor symptom dimensions. Importantly, these concepts should be interpreted as organizing models for the observed associations rather than as directly proven mechanisms. The same caution applies to the positive relationship between glymphatic/source metrics and sleep quality: although the present findings are broadly compatible with a sleep-glymphatic coupling framework in PD, they do not establish causality, and future longitudinal or translational studies will be necessary to determine whether preserving sleep-related clearance function could support disease-modifying strategies[35].
From a translational perspective, this multidimensional framework may provide a useful physiological reference for future neuromodulation studies, including DBS. Mapping preoperative ventral and dorsal CSF dynamics together with glymphatic-related imaging measures may help define clinically relevant phenotypic patterns and may provide a basis for testing whether neuromodulatory interventions influence fluid homeostasis. At present, however, these translational implications should be regarded as exploratory.
4.4 Limitations and Future Directions
Several limitations should be considered when interpreting these findings. First, the cross- sectional design precludes causal inference and does not allow determination of whether the observed hydrodynamic and glymphatic-related abnormalities precede, accompany, or follow clinical progression. Longitudinal studies will be necessary to clarify the temporal stability and trajectory of these imaging alterations.
Second, although DTI-ALPS provides a practical and non-invasive surrogate of glymphatic-related function, it remains an indirect imaging marker and should not be interpreted as a direct measure of glymphatic flux. Similarly, the current imaging protocol was implemented on a conventional 3.0 T clinical platform; although this supports clinical feasibility, higher-field imaging may offer improved sensitivity for detecting subtle perivascular and spinal CSF abnormalities.
Third, the diagnostic model should be interpreted with caution. Although the combined model achieved the highest apparent AUC, its discrimination was only modest, its performance advantage over individual biomarkers was not statistically significant, and bootstrap validation suggested some degree of optimism and limited calibration stability. The model should therefore be viewed as hypothesis-generating and will require recalibration and external validation in independent cohorts before any clinical application can be considered.
Fourth, although all assessments were performed in the practically defined OFF-medication state to reduce acute pharmacological effects, the potential chronic influence of cumulative dopaminergic exposure on vascular compliance, CSF dynamics, and glymphatic-related imaging measures cannot be excluded. Future studies should incorporate medication burden more explicitly, including standardized measures such as levodopa equivalent daily dose.
Fifth, the cohort was intentionally restricted to moderate-to-advanced, DBS-eligible PD, which enhances clinical specificity but limits generalizability. The present results should therefore be interpreted as describing an imaging profile within a selected surgical subgroup rather than a universal signature across the full PD spectrum. Validation in prodromal, early-stage, and non-DBS-selected PD populations will be essential.
Sixth, although methodological consistency was strengthened through standardized acquisition and processing pipelines, blinded initial ROI placement, expert neuroradiologist review, and automated PVSVF extraction, the present study did not include formal repeated measurement analyses or intra-/inter-rater reproducibility assessments. Accordingly, the revised manuscript improves methodological transparency and clarifies the safeguards used to reduce avoidable variability, but it should not be interpreted as establishing formal measurement reproducibility for the manual and semi-manual imaging components. Formal reproducibility testing, including repeat-measurement and observer- reliability analyses, should be incorporated in future validation studies.
Finally, the multimodal framework remains biologically incomplete. The study did not integrate CSF, tissue-based, or blood-based molecular biomarkers, and cognitive analyses were more informative for the MoCA than for the MMSE within the current exploratory design. Future studies that combine the present imaging framework with molecular biomarkers, clinical subtype stratification, and longitudinal phenotyping may help refine the biological interpretation and improve phenotypic resolution.
5 Conclusion
This prospective study presents a multidimensional “Source-Dynamics-Function-Structure” MRI framework for characterizing the pathophysiological imaging profile of glymphatic-related function and CSF hydrodynamics in moderate-to-advanced, DBS-eligible PD.
Our findings indicate that microscale clearance deficits and macroscopic flow attenuation were observed in the absence of detectable gross structural perivascular remodeling. The spinal CSF circulation also exhibited a low-net-flow pattern, with nominal evidence of increased reflux and marked spatial heterogeneity: ventral fluid dynamics showed significant partial correlations with motor severity, whereas selected dorsal flow metrics remained significantly associated with anxiety severity in covariate-adjusted regression analyses. Integrating these spatially and functionally distinct biomarkers yielded a multidimensional diagnostic model with the highest overall discrimination numerically, although its advantage over the individual imaging metrics did not reach statistical significance in paired DeLong comparisons, and its current performance should be regarded as exploratory.
Taken together, this framework provides an exploratory quantitative neuroimaging reference for moderate-to-advanced, DBS-eligible PD. It may serve as a useful basis for future validation studies and for investigating whether neuromodulatory interventions, including DBS, influence glymphatic- related function and CSF homeostasis.
Footnotes
Supplementary Materials
VIFs and tolerance values for the four predictors included in the final diagnostic model.

| Predictor | VIF | Tolerance |
|---|---|---|
| DTI-ALPS index | 1.184 | 0.845 |
| CPV | 1.088 | 0.919 |
| Ventral net flow | 1.067 | 0.937 |
| PVSVF-BG | 1.179 | 0.848 |
Acknowledgements
The authors would like to express their sincere gratitude to all the participants and their families for their cooperation in this study. We also thank the clinical staff and nursing teams at the Department of Neurosurgery, Tsinghua University Yuquan Hospital, Tsinghua University Hospital of Integrated Traditional Chinese and Western Medicine, for their invaluable assistance in patient recruitment and data collection. The authors acknowledge the use of ChatGPT (model 5.4) developed by OpenAI for language polishing and grammatical proofreading of this manuscript. The author has reviewed and edited the content assisted by AI tools and assumes full responsibility for the content of the publication.
Funding Information
This work was supported by the Beijing Municipal Natural Science Foundation - Haidian Original Innovation Joint Fund (Grant No. L222154) and the Project for Enhancing the Scientific and Technological Capabilities of Traditional Chinese Medicine Specialized Clinics in Primary-level TCM Hospitals (Grant No. ZW2023A002).
Author Contribution
Liying Sun: Conceptualization, Methodology, Software, Formal analysis, Writing – original draft, Visualization. Yu Ma: Supervision, Project administration, Funding acquisition, Writing – review & editing. Yuqi Zhang: Supervision, Project administration, Funding acquisition, Writing – review & editing. Suhua Miao, Rongsong Zhou, Zhihua Zhang, Tiange Lu, Tiemin Li, Mingyuan Yan: Investigation, Data curation, Validation.
Declaration of Conflicting Interests
Professor Yuqi Zhang is the member of the Brain Science Advances Editorial Board. To minimize bias, he was excluded from all editorial decision- making related to the acceptance of this article for publication. The remaining authors declare no conflict of interest. The authors declare that they have no known competing financial interests or personal relationships that could have appeared to influence the work reported in this paper.
Data Availability Statement
The datasets generated and analyzed during the current study are not publicly available owing to patient privacy and institutional restrictions but are available from the corresponding author on reasonable request.
Ethics Statement
This study was approved by the Institutional Review Board and Ethics Committee of Tsinghua University Yuquan Hospital (Approval No. 2024KY014) and was conducted in accordance with the Declaration of Helsinki.
Informed Consent
Written informed consent was obtained from all participants prior to inclusion in the study.