
Abstract
In 2003, Chicago schools required students entering ninth grade with below-average math scores to take two periods of algebra. This led to higher test scores for students with both above- and below-average skills, yet failure rates increased for above-average students. We examine the mechanisms behind these surprising results. Sorting by incoming skills benefitted the test scores of high-skill students partially through higher demands and fewer disruptive peers. But more students failed because their skills were low relative to classroom peers. For below-average students, improvements in pedagogy and more time for learning offset problems associated with low-skill classrooms. In some cases, classrooms were not sorted, but below-average students took an extra support class simultaneously. Test scores also improved in such classes.
Low algebra skills and high failure rates in ninth-grade algebra are a concern in schools across the country. An increasingly popular approach for addressing these problems is to provide extended instructional time to students by enrolling them in two periods of algebra, either through a blocked, two-period class or a second “support” course taken simultaneously with the primary algebra class. (Hereafter, both of these strategies are referred to as “double-dose” algebra.) Nearly half of large urban districts report doubled math instruction as the most common form of support for students with lower skills (Council of Great City Schools, 2009).
Chicago implemented a double-dose algebra policy in 2003. A previous study evaluating this policy showed surprising results; test scores improved among both students targeted by the policy and among students who were not subject to the policy who should have been unaffected. Furthermore, failure rates increased despite improvements in learning algebra, particularly among those who were not targeted by the policy (Nomi & Allensworth, 2009). The prior study did not examine why these effects occurred, but suggested they were a result of sorting algebra classes by student skill level—a response to the policy that occurred in most schools, along with extra resources that were provided to the double-dose algebra classes.
Building on our prior study, the purpose of this study is to understand the mechanisms through which these effects occurred. It shows the extent to which sorting by skill level, as well as exposure to supports among targeted students, each affected the instructional climate in classrooms (including peer composition, course difficulty, pedagogy, course absence), and how these changes were related to subsequent test scores and failure rates. Understanding these mechanisms is necessary to address those aspects of the policy that resulted in higher failure while preserving those elements that led to increased learning. It also provides broader insight into the issue of sorting by skill level—showing how students of different skill levels are affected in different ways on a variety of outcomes by classroom peer composition.
The Policy Context
Nationwide there is growing concern about citizens’ mathematical literacy and the degree to which students are being prepared by high schools for college and careers (U.S. Department of Education, 2008). States and districts are responding by increasing the rigor of the high school curriculum. Currently, 20 states require all students to complete a college-preparatory curriculum for graduation (Achieve, 2008). The new standards require mathematics coursework to begin with Algebra I, the “gatekeeper course,” which students must pass to continue taking subsequent advanced mathematics courses (Paul, 2005).
However, there also has been concern that more students will enter high school without sufficient skills to handle the more rigorous work. As a result, they could be more likely to fail the more rigorous courses and eventually drop out of school. 1 Particularly in urban schools, many students begin ninth grade with skills well below grade level. 2 Requiring all students to take rigorous classes also poses a new challenge for teachers, as they may be unprepared to teach classes where students have a wide range of academic skills (Rosenbaum, 1999). Thus, educators face a dilemma—how can schools equip all students with the mathematics skills required in college and the workforce when students enter school with widely varying skill levels?
To deal with the problem of diversity in student skills, comprehensive high schools traditionally have tracked students by their incoming academic skills. Students who were perceived to have stronger skills took college preparatory work, while students with weaker skills took remedial coursework. However, tracking has been widely criticized for impeding the academic progress of low-performing students and exacerbating achievement inequalities (Gamoran, 1987; Oakes, 2005; Powell, Farrar, & Cohen, 1985; Rosenbaum, 1976). Moreover, tracking has been seen as socially unjust since low-income and minority students are overrepresented in low-track, “dead-end” courses (Oakes, 2005). 3 Low-track classrooms often suffer from poor instructional environments with low-level content and low expectations (e.g., Gamoran & Mare, 1989; Lucas, 1999; Oakes, 2005; Powell et al., 1985; Rosenbaum, 1976). Teachers tend to spend more time drilling basic skills or dealing with behavioral problems in low-track classrooms while spending more time on critical thinking in high-track classrooms (Oakes, 1985; Page, 1991; Rosenbaum, 1976). Tracking is also inconsistent with the goals of the current policy environment, in which schools are charged with preparing all students to be ready for college and high-skilled jobs in the labor market.
In the past two decades, criticisms of tracking led many schools and districts to eliminate curriculum tracks, mixing students of different skill levels into the same class. In principle, all students in detracked classes receive curriculum and instruction at the same level and rigor as those in college-preparatory classes (Oakes, 1985; Wheelock, 1992). However, schools’ detracking efforts often encounter a number of challenges. Teachers in detracked schools often continue to believe that tracking is necessary to address variability in students’ academic skills. Many teachers struggle with providing effective instruction in mixed-ability classrooms and continue to hold low expectations for students after classes are detracked. Also, schools often face resistance from middle-class parents because they believe tracking benefits their children if they are placed in high-track classrooms (Gamoran & Weinstein, 1998; Oakes, 1994; Wells & Oakes, 1996; Rubin, 2008).
Besides being difficult to implement, detracking seems to have some negative consequences on academic achievement, particularly among high-skill students. For example, a qualitative study of social science classes suggested that the most able students in detracked classrooms were more bored and disaffected than they had been in tracked classes, as teachers typically lowered instructional levels to accommodate lower skill students (Rosenbaum, 1999). A quantitative study of detracking based on national data suggested that the achievement of high-skill students would decline if they moved out of high-level tracks (Argys, Rees, & Brewer, 1996). In Massachusetts, detracking resulted in fewer students performing at “proficient” and “advanced” levels on state tests, compared with schools that continued to track students (Loveless, 2009). Detracking may be particularly difficult to implement in urban schools, where high-achieving students lack support for learning outside of the classroom and are greatly outnumbered by low-achieving peers (Gamoran, 2010). Successful detracking examples often come from well-resourced suburban schools; in contrast, case studies of urban schools have shown negative effects of detracking for high-achieving minority students (Burris, Heubert, & Levin, 2006; Gamoran & Weinstein, 1998; Rosenbaum, 1999; Rubin, 2008). 4 Low-skill students placed with high-skill students may also suffer negative effects, including reduced self-esteem (Loveless, 1999). Thus, while tracking seems to lead to poor instructional climates for low-skill students, merely eliminating tracking is not clearly preferable.
An Alternative Approach: Sorting Algebra Classes by Incoming Skills, With Extra Support for Low-Skill Students and Their Teachers
In 1997, Chicago Public Schools (CPS) enacted a reform that universalized algebra for all ninth graders, eliminating all remedial mathematics. This policy dramatically increased algebra enrollment for low-performing students; almost all first-time ninth-grade students (97%) took algebra in the years following the policy change. However, test scores of low-performing students did not improve and their failure rates increased as a result of the policy (Allensworth, Nomi, Montgomery, & Lee, 2009). Moreover, the policy led to more classrooms with mixed-ability grouping and as a result, declining test scores for high-performing students (Nomi, 2012).
To improve pass rates in algebra for struggling students, the district instituted a double-dose strategy in 2003. The primary feature of the double-dose algebra policy was to provide twice as much time in algebra instruction for students with below-average incoming math skills, as well as instructional supports for their teachers. Specifically, the policy required first-time ninth graders with eighth-grade math scores below the national median on the Iowa Tests of Basic Skills (hereafter referred to as “below-norm students”) to enroll in two periods of algebra—a support algebra course and a regular algebra course.
This policy was different from traditional tracking or detracking. Specifically, the policy created homogeneous algebra classes for organizational reasons but ensured that low-track students received challenging coursework and high-quality instruction. This approach is consistent with the recommendations of some scholars concerned about the potential negative effects of tracking on low-skill students (Hallinan, 1994b; Loveless, 1999).
Many schools created homogenous grouping as a result of the districts’ guidelines about how schools should program double-dose algebra; the district encouraged schools to offer the courses sequentially in the day, with the same teacher and the same students. To follow these guidelines, schools tended to sort above-norm and below-norm students into separate algebra classes—a single period algebra class for above-norm students and double-period algebra for below-norm students. Consequently, peer skill levels declined considerably post-policy for below-norm students, while above-norm students had peers with much higher skills post-policy. As shown in Figure 1, there was a clear discontinuity after the policy in classroom skill levels between students entering ninth grade with eighth-grade test scores below the 50th percentile and those with test scores above the 50th percentile, while there was not such a discontinuity prior to the policy.
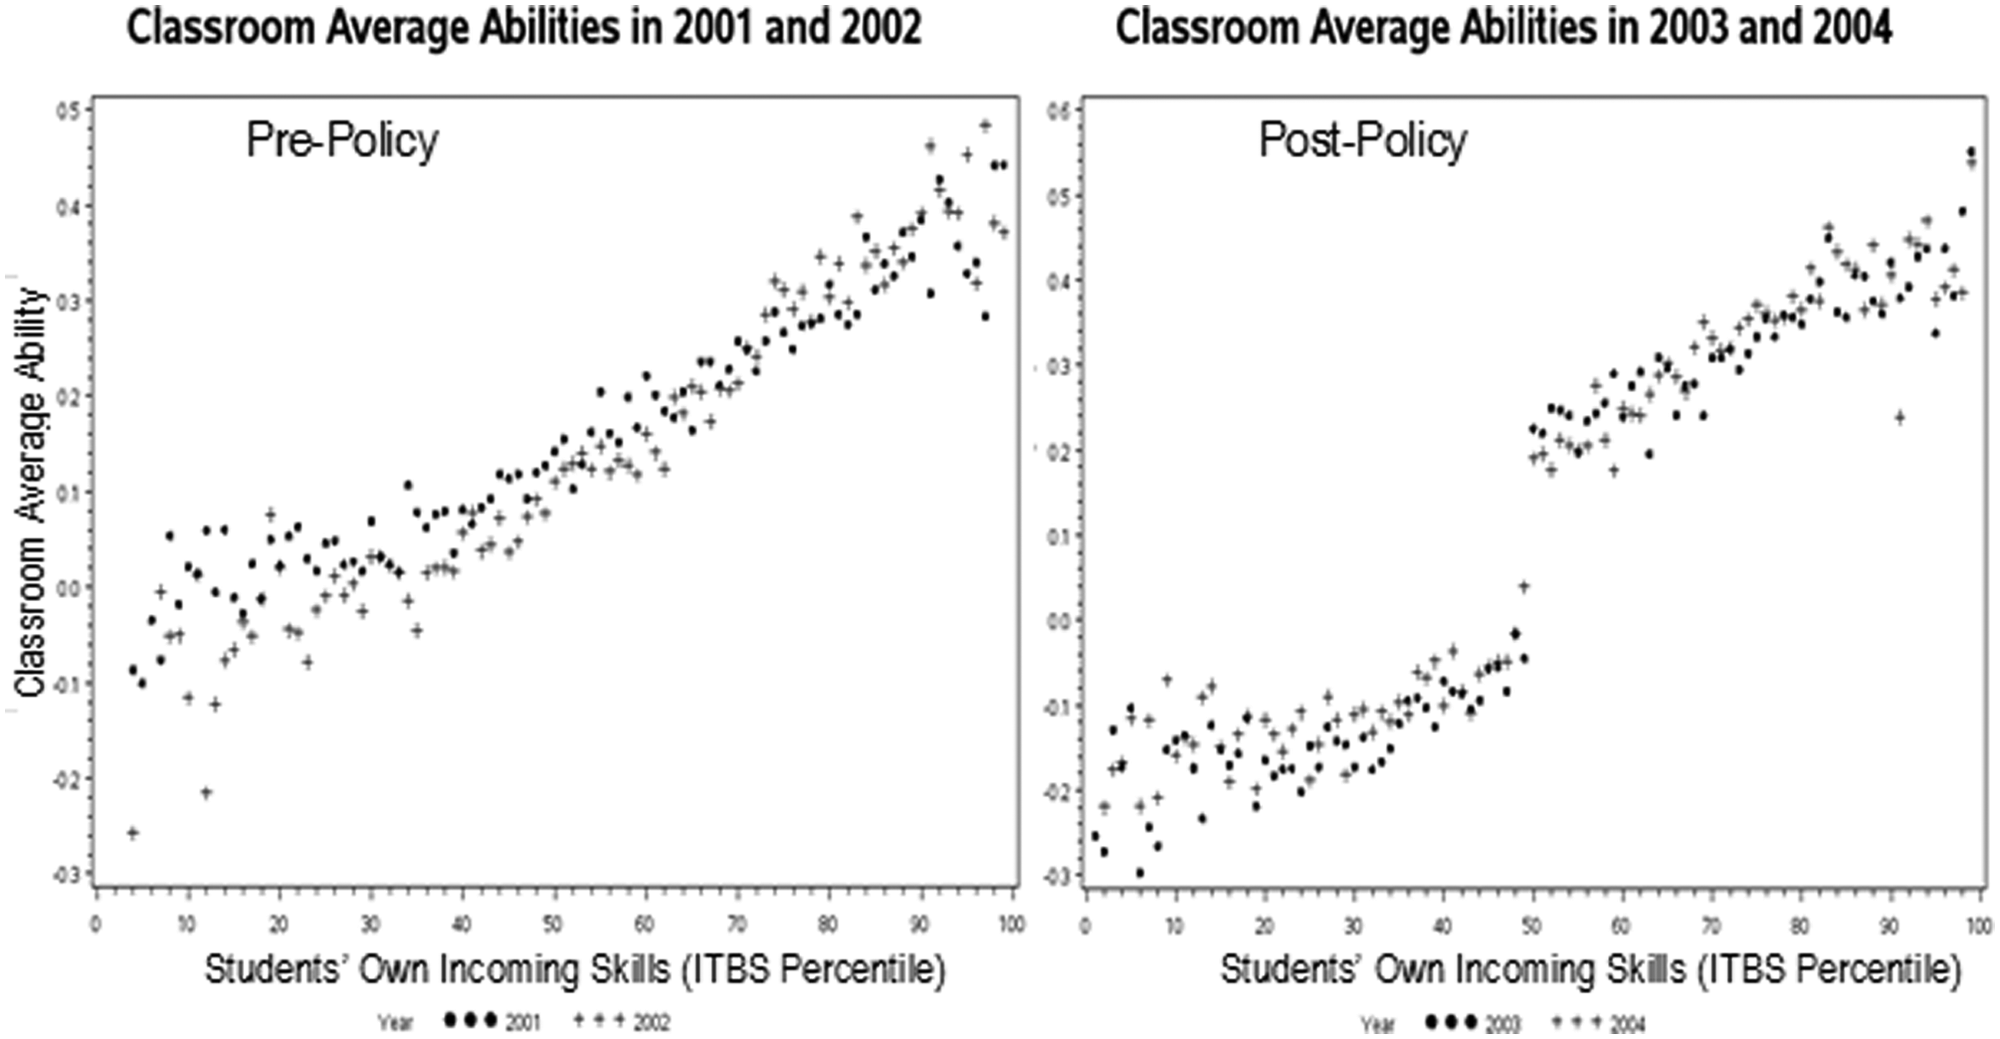
Classroom average skill by eight-grade Iowa Tests of Basic Skills percentile scores, pre- and post-policy (regular education students only).
To assist students with weak math skills, the district provided resource materials to double-dose algebra teachers through two curricular options—Agile Mind and Cognitive Tutor—along with stand-alone lesson plans. 5 They also ran professional development workshops three times a year for double-dose algebra teachers to help them effectively use the two periods of algebra instruction. According to the district internal and external evaluations, 6 double-dose algebra teachers reported that they were able to focus on skills that students lacked and cover materials in a different order, rather than simply following the textbook (Starkel, Martinez, & Price, 2006; Wenzel, Lawal, Conway, Fendt, & Stoelinga, 2005). The additional instructional time allowed for greater flexibility so that teachers were more likely to try the new practices suggested in the professional development. Teachers were also concerned that students with weak math skills would become disengaged with two periods of math. To facilitate students’ engagement, teachers tried to minimize time for lectures and use more interactive instructional activities, such as working in small groups, asking probing and open-ended questions, and using board work. External observers reported that support course teachers spent more time in these interactive activities than regular algebra teachers, who tended to spend more time giving lectures and letting students work individually. Observers also reported these instructional differences for the same teacher teaching both types of classes.
While most algebra classes were sorted by students’ skill levels, some schools did not completely create separate algebra classes for below- and above-norm students. This may have resulted from course scheduling difficulties or insufficient numbers of students to make up a separate double-period algebra class, given staffing constraints. In these cases, students with below-norm skills took algebra in mixed-ability classrooms, but they received a second period of algebra instruction during the same school term. Overall, half of all schools had at least one double-dose algebra class that used a heterogeneous model. On average, compared with schools with 100% sorted double-dose classes, these schools had students with lower average incoming skills and a larger proportion of low-income, African American, and Latino students. For students with above-norm math skills in these classes, peer skill levels did not increase greatly, since they continued to have some below-norm students in their classroom.
Conceptual Framework: How the Double-Dose Strategy Could Affect Achievement
The double-dose algebra policy could affect student outcomes through three key mechanisms: expanded instructional time; improvements in instruction resulting from curricular resources, professional development, and expanded instructional time for teachers; and ability grouping into more homogeneous classes. The policy deliberately doubled instructional time and attempted to improve instruction for below-norm students only. 7 For these students, extended time provided more time to learn the material, which is consistent with research on time on task (e.g., Anderson, 1984; Bloom, 1974; Millot, 1995). Extended time also provided instructional flexibility for teachers, as described in the district report. As well, the professional development and curricular resources that teachers received should have strengthened their instructional practices. Thus, even though sorting by skill level is often thought of as detrimental for low-skill students due to low-level content coverage, low expectations, poor instruction, and disciplinarily problems in low-track classrooms, such problems may have been mitigated because low-skill students and their teachers were provided with additional time and supports and a mandate to cover the same material as in the classes for above-norm students.
The policy unintentionally induced sorting, which would affect both low- and high-skill students. Sorting students by their skill levels potentially could have allowed teachers to better target instruction to a larger proportion of the students in their class. For above-norm students, the incoming skill levels of their peers improved considerably (see Figure 1). If teachers adjusted instruction in response, post-policy above-norm students would receive more challenging instruction. In addition, their classes might have had less disruption and better overall attendance, given that one criticism of low-track classes is that they have a disproportionate number of students with behavior problems. This also could have led to greater learning for above-norm students.
However, increases in peer skill level may also have made students in single-period algebra less likely to pass. Students may be more likely to fail in classes with higher-skill peers due to “fish pond effects,” a phenomenon in which teachers assign higher grades to students who look better in their classes relative to their peers (Farkas, Sheehan, & Grobe, 1990; Kelly, 2008). After all, students with test scores just above the national median would have gone from an average student in their algebra class to one of the lowest achieving students in their class. Furthermore, if teachers adjusted course content, pacing, or assignment difficulty upwards in response to the overall improvement in classroom average skills, students who normally would not struggle in Algebra might find it difficult. We specifically test the “fish pond” hypothesis on students’ course grade.
Research Questions
It is essential to understand the mechanisms of the double-dose policy in order to address shortfalls of the strategy and maintain beneficial aspects. Our research questions focus on changes in peer academic composition and classroom learning environments as potential mechanisms.
The effects of sorting by academic skills
The policy led to large shifts in the composition of students in algebra classes (see Figure 1). Given the mechanisms discussed previously, we ask:
Research Question 1: To what extent did the sorting that resulted from the policy affect algebra test scores and pass rates among students with below-norm and above-norm skills? To what extent were failure rates affected by the overall skill level in the classroom versus students’ own abilities relative to their classroom peers (i.e., “fish pond effects”)?
The effects of extra instruction for students in mixed-skill classes
Not all students were put in homogenous classes with the policy. Some students with below-average and above-average skills took algebra together, but students with below-average skills received a second support algebra class that they took simultaneously. The support provided to low-achieving students in heterogeneous classrooms may have spillover effects. For example, some studies have suggested that having low-achieving classroom peers is likely to lower achievement of high-achieving students (Argys et al., 1996; Rosenbaum, 1999). Yet, such negative effects could be avoided if low-achieving students were receiving additional instruction since they may have been less likely to hold back the pace or challenge of the class than if they were not receiving support. Therefore, we ask:
Research Question 2a: For above-norm students post-policy, how did the outcomes differ between students who took algebra in mixed-skill classrooms with below-norm students receiving supports and those in homogenous classes without such below-norm students?
Research Question 2b: Similarly, for below-norm students, how did the outcomes differ between those who took double-dose algebra in mixed-skill classrooms and homogenous classes with all below-norm students?
Policy effects on class environment
The policy should have affected students’ achievement by changing the instructional climate of algebra classes and students’ responses to that instruction. The professional development, curricular resources, and flexible time use should have led to improved pedagogical practices and greater demand in double-dose classes. In both double-dose and single period algebra classes, sorting by academic skills might have also affected instructional demand and peer behaviors. Using available data, we look at some key aspects of classroom climate and instruction, including the degree to which students perceived their course to be challenging, time spent in student-centered pedagogical practices, perceptions of peer support in the class, and the degree to which algebra classes contained students with disciplinary infractions and high absence rates in their non-math classes (i.e., students with a tendency for discipline issues). 8 We ask:
Research Question 3a: In what ways did the policy, and the ability sorting induced by the policy, affect students’ classroom climate and instructional experiences for below-norm and above-norm students?
Research Question 3b: How were these changes in classroom environment related to students’ test scores and pass rates?
Data and Methods
Data
The Chicago Public Schools is the third largest school district in the nation. Approximately 85% of students are eligible for free/reduced lunch programs. The racial-ethnic composition is 54% African American, 34% Latino, 9% White, and 4% Asian.
Administrative records from the district provide demographic information, including student enrollment status, age, gender, race, and special education status. Indicators of students’ socioeconomic status are derived from U.S. census data about the educational attainment, occupational levels, poverty, and employment status of residents in students’ residential block groups. Semester-by-semester course transcript and grade data files contain detailed course information, including teacher IDs, class periods, subject names, subject-specific course codes, and course grades. These were used to classify students’ algebra courses and group students with their classmates. These files also provided information on the number of absences students had in each of their classes. Elementary achievement test scores come from the Iowa Test of Basic Skills (ITBS), taken in third through eighth grades. Disciplinary files were used to calculate students’ disciplinary records and to corroborate information on disciplinary problems gathered through the surveys. High school achievement test scores come from the PLAN exam, a test that is part of the EPAS system developed by ACT, Inc., which all CPS students take in the fall of the 10th grade. Surveys of students conducted biannually by the Consortium on Chicago School Research provide information about the climate and instruction in math classrooms, including instructional activities, academic demand, and students’ disciplinary problems, described further in the following.
Sample
Our analyses use two cohorts of first-time ninth-grade students—one pre-policy (2002–03) cohort and one post-policy (2004–05) cohort of students. For the analyses of sorting on academic outcomes, we use the entire population of students in the ninth-grade cohorts with some restrictions. We restrict our analyses to students in schools that were in existence in both time periods to make comparisons between different cohorts of students in the same school, before and after pre-policy. We also exclude students who received special education services because many of them were exempt from the double-dose algebra policy and pre-policy they often enrolled in special education classrooms, which would not be comparable to typical pre-policy algebra classrooms attended by regular education students. For analysis of the effects of the policy on classroom instructional environments, we further limit the sample to those students who responded to questionnaires about their math classrooms on the biannual survey.
Additionally, we restrict the analyses to students who adhered to the policy—below-norm students who enrolled in double-dose algebra and above-norm students who enrolled in single-period algebra. By making this restriction, we attempted to estimate the policy effects for policy-complying students. 9 Excluding students who did not take the required course made it easier to model relationships between classroom composition and students’ outcomes. 10 However, this introduces selection bias if policy adherence was correlated with unmeasured characteristics of students in a way that was correlated with their outcomes. Thus, we also performed an instrumental variables analysis to estimate the unbiased treatment effect for policy-complying students and compared that estimate to the estimate obtained by simply excluding students who did not take the required course. Results of the analysis are provided in Appendix A in the online journal.
The first sets of analyses use the population of students that meet the aforementioned conditions (N = 24,259 in 55 schools). Analyses that use survey data were restricted to students for whom we have survey information about their algebra class (N = 6,779). While the biannual survey was given to all CPS students, questions about math classes were administered to a subset of students. In the spring 2003 survey, students were randomly selected to respond to either English or math questionnaires. In the 2005 survey, students were asked whether they had English or math classes first on Monday and to answer questions on the marked class. Among ninth-grade regular education students, the overall survey response rates were 58% for the 2002–03 cohort and 67% for the 2004–05 cohort. Of survey respondents, 50% responded to math questionnaires in 2003 and 43% in 2005.
We were concerned that the results based on survey respondents may not be generalizable to the general ninth-grade population. For the same cohort of students, survey respondents tend to have better academic outcomes than the overall population—slightly higher algebra scores and higher algebra pass rates, although they are similar in terms of pretreatment characteristics, such as incoming skills and demographic characteristics (see Table 1). Moreover, differences in the survey response rates between the two cohorts might bias our results if they represented different types of students in the different years. The two cohorts of survey respondents had similar pretreatment characteristics to each other, but it is possible that they may differ in unmeasured ways that also affect their outcomes.
Descriptive Statistics of Survey Respondents and Ninth-Grade Population on Selected Student Characteristics by Cohort
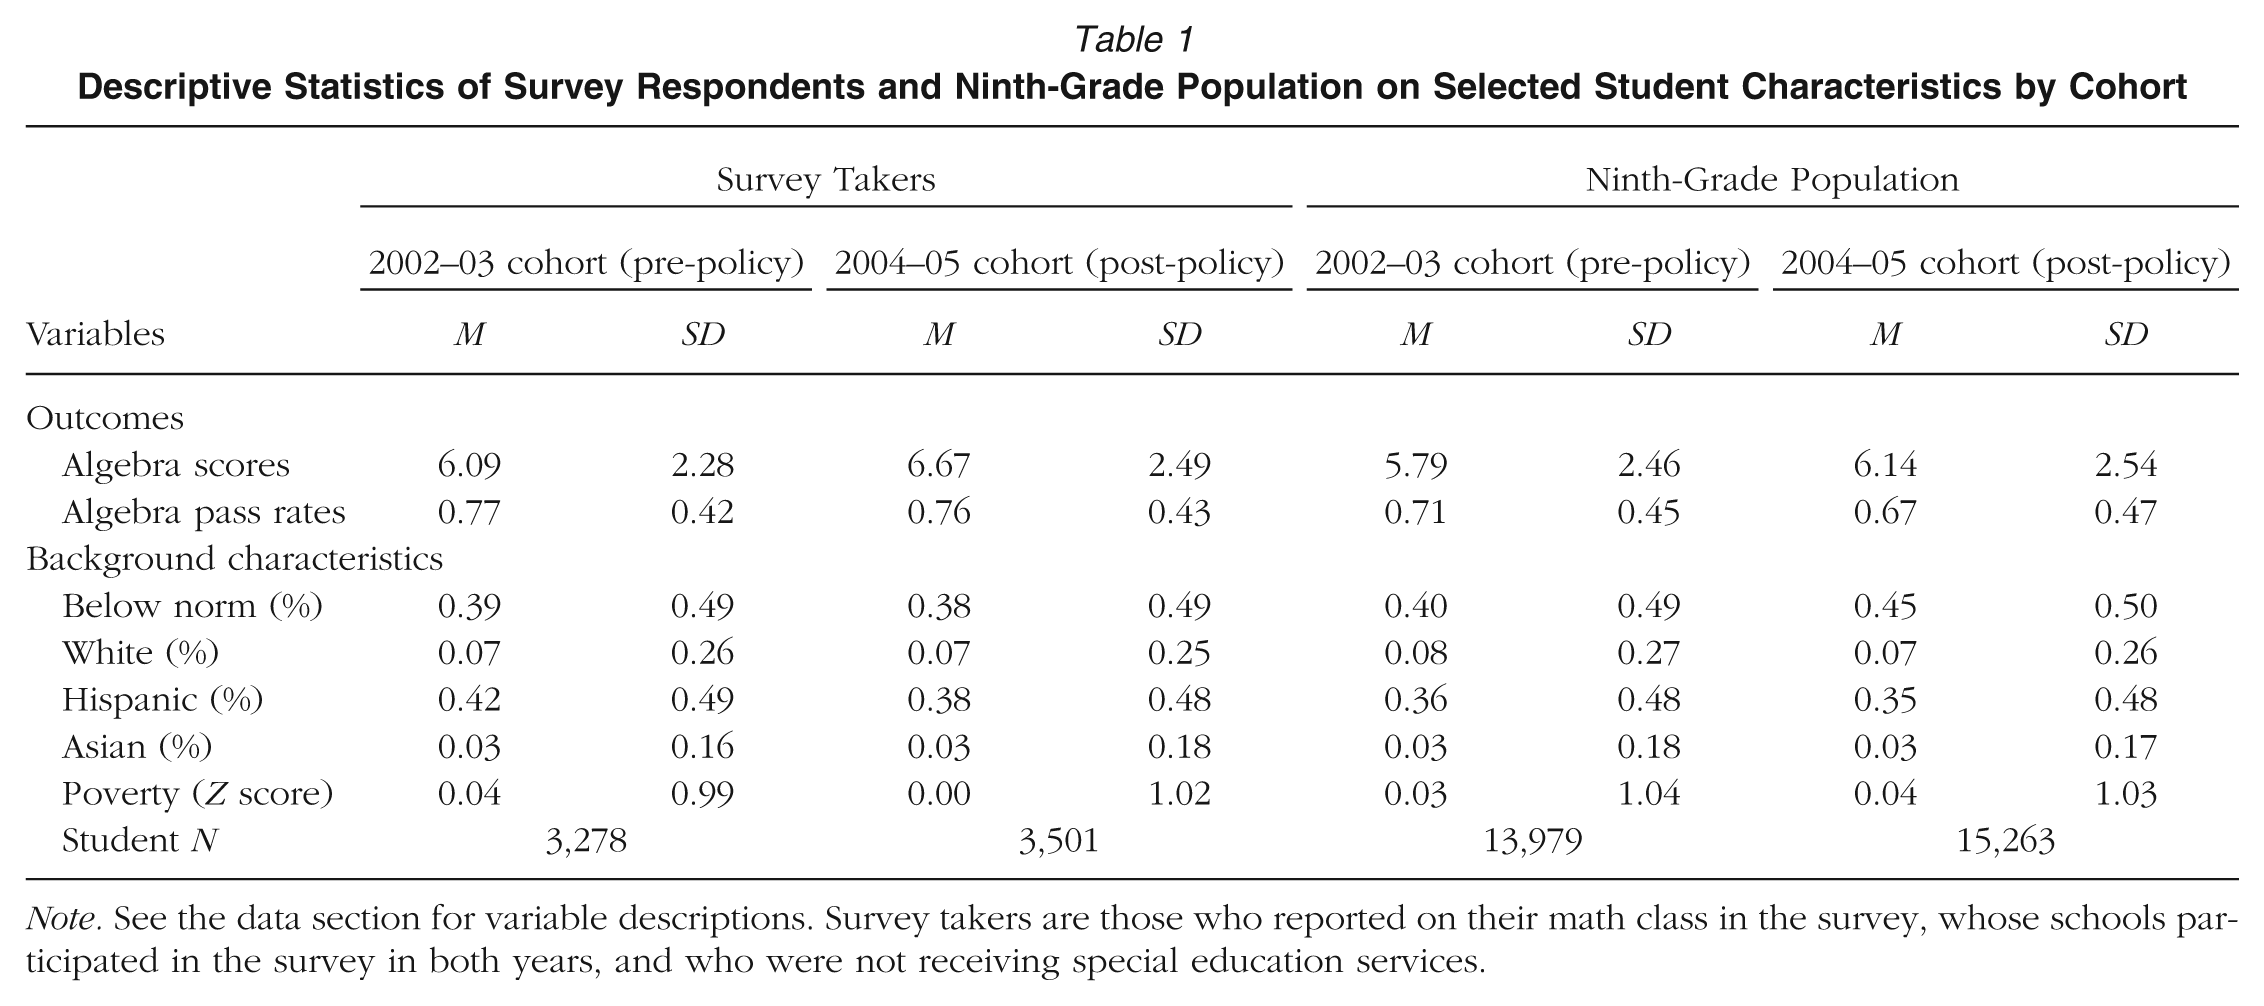
Note. See the data section for variable descriptions. Survey takers are those who reported on their math class in the survey, whose schools participated in the survey in both years, and who were not receiving special education services.
To address these concerns, we examined the potential for response bias by replicating the analyses of compositional effects with the population of CPS students (not just survey takers), where the data permitted (i.e., with the variables not obtained from surveys), to determine if the estimates were similar to those obtained when survey data were included. The results were similar, suggesting that bias due to cohort differences in survey response rates is small and the results based on survey respondents can be generalized to the general student population.
Measurement
Academic outcomes
Students’ academic outcomes include algebra test scores and failure in algebra. Algebra test scores come from a subset of the standardized math test (PLAN) developed by ACT, which was administered in October of 10th grade as part of the district accountability tests. The algebra subtest contains 22 multiple choice questions with five response categories each; raw scores are converted to a scale score ranging from 1 to 16. The national average PLAN algebra score is 8.2, with a standard deviation of 3.5. The content of the exam is based on surveys conducted by ACT, Inc. of high school teachers and includes problems found in first-year high school algebra classes (ACT, 2007). The average score on the subset for CPS sample was 6.0 with a standard deviation of 2.5. Course passing was a dichotomous variable where 1 indicated passing the primary algebra course (not the support course) in the first year of high school and 0 indicates failing the primary algebra course.
Entering math skills
Students’ entering math skills are based on their national percentile rank scores on the eighth-grade Iowa Test of Basic Skills in mathematics; these were the scores used to determine double-dose algebra enrollment in the district. However, eighth-grade ITBS percentile scores are not precise indicators of students’ skill levels as they do not distinguish students with very low and high skill levels due to floor and ceiling effects. Any one score is also apt to have measurement error—a student could have a good or bad testing day or get a problem right or wrong out of luck. Therefore, we also constructed a more precise measure of achievement using a vector of students’ ITBS scores from third through eighth grade, standardized to have a mean of 0 and standard deviation of 1 (hereafter called their latent scores). 11
Classroom composition
We measured classroom academic composition as the average of students’ eighth-grade latent math scores in their algebra classes. This variable captures the average initial skill levels of students in algebra classes upon entering high school. In addition, we created two dichotomous variables indicating students’ skill levels relative to the classroom average skill levels. One variable indicates whether students’ incoming skills were well below their classroom average, where a value of 1 indicates the student was at least 0.25 standard deviations below the classroom average skill level and 0 otherwise. The other variable indicates whether students’ incoming skills were well above their classroom average where a value of 1 indicates the student was at least 0.25 standard deviations above the classroom average skill level and 0 otherwise.
To capture the effects of the alternative implementation of the policy (mixed-ability classrooms with an extra algebra class for those with below-norm skills), we created a set of dummy variables, indicating enrollment in a class with both below- and above-norm students post-policy. Below-norm students are coded as 1 if they had any classmates who did not take double-dose algebra and 0 if all of their classmates took double-dose algebra. Above-norm students were coded 1 if their algebra classes had any students taking double-dose algebra and 0 otherwise.
Instructional climate
Classroom instruction is widely acknowledged to be a complex process, but there are several key aspects that have been shown to affect student learning and that we use to measure instructional quality in this study. Studies of classroom instruction have shown that classroom management (order and student behavior) and expectations (challenge and academic press) are perhaps the most important elements of the classroom for student learning (Bill and Melinda Gates Foundation, 2010; Kane, Taylor, Tyler, & Wooten, 2010). Thus, in this study, we examine academic demand, math pedagogy, and the behavioral climate in the classroom.
Measures of academic demand and pedagogical quality were constructed using students’ responses to survey questions about their math classes. The measure on academic demand captures how difficult/challenging students find their math class through a five-item scale (reliability = .76). A seven-item measure on interactive pedagogy captures the extent to which students are involved in interactive instructional activities consistent with the process standards of the National Council of Teachers of Mathematics, such as explaining and discussing how to solve a math problem to the class and writing math problems for other students to solve, as compared to listening to a lecture (reliability = .70). Students with high values on this measure are actively doing more math in their classes. Each measure is created at the student level through Rasch analysis, which allows values to have consistent meaning with different administrations of the survey. The specific questions that comprise each measure are provided in Appendix B (in the online journal).
To capture classroom behavioral climate, we created a measure of the concentration of students with disciplinary problems and absentee problems in each classroom. Classroom disciplinary problems come from students’ survey responses on incidence of disciplinary actions. The student measure was first created through Rasch analyses using survey items and then aggregated as a classroom average for the analyses. Classroom absence was constructed by first calculating the total number of absent class periods per semester in the ninth-grade year for each student, across all of their classes, then averaging the total number of absent days among all students in the class. 12 Thus, it captured the degree to which the class had students who were generally absent across all their classes, not just math. We also examined a measure of students’ reports of interactions among their classroom peers, such as whether students help each other learn, treat each other with respect, or put others down (reliability = .55). See Appendix B in the online journal for the items in this measure.
Other student control variables include a dummy variable for gender and a set of dummy variables on race/ethnicity distinguishing African American, Hispanic, White, and Asian students. Two measures of socioeconomic status (SES) variables were constructed using the block-level 2000 U.S. census data, linked to students’ home addresses; neighborhood poverty is a composite of the male unemployment rate and the percentage families under the poverty line, and social status is a composite measure of average educational attainment and percentage of employed persons who are managers, executives, or professionals. 13 Each SES measure was standardized. Prior school mobility is measured by a set of dummy indicators distinguishing no moves (omitted category), moving once, and moving twice or more in the 3 years prior to entering high school (other than moves that were naturally occurring due to school grade structure). Age at entry into high school is measured by three variables—number of months old for entering high school, a dummy variable indicating if students are slightly old, and a dummy variable indicating if students are young for starting high school.
An additional variable controlled for any changes in the skill levels of incoming cohorts in each school over time. It was constructed by taking the average of student latent math scores for each school in each year.
Analytic Strategies
The analyses for this study use a cohort design, comparing pre- and post-policy cohorts, combined with a regression discontinuity. Models were constructed to compare changes in outcomes between students who were just below the 50th percentile cutoff score and those who are just above the cutoff score (i.e., a difference-in-difference approach). The models show the extent to which the policy had differential effects for below-norm students who took double-dose algebra and above-norm students who took regular algebra among students who looked similar in all other respects (with test scores just above or below the cutoff). Among pre-policy cohorts, there should not be a discontinuous relationship between ITBS scores and outcomes at the cutoff score. If the policy had an effect on students’ outcomes, there should be a discontinuous relationship post-policy that is observed at the cut-point for double-dose algebra eligibility. If we see this discontinuity, it increases our confidence that the differences observed between cohorts are due to the policy, and not to some other changes that occurred in the district at the same time.
These models were run in two ways. First, we used a regression discontinuity model, regressing the outcome (e.g., students’ academic and instructional outcomes) on their eighth-grade math percentile score with variables included to discern the discontinuity at the 50th percentile, both pre-policy and post-policy. However, interpretation of the coefficients was difficult with this method, as it had multiple embedded comparisons (pre- and post-policy and above and below the cutoff). Therefore, for ease of interpretation, we present the results from models that split the analyses into separate sets for students with above- and below-norm incoming skills. The conclusions are the same with both methods. We estimate the following basic models separately for above- and below-norm students:
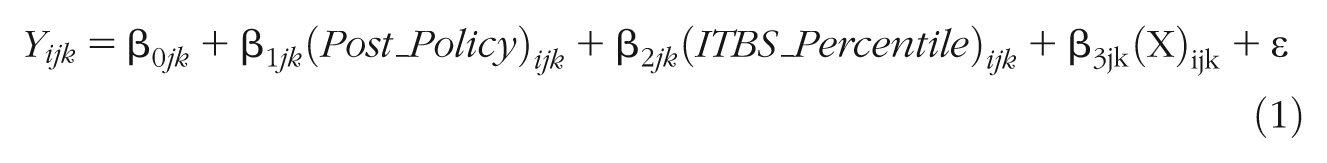
where Y is an outcome for student i in classroom j in school k; Post_Policy is a dichotomous variable denoting whether students are post-policy cohorts; ITBS_Percentile indicates students’ percentile scores on the eighth-grade ITBS; X is a vector of control variables, including students’ sociodemographic variables and cohort average skill levels; and ε summarizes student, classroom, and school error terms.
We center students’ eighth-grade math scores around the 50th percentile in both sets of analyses so that the intercept represents students at the cutoff, providing similar interpretations as the regression discontinuity design. Although the conclusions are the same as with the combined regression-discontinuity models, the coefficients from separate models are much easier to interpret (the original analyses are available from the authors). The post-policy coefficient β1 can be interpreted as the policy effect for each group of students (above and below norm). All analyses include control variables for students’ background characteristics. Variables on peer skill levels were added to the basic models to examine their relationships with the outcomes.
Results
Classroom Compositional Effects on Algebra Test Scores
Table 2 presents analyses showing the extent to which post-policy improvements in test scores can be explained by changes in peer composition due to intensified sorting or by the alternative model of heterogeneous classes with support for low-skill students. The models predict algebra scores with a variable representing the 2004 (post-policy) cohort (Model 1) and sequential controls for classroom composition (Model 2) and whether it was a heterogeneous class with support (Model 3). The top half of the table shows coefficients from models of students with above-norm incoming skills; the bottom half shows coefficients from models with below-norm incoming skills. All models controlled for students’ own incoming math skills and demographic characteristics (coefficients not shown but available from the authors).
Coefficients From Models Predicting Algebra Test Scores
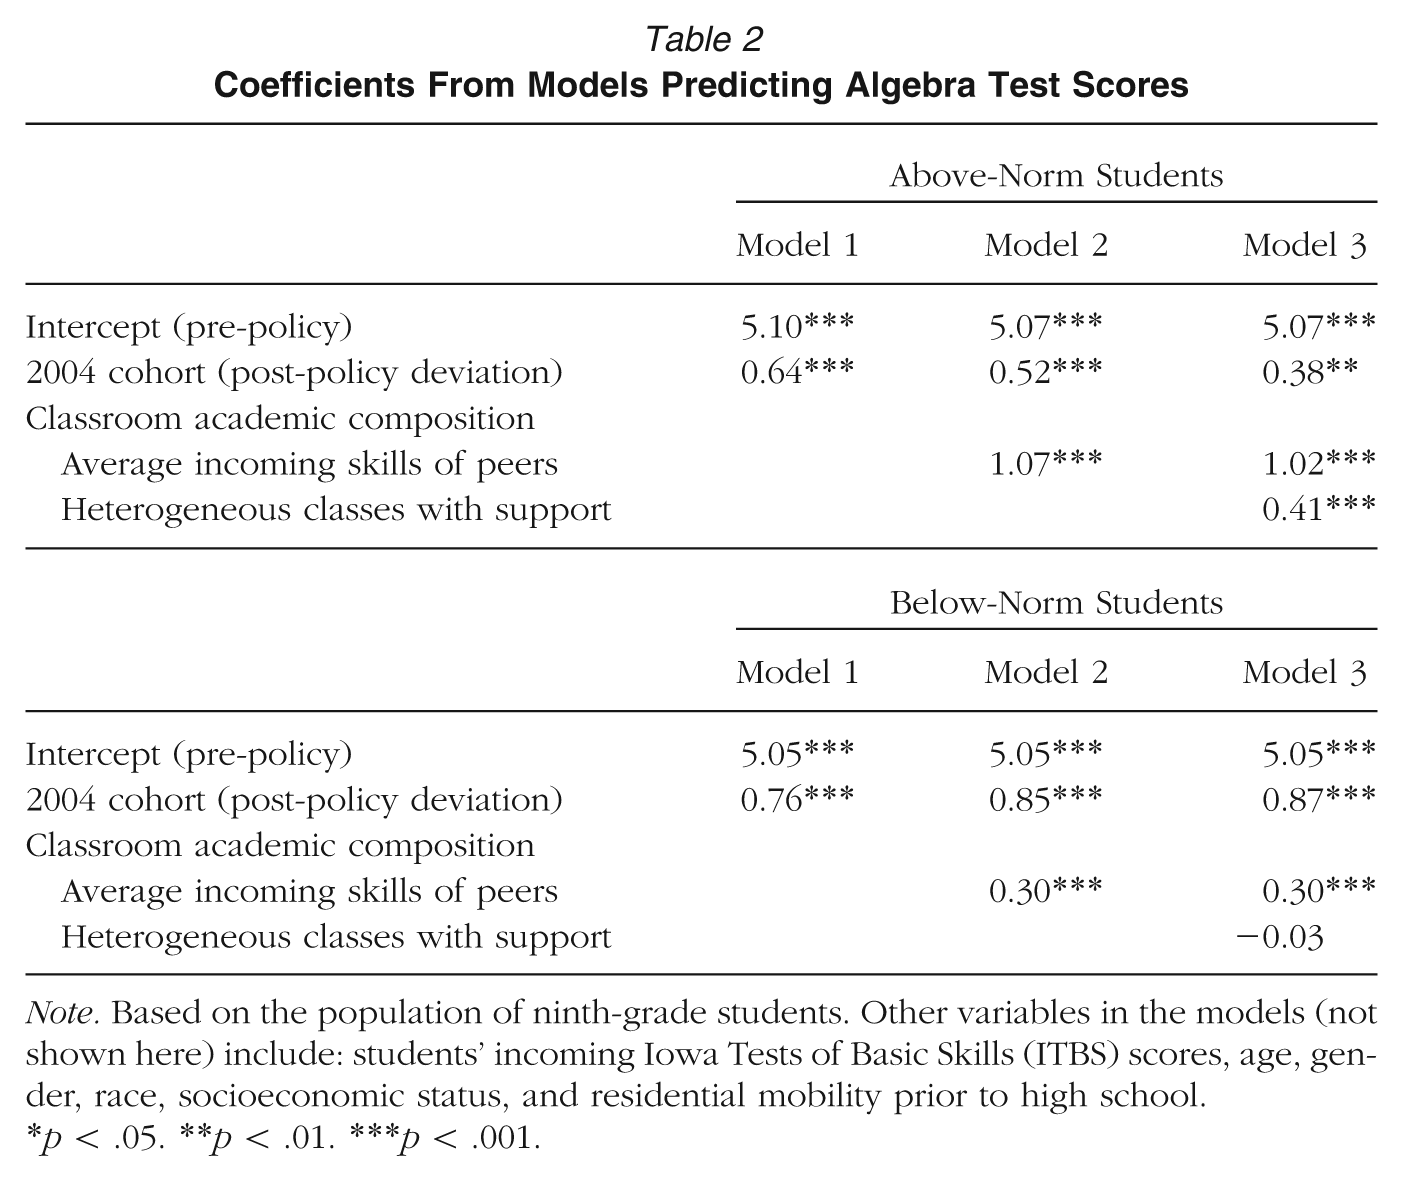
Note. Based on the population of ninth-grade students. Other variables in the models (not shown here) include: students’ incoming Iowa Tests of Basic Skills (ITBS) scores, age, gender, race, socioeconomic status, and residential mobility prior to high school.
p < .05. **p < .01. ***p < .001.
Classroom peer skill levels explain about 20% of the improvements in test scores among students with above-average incoming skills; including peer average skill levels in the model reduces the coefficient representing the 2004 cohort from .64 to .52. The relationship between peers’ incoming skills and students’ subsequent test scores is strong for above-norm students; a one standard deviation improvement in peers’ incoming skills is associated with an increase in test scores of 1.07 points (about 0.46 standard deviations in test scores). Students with above-average incoming skills post-policy had higher test scores in algebra than the pre-policy cohort partly because they took algebra with higher achieving students. We examine mechanisms for these peer effects later in this article.
Model 3 in Table 2 shows the degree to which students with above-average incoming skills benefited from having classmates who took support courses after controlling for the classroom average incoming skills—this is the alternative method of providing double-dose algebra that did not completely sort students. We might expect that teachers would not only tailor instruction based on students’ incoming skills, but also adjust instruction as students made progress. Thus, if taking support coursework facilitates learning for students with low initial skills, and teachers adjust instruction accordingly, students with above-average initial skills would benefit from having classmates who took algebra support courses even though those peers initially brought down the average incoming skill levels of the class. In fact, post-policy test score improvements were greater by .4 points for above-norm students who had classmates taking support courses, compared to above-norm students who did not have any such classmates (p < .01), controlling for the initial classroom average skills. Adding this variable further explains the post-policy rise in test scores for above-norm students by an additional 22% (dropping to .38). About half of the improvements in test scores among students with above-average initial skills remain unexplained by the structure of classrooms.
Algebra test scores also improved for students with below-average skills even though they took algebra with lower achieving peers post-policy, compared with students with similar incoming skills pre-policy (see bottom panel in Table 2). In fact, their scores improved more than would be expected, given that they had lower skill peers post-policy than similar students had pre-policy. (The coefficient rises from .76 to .85 once peer skill levels are controlled for). This is consistent with the hypothesis that the additional supports provided by the policy—double instructional time and resources for support course teachers—led to higher test scores. As shown later in this article, instructional practices did change considerably for students in double-dose classes.
Table 2 also shows that although peer skill levels are positively related to test scores for both below- and above-norm students, peer skill levels matter much less for the achievement of below-norm students than for above-norm students; the coefficient on peer skill level for below-norm students is only one third of the coefficient for above-norm students (0.30 compared to 1.07). In other words, students with higher initial skills benefit more from having higher skill peers than do students with lower initial skills, in terms of their subsequent test performance. 14 For this reason, the decline in peer skill levels only had a small negative effect on below-norm students’ test scores. Additionally, for below-norm students, post-policy test score improvements were similar for students attending heterogeneous classrooms and students in homogenous (all below-norm) classes. There is no statistically significant difference between heterogeneous classes with support and homogenous double-dose algebra classes (nonsignificant coefficient of −0.03).
Classroom Compositional Effects on Algebra Pass Rates
Despite improvements in algebra test scores, pass rates declined among above-norm students post-policy. At the same time, pass rates improved slightly among below-norm students. Table 3 displays coefficients from models that examine the effects of classroom composition on algebra pass rates. These models include the same variables as in Table 2. To test fish pond effects, we include additional variables representing students’ skills relative to their classroom peers—whether their initial skills were more than a quarter of a standard deviation above or below the classroom average incoming skill level.
Coefficients From Models Predicting Passing Algebra (in logits)
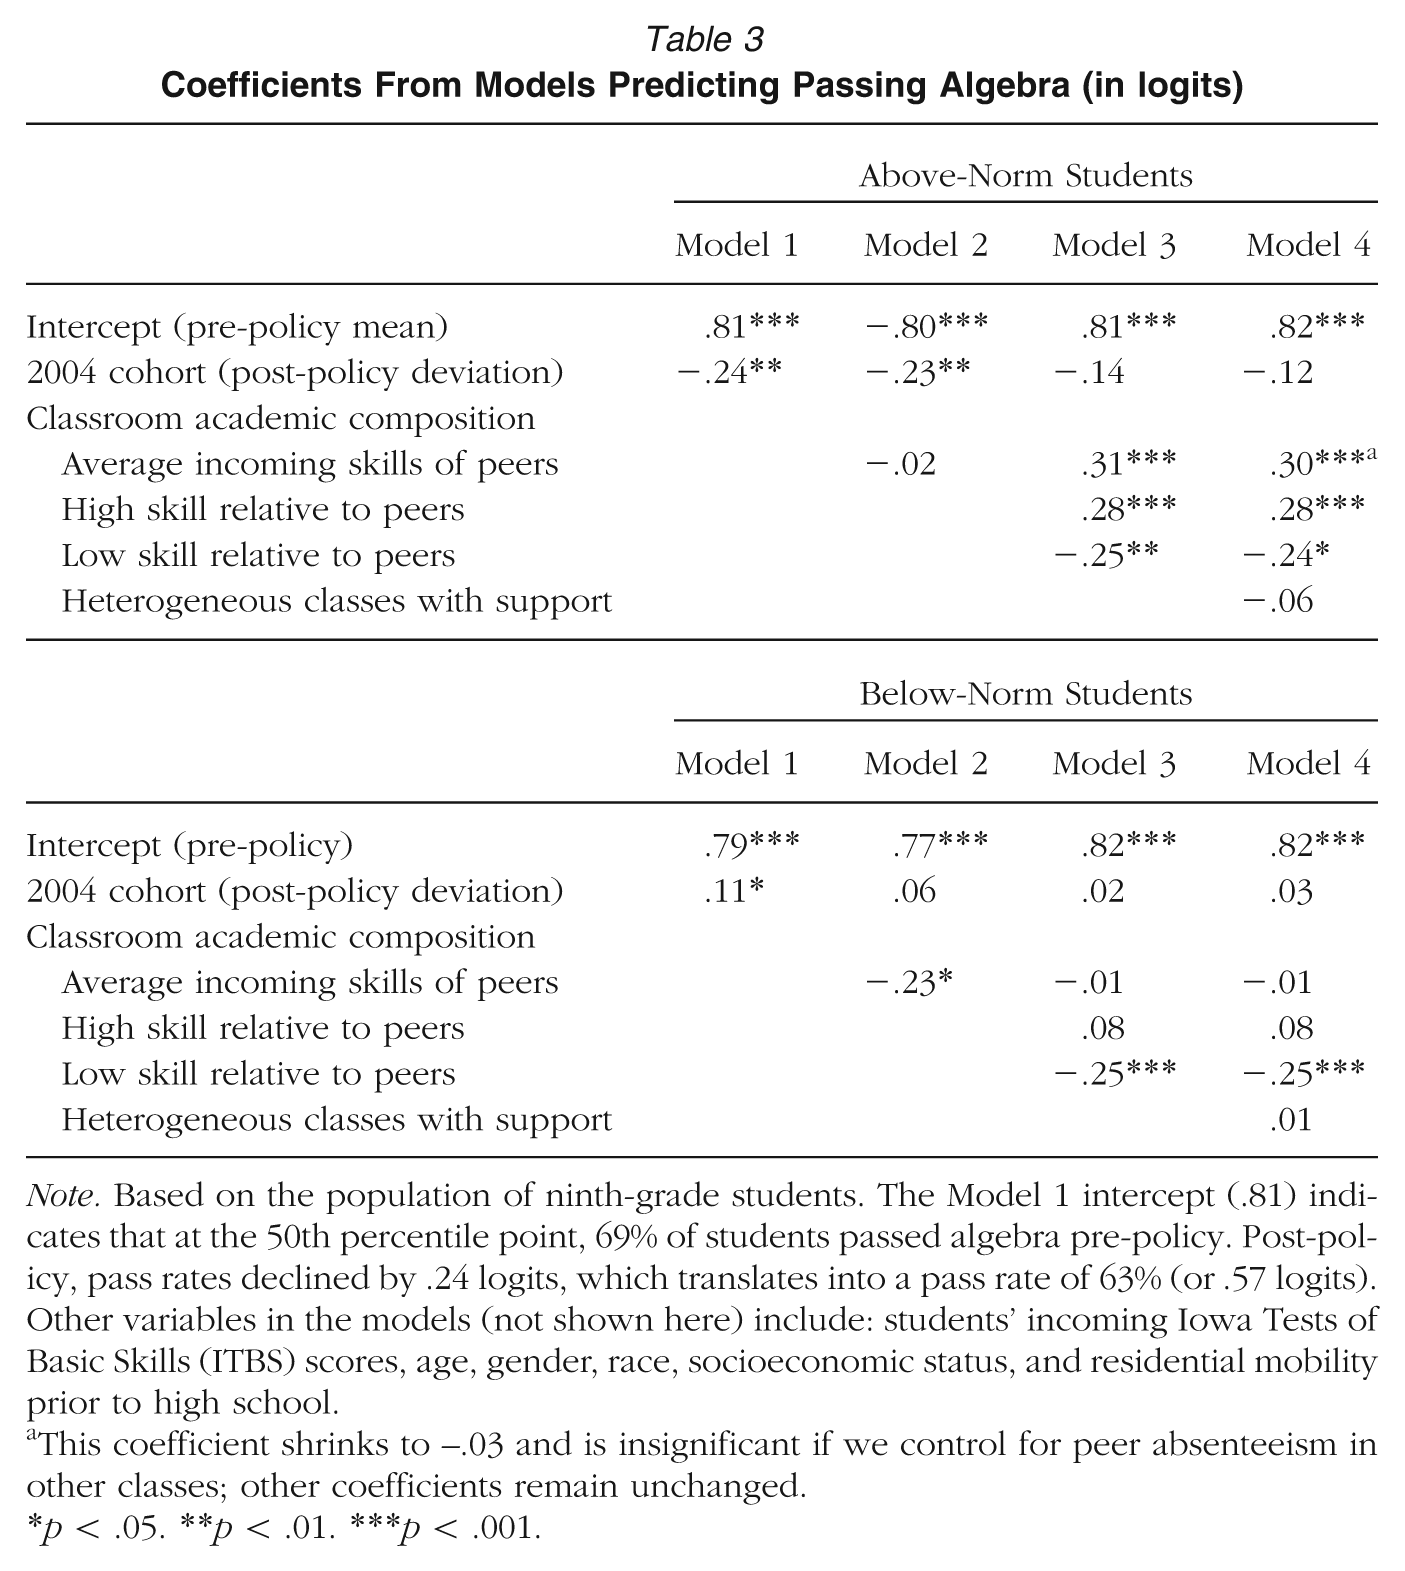
Note. Based on the population of ninth-grade students. The Model 1 intercept (.81) indicates that at the 50th percentile point, 69% of students passed algebra pre-policy. Post-policy, pass rates declined by .24 logits, which translates into a pass rate of 63% (or .57 logits). Other variables in the models (not shown here) include: students’ incoming Iowa Tests of Basic Skills (ITBS) scores, age, gender, race, socioeconomic status, and residential mobility prior to high school.
This coefficient shrinks to −.03 and is insignificant if we control for peer absenteeism in other classes; other coefficients remain unchanged.
p < .05. **p < .01. ***p < .001.
For above-norm students with ITBS scores just at the 50th percentile, the intercept that represents the pre-policy algebra pass rate was .81 logits; that translates into a pass rate of 69%. Their pass rates declined post-policy by .24 logits to .57 logits, or 63%. Among above-norm students, the decline in pass rates shrinks from −.24 to −.14 logits, and is no longer significant, only after we control for students’ skills relative to classroom peers (see Model 3). The likelihood of passing decreases if students have substantially lower initial skills than their classroom peers (coefficient of −.25), while the likelihood of passing increases if students have stronger skills than their classmates (coefficient of .28). The policy raised the average skill level of classroom peers by sorting students based on incoming math scores, making above-norm students less likely to be at the top of their class and more likely to be at the bottom of their class. It is these changes in relative skill levels that led to lower pass rates among students with above-average initial skills. Additionally, after controlling for students’ relative skill levels, classroom average skill level has a positive relationship with pass rates (coefficient of .31), indicating that the classroom average pass rates are higher in classrooms with higher average skill levels, controlling for students’ relative skills. An additional analysis (not shown) indicated that these positive relationships are explained by the fact that classrooms with higher average skills have fewer students with attendance and discipline problems. 15
The small increase in pass rates among below-norm students was also a result of the change in their skills relative to classroom peers. Their pass rates increased from .71 logits pre-policy (69 percent) to .88 logits (71 percent) post-policy (see Model 1 in the lower panel). As shown under Model 3, below-norm students were less likely to pass if their skill levels were well below the classroom average (coefficient of −.25). As discussed earlier, relative skill levels of below-norm students improved post-policy (i.e., they were less like to be well below their classmates than pre-policy below-norm students), so their pass rates improved. Unlike students with above-norm skills, there was no relationship between classroom average skill level and the average pass rates once students’ relative skills were controlled (coefficient of −.01). While the classroom average skill by itself has a negative relationship (coefficient of −.23), suggesting that students are less likely to pass in classes with higher skill peers (Model 2), this relationship disappears once differences in students’ relative skill levels are taken into account.
The alternative model of heterogeneous classrooms with a second support class did not explain post-policy changes in pass rates for below-norm students or above-norm students. The coefficient is small and not significant for both groups (−.06 for above-norm students and .01 for below-norm students with p > .10).
A supplemental analysis compared grading practices between double-dose and regular algebra teachers 1 year before the policy to determine whether declines in algebra pass rates for above-norm students could have occurred as a result of differential grading practices between the teachers assigned to double-dose algebra versus regular algebra teachers (i.e., teachers with tougher grading practices might have been assigned to regular algebra classes). The results (available from the authors) showed no differences in the pre-policy grading practices between teachers who taught regular algebra and those who taught double-dose algebra post-policy; there were no differences in the rates at which they assigned high grades of A or B or failed students pre-policy, controlling for students’ incoming skills and other background characteristics and classroom average skills.
Policy Effects on Classroom Climate and Instruction
The policy should have affected students’ academic outcomes by changing their instructional experiences, either through the instructional support offered to double-dose students and teachers or through changes in the composition of classroom peers. Table 4 shows the ways in which classroom instructional environments changed with the policy, in terms of academic demand, interactive pedagogy, peer interactions, and the clustering of students with disciplinary and absentee problems. Once again, models were run separately for below- and above-norm students, but incoming test scores were centered at the 50th percentile so that the intercept represents students just above and below the eligibility cutoff. Model 1 shows whether the instructional environment changed post-policy, while Models 2 and 3 show whether these changes are explained by the average classroom skill level or being in a mixed-ability class where low-skill students took a supplementary algebra class. Only the pertinent coefficients are displayed, but full models are available from the authors.
Pre- and Post-Policy Changes in Instruction/Classroom Environment
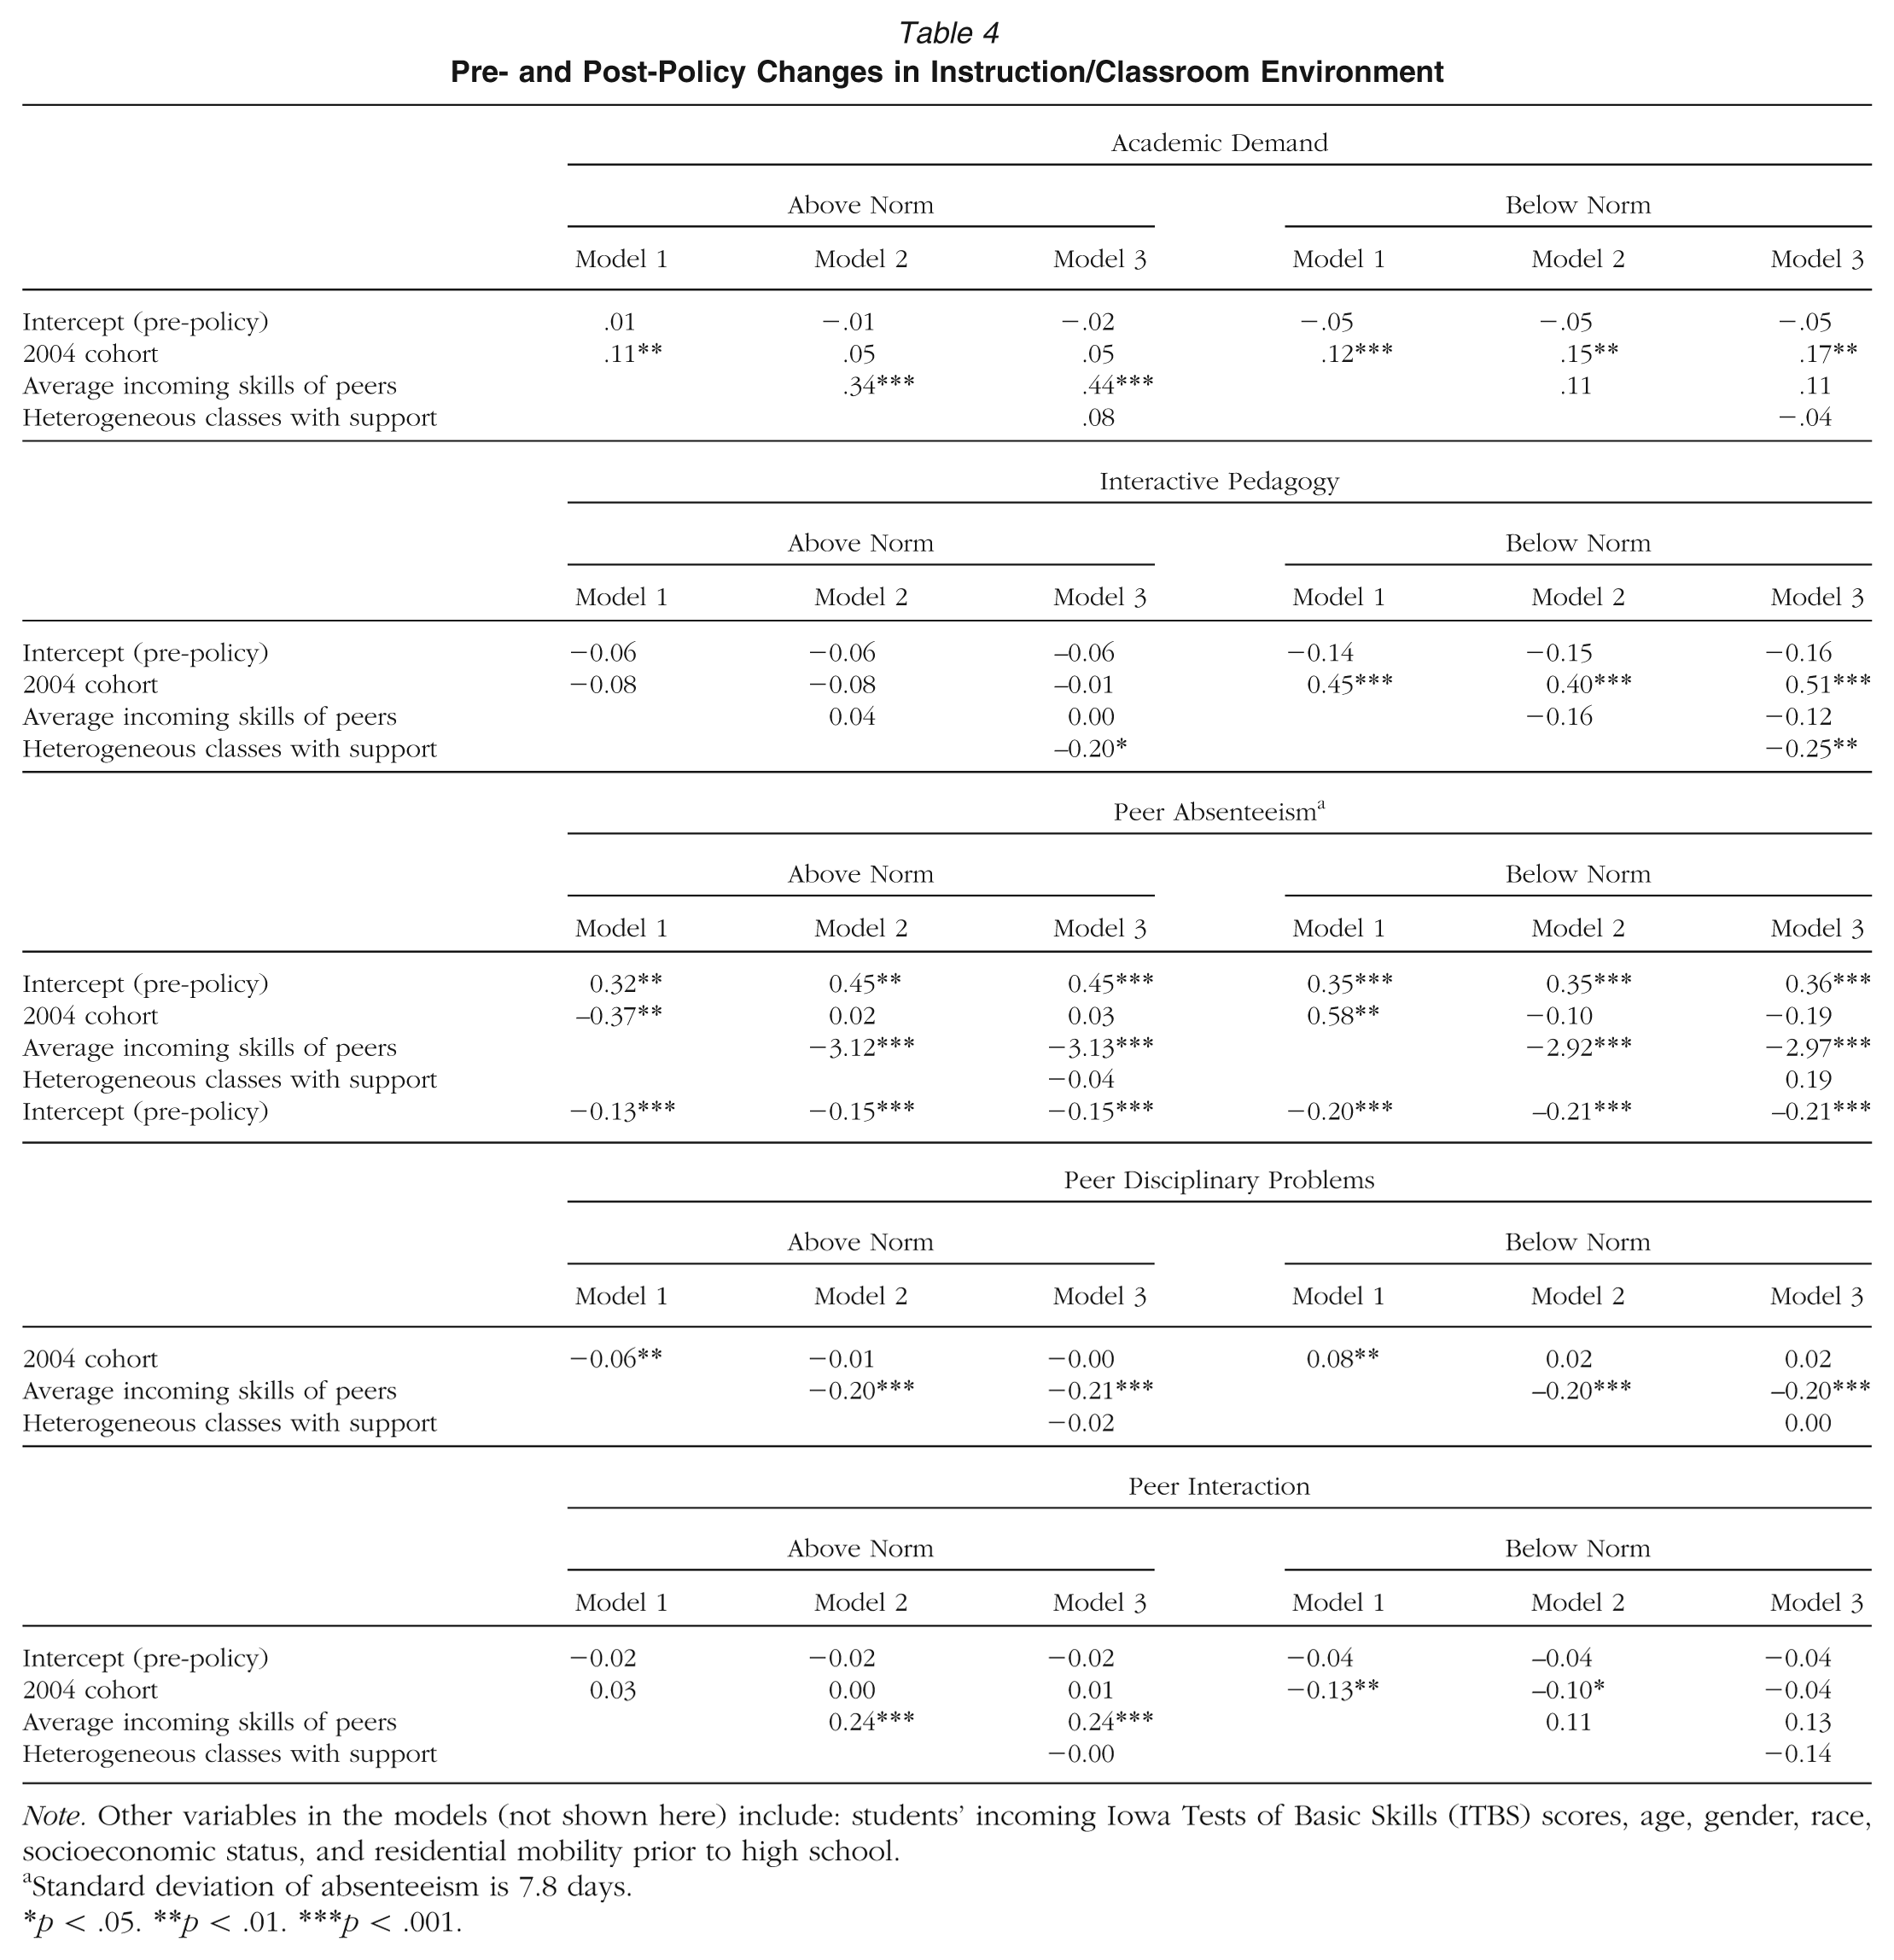
Note. Other variables in the models (not shown here) include: students’ incoming Iowa Tests of Basic Skills (ITBS) scores, age, gender, race, socioeconomic status, and residential mobility prior to high school.
Standard deviation of absenteeism is 7.8 days.
p < .05. **p < .01. ***p < .001.
Academic demand increased for both above-norm and below-norm students with the policy. Post-policy, above-norm students reported greater academic demand by .11 standard deviations, compared with their pre-policy counterparts, while below-norm students experienced an increase of .12 standard deviations. For above-norm students, the increase in academic demand is completely explained by the increase in average peer skill levels. This is consistent with the idea that teachers adjust classroom demands based on their assessments of students’ skills, so that classes become more demanding when there are higher skill students. For below-norm students, academic demand increased despite declines in peer skill levels; when classroom composition is taken into account, the size of this coefficient becomes slightly larger. In addition, peer skill level had a much weaker relationship with perceptions of academic demand for below-norm students than above-norm students (.11 compared to .34 in Model 2).
For below-norm students, greater academic demand was likely attributable to changes in instruction that resulted from the professional development and instructional resources available to teachers and changes in teachers’ expectations that occurred with additional instructional time. Although we do not have measures of all aspects of instruction that might affect the degree to which students were challenged (e.g., content, pacing, and cognitive demands), we do see substantial changes in what double-dose students were doing in their math classes. As shown in Model 1, there was almost a half standard deviation increase in the degree to which below-norm students were engaged in interactive pedagogical practices post-policy (coefficient = .45, p < .001). This is consistent with the district report that teachers felt more comfortable trying new instructional practices when they had extended instructional time and professional development about how to use it. The increase in use of interactive pedagogy may also explain why below-norm students reported more demanding work post-policy; additional analyses show that students in classrooms with more frequent use of interactive pedagogy also report greater academic demand, both pre- and post- policy. 16
The increases were particularly strong for students who were in homogenous double-dose algebra classes (coefficient = .51, p < .001); below-norm students in heterogeneous classes experienced much smaller increases in the use of interactive pedagogy (coefficient = −.25, p < .01). 17 This is also consistent with the district report that teachers felt more comfortable engaging in more innovative student-centered practices when they did not have to worry about time constraints—the homogenous classes were more likely to be true double-period classes, rather than two classes split between periods. Above-norm students did not experience increases in the use of interactive pedagogy with the policy, as expected. However, as with below-norm students, those in heterogeneous classes post-policy experienced fewer interactive pedagogical practices than typical (coefficient = .20, p < .05). It is possible that teachers found it more difficult to implement student-centered pedagogy in more heterogeneous classes.
While students in double-dose algebra received more challenging and interactive instructional practices than similar pre-policy students, declines in peer skill levels created greater concentrations of students with attendance and behavioral problems in their algebra classes. Peers in double-dose algebra were more likely to be absent from school (coefficient = .58, p < .01) and have disciplinary problems (coefficient = .08, p < .01) than classmates in pre-policy algebra classes. These increases in disciplinary and absentee problems were explained by declines in peer skill levels; once peer average entering skill levels are controlled, the post-policy coefficients are no longer significant (Model 2). Post-policy, above-norm students’ peers had much lower absence rates and disciplinary issues than similar students pre-policy, and this was also completely attributable to the change in entering skill levels of their classmates.
The quality of peer interactions, in terms of peer support and respect, changed only slightly post-policy, and only among below-norm students; they experienced slightly lower quality of interactions with peers. This small decline in peer interactions only occurred among students in the heterogeneous model, which mixed above- and below-norm students together. The post-policy coefficient becomes small and insignificant once we control for being in a heterogeneous class (Model 3). Below-norm students in heterogeneous classes post-policy felt slightly less supported by classroom peers than other students and it explained post-policy differences, although the coefficient was not statistically significant.
To understand the degree to which these changes in classroom environment and instruction matter for students’ academic outcomes, we examined relationships between instructional environment and students’ outcomes, separately for below-norm and above-norm students (Table 5). Academic demand is more strongly related to test scores among above-norm students than below-norm students, suggesting that higher skill students are better able to respond to greater challenges. The policy led to higher academic demands for above-norm students, which helped improve their test scores. Below-norm students’ scores did not seem to benefit as much from the increase in academic demands; however, they experienced very large increases in engagement in math through interactive pedagogy, which itself was related to higher test scores. The use of interactive pedagogy is associated with higher test scores for all students, although below-norm students were the only students that experienced increases in the use of interactive practices post-policy.
Relationships of Classroom Environment With Academic Outcomes
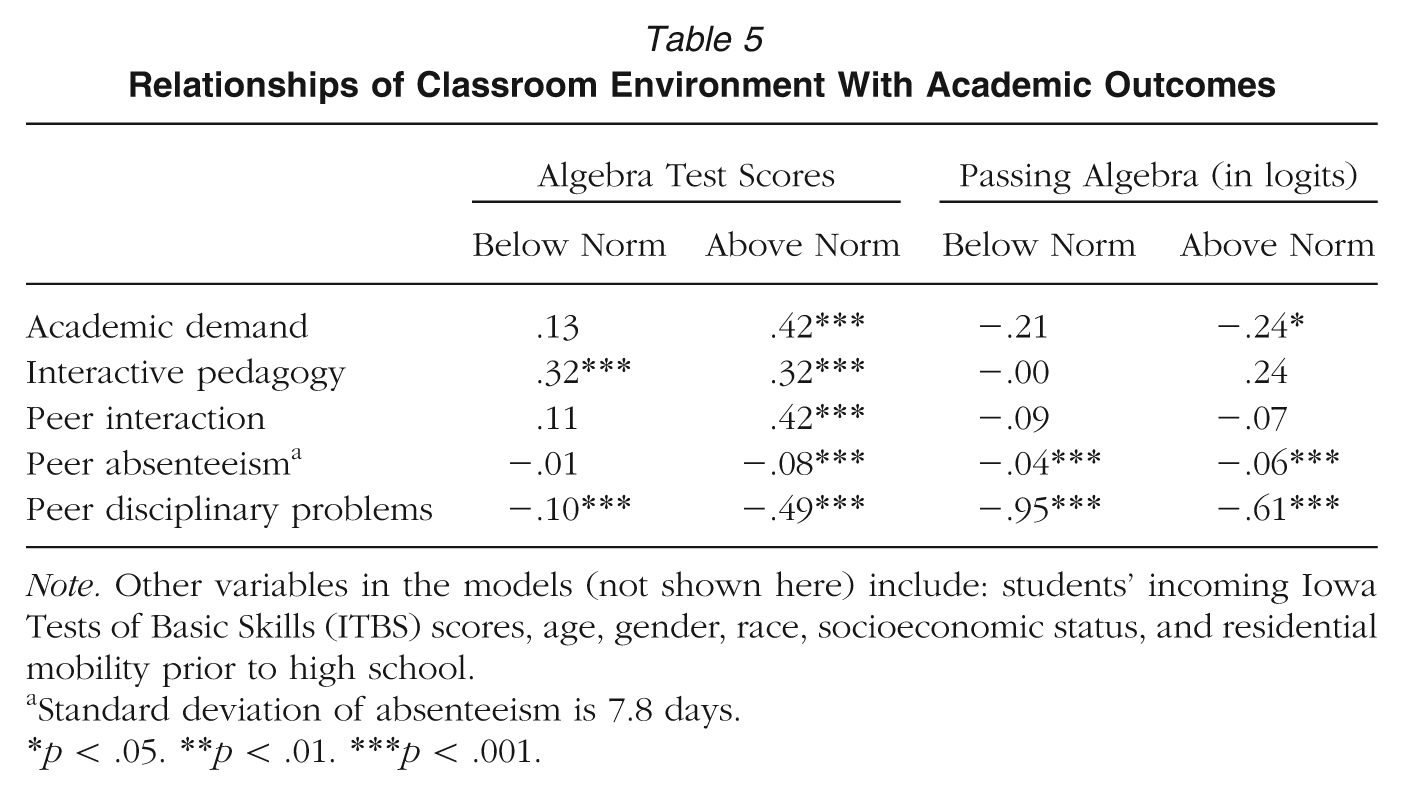
Note. Other variables in the models (not shown here) include: students’ incoming Iowa Tests of Basic Skills (ITBS) scores, age, gender, race, socioeconomic status, and residential mobility prior to high school.
Standard deviation of absenteeism is 7.8 days.
p < .05. **p < .01. ***p < .001.
While academic demand is associated with higher test scores, students are less likely to pass in more demanding classes. The coefficients are similar between below-norm and above-norm students (−.21 and −.24, respectively) although the coefficient for below-norm students did not reach statistical significance. As shown earlier, the decrease in algebra pass rates was associated with the change in students’ incoming skills relative to classroom peers. Above-norm students were more likely to have low skills relative to their classroom peers post-policy. Additional analysis showed that students with lower skills relative to their peers perceived their classes to be more demanding, and this partly explains why above-norm students have lower pass rates post-policy.
Test scores and pass rates were also related to the concentration of peers with absence and disciplinary issues. Both students’ test scores and pass rates are lower the more that their classroom peers have high rates of absence and disciplinary records. As seen with classroom composition, above-norm students’ test scores are particularly sensitive to changes in classroom peers with absentee and disciplinary problems. Also, it seems that above-norm students’ pass rates declined post-policy because the benefits of having fewer classmates with behavior problems were offset by the higher likelihood of being in the bottom of their class and the increased academic demands. Similarly, for below-norm students, the detriments of having more peers with attendance and discipline problems were countered by the lower likelihood of being in the bottom of their classes, so that pass rates did not decline.
Conclusions
Improving algebra learning and reducing algebra failure is a challenging task faced by districts throughout the country. Chicago, like many other school districts, tried to address the problem through doubled instructional time. Although test scores improved substantially, the policy was viewed as a failure in Chicago because the overall pass rates did not improve. This study shows why this happened and suggests how the current practices might be modified to improve both pass rates and test scores. This study also provides a deeper understanding of the effects of sorting on students’ academic outcomes than has been identified in prior work on tracking/detracking. The effects of sorting are not the same for high-skill and low-skill students; nor are the effects the same for skill development as for passing. Furthermore, it is not just students’ absolute skill level that affects their likelihood of passing algebra, but their skills relative to their classroom peers. By understanding these nuances, we can address the problems that accompany decisions to sort students by their skills or to mix students of varying skills together.
Sorting was one source of test score improvements for above-norm students. Students with strong incoming skills are particularly responsive to improvements in peer skill levels and greater academic challenges resulting from taking algebra with high-skilled peers, in terms of their test scores. While both high- and low-skill students learn more in classrooms with more high-skill peers, test scores are much more strongly related to classroom academic composition and perceptions of academic demand for high-skill students. This also makes intuitive sense—a high-skill student may be more likely to recognize differences between a highly difficult class and a moderately difficult class, while a low-skill student might struggle equally in either class. Thus, mixing students of varying skill levels together can have substantial negative effects on learning among high-skill students while only modestly improving the learning of low-skill students. This is further supported by other recent research that shows stronger peer effects on high-achieving than on low-achieving students (Imberman, Kugler, & Sacerdote, 2009; Loveless, 2009). This is also consistent with the findings of earlier research on a universal algebra policy, showing that expanding algebra coursework to low-skill students alone did not improve their academic outcomes, while high-skill students were negatively affected by declines in peer skill levels due to detracking of a math curriculum (Nomi, 2012).
Sorting was not the only source of test score improvements for above-norm students, however. Some above-norm students took algebra in mixed-skill classrooms where students with weak skills received a second period of algebra instruction. Above-norm students in these classrooms also benefitted from this model; their test scores improved and they experienced greater academic demand. This is likely because their peers who initially had low skills made progress by taking the second algebra class; thus, they did not hold back the pace of the class. The benefits from this alternative model were as strong as the benefits from sorting for above-norm students. This suggests that both high-skill and low-skill students can benefit by offering additional support to low-skill students.
For low-skill students, double-dose algebra benefited their test scores, even though peer skill levels declined considerably for most students with low skills. One key aspect of the Chicago policy that differs from traditional tracking or detracking is that all students took algebra, regardless of their skill levels. Furthermore, supports were provided to low-skill students and their teachers, including doubled instructional time, professional development, and instructional resources. Teachers in double-period classes used more interactive pedagogy, and these aspects together helped boost test scores. In other words, the potential negative effects of sorting on low-skill students were offset because they received more resources than high-skill students, through better instruction and additional instructional time. While an inequitable distribution of resources may seem unfair, in the end, this strategy was effective for boosting the algebra scores of both low- and high-skill students.
However, double dose implementation had problematic effects on course passing rates for both low- and high-skill students. For high-skill students, improvements in peer skill levels increased their risk of course failure, despite improvements in test scores. Students with above-norm skills—particularly those just above the national average in entering skills—were more likely to become the lowest achieving students in their classes and more likely to struggle once their classes became more difficult.
Increases in failure rates is a large concern particularly in urban districts because course failure is a leading indicator of eventual dropout—each semester course that a student fails in ninth grade increases the probability of dropping out by about 15 percentage points, regardless of whether they have high or low test scores (Allensworth & Easton, 2007). In Chicago, one-fifth of students with test scores in the top national quartile are off-track to graduate by the end of the ninth grade (Allensworth & Easton, 2005). Thus, while average- and high-skill students are often not the focus of interventions around failure, they also need close monitoring if they have low skills relative to classroom peers. Increasingly, schools are using data to identify students at risk of failure and in need of intervention. This suggests a different rubric for identifying students at risk of failure—not just by their absolute skills but by whether they have particularly low incoming skills relative to their classroom peers.
For below-norm students, sorting is problematic because it concentrates together students with behavior problems, such as high absenteeism and discipline infractions. The more students with behavioral problems are concentrated together, the lower students’ learning and the higher their failure rates. Classroom behavior problems tend to affect all students in the class as behavior problems present difficult conditions for teaching. Teachers in low-skill classrooms often struggle with classroom management and attendance problems, and these struggles prevent them from being able to teach effectively (see Page, 1987). The double-dose algebra policy did not address classroom behavior problems associated with low-skill classrooms. For teachers in classrooms with many low-skilled students, it is critical to provide classroom management supports as well as instructional supports.
At the same time, the heterogeneous model is not clearly preferable for students with below-average skills. For example, the quality of algebra instruction was lower in the heterogeneous classes; teachers were less likely to use student-centered teaching practices. Also, creating greater heterogeneity increases the risk of failure for students with very weak skills as these students are most likely to be the lowest skill students in their classes. Thus, as with above-norm students in sorted classes, it is critical to carefully monitor students who have very low skills relative to their classroom peers and offer targeted support as soon as they show signs that they are struggling.
This study offers new insights on the issue of tracking and detracking. Tracking is often criticized for decreasing the opportunity to learn among low-skill students, despite advantages for high-skill students. By examining alternative models of sorting with supports, this study has demonstrated a number of important nuances in terms of how classroom composition affects student achievement, beyond benefits for high-skill students and detriments for students with low skills. Our findings stand in opposition to arguments that the elimination of curricular tracks in and of itself creates greater equality without compromising excellence. Other research has discerned many difficulties that accompany schools’ detracking efforts (Rubin, 2008; Wells & Oakes, 1996), and this study adds further evidence to this body of work.
To be certain, there are cases of successful detracking, where low-skill students learn more in heterogeneous classrooms without hurting the learning of high-skill students (Burris et al., 2006; Burris, Wiley, Welner, & Murphy, 2008; Gamoran & Weinstein, 1998; also see Bryk, Lee, & Holland, 1993, for the success of common academic curriculum in Catholic schools). However, these schools have done so carefully. For example, they allocated considerable resources to low-skill students, including time and professional development for their teachers, with strong principal leadership and support from teachers. In addition, they are typically well-resourced schools in suburban districts, which may not share characteristics of large urban schools, such as very large low-income and minority populations with academic and linguistic diversity.
However, our study suggests that such success could also be possible in schools in a large urban district if low-skill students and their teachers are provided with sufficient support. In Chicago, the heterogeneous classes seemed to promote student learning when low-skill students received supplemental algebra instruction, and this model tended to occur in schools with large low-income and minority populations. But it further suggests that schools pay careful attention to students with weak skills relative to classroom peers and provide support for management of attendance and discipline issues, as well as pedagogical coaching, in classes with large proportions of low-achieving students. In addition, professional development and resources can lead teachers to substantially improve their math instruction, in terms of adopting more student-centered and interactive practices. However, these improvements were likely to have occurred because teachers had flexibility in their use of time and recognized the need for different approaches for their students, as well as the resources and training to do so.
Footnotes
Notes
T
E
References
Supplementary Material
Please find the following supplemental material available below.
For Open Access articles published under a Creative Commons License, all supplemental material carries the same license as the article it is associated with.
For non-Open Access articles published, all supplemental material carries a non-exclusive license, and permission requests for re-use of supplemental material or any part of supplemental material shall be sent directly to the copyright owner as specified in the copyright notice associated with the article.