




Abstract
Considerable attention has been devoted to the resegregation of public schools over the 1990s. No research to date, however, has examined change in school segregation since 2000. Using the National Center for Education Statistics (NCES) Common Core of Data (CCD), we examine longitudinal trends in racial/ethnic segregation in 350 U.S. metropolitan areas from 1993 to 2009. We find that worsening segregation over the 1990s has given way to a period of modest integration among all racial/ethnic groups since 1998. However, decreases in segregation were smaller in the formerly de jure segregated South and in metropolitan areas with large increases in racial/ethnic diversity. In addition, since 1998, the relative importance of segregation among non-Whites has increased, while the proportion of segregation that lies across district boundaries has stabilized.
The decades following the triumphs of the civil rights movement and the seminal Brown v. Board of Education of Topeka (1954) ruling witnessed promising decreases in public school segregation, particularly for Blacks and in the formerly de jure segregated South (Iceland, Weinberg, & Steinmetz, 2002; Logan, Stults, & Farley, 2004; Orfield, 1983; Smock & Wilson, 1991; Timberlake & Iceland, 2007). Recently, however, researchers have expressed concern that the gains of the civil rights era are giving way to resegregation in American public schools, a phenomenon that has most commonly been linked to the rescission of legal support for desegregation (Frankenberg, Lee, & Orfield, 2003; Orfield, Bachmeier, James, & Eitle, 1997; Orfield & Monfort, 1992; Orfield, Schley, Glass, & Reardon, 1994; Orfield & Yun, 1999). While this narrative of resegregation is compelling and troubling, it is premised on trends observed in the 1990s. Indeed, there has been no systematic analysis of segregation extending beyond the year 2000. Given the profound changes to the American educational landscape over the past decades, there is a critical need for timely research examining trends in segregation into the 21st century.
School Resegregation in the 1990s
Much of the evidence for the resegregation of public schools derives from a series of studies conducted by Orfield and colleagues (Frankenberg et al., 2003; Orfield et al., 1994, 1997; Orfield & Monfort, 1992; Orfield & Yun, 1999). This body of work generally finds that the segregation of students reached its nadir in the late 1980s and increased steadily thereafter. In particular, this body of research has highlighted the worsening segregation of Blacks and the reemergence of segregation in the South. Indeed, Orfield and colleagues have argued that by the mid-1990s, the gains of Brown had been nearly reversed, with Black students more segregated than they were in the early 1970s (Frankenberg et al., 2003). In addition, Orfield and colleagues have highlighted the troubling trends in the South, finding that while the South experienced the largest declines in segregation since Brown, it also experienced the largest increases in Black segregation over the 1990s. In addition, research has also emphasized the worsening segregation of Hispanic and, to a lesser extent, Asian students in the context of rapid growth in these populations. Indeed, Orfield and colleagues (e.g., Orfield et al., 1994; Orfield & Yun, 1999) find that the level of Hispanic segregation has consistently increased since the late 1960s and have argued that it surpassed even that of Blacks by the early 1990s. Moreover, these observed increases in segregation have often been attributed to legal retrenchment on issues of segregation over the 1990s (Frankenberg et al., 2003), exemplified by cases such as Board of Education of Oklahoma City v. Dowell (1991), Freeman v. Pitts (1992), and Missouri v. Jenkins (1995). In each of these cases, the ruling handed down by the U.S. Supreme Court facilitated the release of districts from court-ordered desegregation remedies.
As Clotfelter (1999) has noted, however, the analyses conducted in this body of work have several methodological limitations. First, much of the early work relies on biennial survey data from the Department of Education’s Office for Civil Rights (OCR), which oversamples large districts, predominantly non-White school districts, and districts subject to desegregation orders, and therefore may not be representative of the nation as a whole. In addition, as Orfield and Monfort (1992) acknowledge, because it samples at the district level, OCR data permit examination of segregation between schools within a district but precludes examination of segregation between districts in a given metropolitan area (or other unit of analysis). As will be discussed below, this omission is particularly problematic given that the preponderance of segregation now lies between rather than within districts.
Second, these studies are somewhat limited by their reliance on measures of segregation (i.e., exposure and isolation) that are highly sensitive to the overall demographic composition of the geographic unit of analysis (for discussions on the properties of various segregation indices, see Iceland et al., 2002; Massey & Denton, 1988). In particular, measures of exposure and isolation may conflate changes in segregation with changes in the demographic composition of schools. The latter phenomenon, however, may be attributable to growth in non-White populations, rather than changes in the distribution of students across schools, and therefore may not constitute “resegregation.” Indeed, in a study building on the work of Orfield and colleagues, Logan (2004) presents evidence that the increases in segregation during the 1990s were largely attributable to growth in non-White public school enrollment rather than changes in the racial/ethnic distribution of students across schools and districts.
Subsequent research employing more nationally representative samples and more sophisticated measures of segregation correcting for these limitations has yielded more modest findings regarding the increases in segregation over the 1990s (see Clotfelter, 2001; Logan, Stowell, & Oakley, 2002; Reardon & Yun, 2001). Using Theil’s entropy index of segregation, Reardon, Yun, and Eitle (2000) find that the level of metropolitan multiracial school segregation remained relatively stable over the first half of the 1990s. However, they find that stable levels of multiracial segregation were the result of increases in the degree of segregation between Whites and non-Whites in the context of steady decreases in the level of segregation among non-Whites (i.e., between Asian, Black, and Hispanic students). Thus, while Whites did become more segregated from non-Whites over the 1990s, these increases were offset by declines in the segregation among non-White students. In a similar study encompassing data from the entire decade, Logan and Oakley (2004) demonstrate that the level of metropolitan segregation between White and Black students increased slightly between 1990 and 2000.
In addition to documenting changes in the level of segregation and the changing racial dynamics of segregation, recent research has documented an important shift in the geographic scale of segregation. While the segregation of public schools in the Brown era was primarily within districts (i.e., between schools), more recent trends toward resegregation have been driven by dramatic increases in segregation between districts. The finding that segregation is becoming increasingly concentrated at the district level has been attributed to the legacy of Milliken v. Bradley (1974), in which the Supreme Court ruled that desegregation across district boundaries was impermissible in the absence of evidence that multiple districts had committed deliberate segregation. By rendering district boundaries inviolable and limiting interdistrict desegregation remedies, researchers have argued that the Milliken ruling has facilitated the resegregation of American schools across district boundaries, making district boundaries a particularly pernicious mechanism of segregation (Bischoff, 2008; Clotfelter, 1999; Frankenberg et al., 2003; Orfield & Monfort, 1992; Reardon et al., 2000). Consistent with this interpretation, Clotfelter (2004) finds that the decades following the Brown decision witnessed substantial decreases in within-district segregation. However, these decreases were outpaced by increases in between-district segregation, yielding net increases in metropolitan segregation over time. Likewise, Reardon et al. (2000) find that the growth in segregation over the 1990s was largely attributable to growth in between-district segregation and argue that public school segregation continues to shift from a between-school phenomenon to a between-district phenomenon.
Educational Trends in the 21st Century
Despite mounting concern over the resegregation of American schools, no study has systematically examined large-scale trends in school segregation past the year 2000. As such, it is unclear whether the increases in segregation observed over the 1990s have continued into the 21st century. This gap in the literature is particularly problematic given the significant changes to education policy and the social and demographic contexts in which policies are implemented, which may have considerable implications for racial/ethnic stratification in schools. In particular, the continued erosion of legal support for desegregation, rapid increases in racial/ethnic diversity, and expansion of school choice options—phenomena that have all been linked to worsening segregation—suggest that the past decade may have experienced a continuation or exacerbation of the segregative trends of the 1990s.
As noted previously, the past decade has witnessed the continued erosion of support for legal segregation remedies, which clearly have direct implications for equity in schools. Following the Board of Education of Oklahoma City v. Dowell (1991), Freeman v. Pitts (1992), and Missouri v. Jenkins (1995) cases, hundreds of districts were released from desegregation orders. Between 2004 and 2009, 89 school districts were granted unitary status in the formerly de jure segregated states of Alabama, Florida, Georgia, Louisiana, Mississippi, North Carolina, and South Carolina alone (Holley-Walker, 2010). Indeed, by 2010, roughly 200 of the nearly 16,000 districts in the United States remained under desegregation orders (Holley-Walker, 2012). By removing legal oversight of districts’ integration efforts, this massive dissolution of desegregation orders may have facilitated further resegregation over the past decade. In addition to the steady decline in support for mandated desegregation over the past decade, the courts have recently handicapped districts’ ability to voluntarily integrate by prohibiting the use of individual student race/ethnicity when assigning students to schools (Parents Involved in Community Schools v. Seattle School District No. 1, 2007).
In addition, the past decades have witnessed large-scale shifts in the racial/ethnic composition of student populations, with rapid increases in the proportion of non-White students and an erosion of White majorities. Increases in racial/ethnic diversity have been particularly pronounced in metropolitan areas, where the overwhelming majority of Americans live and attend public school (Reardon et al., 2000). Indeed, between 1993 and 2000, the proportion of metropolitan public schools students who were White dropped from 62.9% to 56.5% (National Center for Education Statistics, 2009). Although the precise causal relationship between racial/ethnic diversity and segregation is unclear, research has linked increases in metropolitan racial/ethnic diversity with patterns of growth in school segregation over the 1990s (Clotfelter, 2001; Reardon & Yun, 2001). Given that trends toward increasing metropolitan diversity have continued into the 21st century—White enrollment had dropped to 50.9% by 2009—they may also contribute to a continuation of the segregative trends of the 1990s.
Another major development in education with considerable implications for equity over the past decade has been the proliferation of school choice options, particularly charter schools and open enrollment plans. Many critics have expressed concern regarding the effects of such choice reforms on school stratification and segregation. Indeed, contrary to the hopes of early proponents that charters might improve educational equity by weakening the link between patterns of residential segregation and school attendance, the bulk of evidence suggests that charter schools have served to segregate students. Specifically, research demonstrates that students tend to transfer from schools that are more diverse to schools that are less diverse, especially when choice is uncontrolled and does not take into account race/ethnicity (e.g., Bifulco & Ladd, 2007; Koedel, Betts, Rice, & Zau, 2009; Weiher & Tedin, 2002). While research on open enrollment is relatively scant by comparison, extant evidence suggests that such plans may increase stratification by race/ethnicity and socioeconomic status (Holme & Richards, 2009).
The Current Study
Developments in education policy and the social context of education over the past decade have prompted concerns that the troubling increases in segregation documented over the 1990s may be continuing into the 21st century. In the absence of any large-scale empirical evidence on trends in school segregation extending beyond the year 2000, however, further research is necessary to substantiate this proposition. Toward that end, in the current study, we seek to examine trends in metropolitan public school segregation from 1993 to 2009, evaluating whether public schools have continued to resegregate along racial/ethnic lines.
In addition, we examine the dynamics of segregation over time by decomposing segregation into its racial/ethnic and geographic components. Because we seek to understand segregation within the increasingly multiethnic context of American public schools, we measure segregation among students of all racial/ethnic groups using a multiracial index. However, to ensure that our study complements prior evidence on trends in public school segregation, we also examine specific segregation dynamics by decomposing this index to isolate the segregation attributable to students of different racial/ethnic groups. Because prior analyses have historically focused on the segregation of Whites and Blacks and emerging research has highlighted the worsening segregation between Whites and Hispanics and Asians (Orfield & Yun, 1999), we examine changes in these specific, dual-group comparisons. In addition, because prior research has documented divergent trends for the segregation among non-Whites versus the segregation between Whites and non-Whites (Reardon et al., 2000), we decompose multiracial segregation to isolate changes in segregation among non-White students from segregation between Whites and non-Whites.
Recent research on segregation has also emphasized the shifting geographic scale of segregation (e.g., Reardon et al., 2000), highlighting the shift from within-district segregation during the Brown era to between-district segregation. As such, in analyzing recent trends in segregation, this analysis attends to the changing geographic scale of segregation within and between districts over time. We also examine how changes in the distribution of segregation between and within districts vary across racial/ethnic dimensions of segregation.
In addition to examining national trends, we also attend to variability across metropolitan areas in trends in segregation over time. Research on segregation trends has often emphasized the reemergence of segregation in the formerly de jure segregated South (Orfield et al., 1997; Orfield & Yun, 1999; Reardon et al., 2000), attributing observed increases in segregation over the 1990s to the dissolution of desegregation orders. Thus, this analysis examines regional patterns of segregation in the South vis-à-vis the rest of the United States. Finally, prior research has also demonstrated associations between trends in metropolitan demographics and school segregation. Toward that end, we employ hierarchical linear modeling techniques to estimate the longitudinal relationship between changes in metropolitan student population and the proportion of students that are non-White and changes in total multiracial segregation, White/non-White segregation, and the segregation among non-Whites.
Method
Measuring School Segregation
Researchers have developed a wide array of segregation indices, each with certain advantages and disadvantages (for a review, see Massey & Denton, 1988; Reardon & Firebaugh, 2002); as such, it is important to select a measure that is appropriate to the research objective. Of particular importance to this study is the insensitivity of the measure to racial/ethnic composition. As Logan (2004) has noted, measures of segregation such as exposure and isolation, which are commonly employed by researchers such as Orfield and colleagues (see Frankenberg et al., 2003; Orfield & Lee, 2006; Orfield & Monfort, 1992; Orfield & Yun, 1999), are often problematic because they are sensitive to racial/ethnic composition. Thus, they may erroneously conflate segregation with a high proportion of non-Whites, deeming areas with majority-minority schools segregated, regardless of how students are actually distributed across schools (Massey & Denton, 1988). Such measures are particularly problematic when considering segregation in a longitudinal context, given the dramatic racial/ethnic shifts in U.S. metropolitan demographics over the past several decades. Indeed, given that the proportion of students residing in metropolitan areas that are non-White increased from 37.2% in 1993 to 49.5% in 2009 (NCES CCD), measures of exposure and isolation would necessarily indicate increasing levels of segregation over time, even if student population growth was evenly distributed across schools and districts.
Given that the racial/ethnic diversity of American public schools has increased steadily since the Brown era, it is critical for any study of the changes in school segregation over time to select measures of segregation capable of distinguishing actual changes in segregation from demographic changes. While there are several measures of segregation that are not biased by changes in the racial/ethnic composition of metropolitan areas (see Reardon & Firebaugh, 2002), for this study we have elected to use Theil’s entropy index of segregation. A so-called evenness measure of segregation, Theil’s index quantifies how racially/ethnically diverse schools are, on average, relative to the overall racial/ethnic diversity of their metropolitan area (Reardon et al., 2000). Readers may refer to Reardon et al. (2000) and Reardon and Firebaugh (2002) for detailed information regarding the procedure for computing the Theil entropy index of segregation. It should be noted, however, that Theil’s index ranges from 0 (complete integration), where each school in a metropolitan area has the exact same racial/ethnic composition as the metropolitan area as a whole, to 1 (complete segregation), where each school in a metropolitan area enrolls only a single racial/ethnic group (Theil, 1972).
Theil’s index has been found to produce similar results as the more traditional measures of evenness, such as indices of dissimilarity or the Gini coefficient (Reardon & Firebaugh, 2002; Reardon & Yun, 2001). However, the Theil index has several conceptual and mathematical advantages that have contributed to its increasing popularity among scholars interested in racial/ethnic and socioeconomic segregation (e.g., Fischer, Stockmayer, Stiles, & Hout, 2004; M. J. Fischer, 2003; Reardon et al., 2000, 2008, 2009).
As with some other measures of evenness, Theil’s index may be used to quantify the segregation among any number of racial/ethnic groups, as well as between specific pairs of groups. As such, it can measure multiracial segregation (the overall level of segregation among n number of racial/ethnic groups), as well as more traditional dual-group measures, such as segregation between Whites and non-Whites or Whites and Blacks. What makes the Theil index uniquely advantageous for our purpose, however, is its property of decomposability. Of particular importance to the present study, the Theil index may be decomposed into distinct racial/ethnic and geographic components.
Racial/ethnic decomposition is useful for understanding the extent to which changes in segregation are attributable to the segregation within and between different racial/ethnic groups. In this study, for example, we are interested in examining what proportion of total multiracial segregation is attributable to the segregation of White students from non-White students and what proportion is attributable to segregation among non-White students. As such, we decompose total multiracial segregation into two unique components, one capturing the proportion of total multiracial segregation between Whites and non-Whites and the other capturing the proportion among non-Whites.
Likewise, geographic decomposition is useful for determining the extent to which changes in total multiracial segregation are attributable to the segregation at different geographic units of analysis. In the context of this study, this allows us to examine the extent to which total multiracial segregation is a function of the segregation of students between districts and between schools within districts. As such, we decompose total multiracial segregation into two unique components, one capturing the proportion of total multiracial segregation attributable to the segregation of students of different racial/ethnic groups across school district boundaries and the other capturing the proportion attributable to a weighted average of the segregation of students across schools within each district of a metropolitan area. For a more detailed discussion of the procedures used to calculate the components of total multiracial segregation used in this analysis, see Reardon et al. (2000).
Measures of segregation
To address the research objectives outlined previously, we computed a number of indices of segregation capturing different aspects of the racial and geographic dynamics of metropolitan public school segregation.
To describe the average level of metropolitan segregation among different racial/ethnic groups over time, we computed annual measures of multiracial segregation, segregation between Whites and non-Whites, segregation among non-Whites, and three dual-group segregation indices. Multiracial segregation measures how evenly, on average, students from all five racial/ethnic categories tracked by the NCES CCD (i.e., American Indian/Alaska Native, Asian, Black, Hispanic, and White) are distributed across schools and districts within a metropolitan area. Segregation between Whites and non-Whites measures how segregated on average White students are from non-White students across schools and districts within a metropolitan area. Segregation among non-Whites captures the average level of segregation among non-White students across the schools and districts within a metropolitan area. The dual-group indices measure the average level of segregation between Whites and three different racial/ethnic minority groups: Asians, Blacks, and Hispanics.
In addition to computing the average levels of segregation in metropolitan areas, total metropolitan multiracial segregation was also decomposed into its racial/ethnic and geographic components to examine the relative contributions of each dimension to total metropolitan multiracial segregation. First, to examine the extent to which changes in total metropolitan multiracial segregation are being driven by segregation between Whites and non-Whites versus among non-Whites, we decomposed multiracial segregation into two components. The first component captures the proportion of multiracial segregation attributable to segregation between Whites and non-Whites. The second component captures the proportion of multiracial segregation attributable to segregation among non-Whites (i.e., American Indian/Alaska Natives, Asians, Blacks, and Hispanics). Second, to address changes in the geographic scale of segregation, total metropolitan multiracial segregation was also decomposed into its between-district and within-district components. The between-district component captures the proportion of total metropolitan segregation attributable to segregation between school districts. The within-district component captures the proportion of total metropolitan segregation attributable to segregation between the schools in a district. In addition, to examine how changes in the distribution of segregation between and within districts vary by the racial components of segregation, we also conducted a two-way decomposition of total metropolitan multiracial segregation by race/ethnicity and geography, yielding four components (i.e., White/non-White within-district, White/non-White between-district, among non-White within-district, among non-White between-district).
For each measure of segregation, we report population-weighted average values for each study year. Thus, all measures of metropolitan public school segregation were weighted by the proportion of the total U.S. student population residing in that metropolitan area for each year (for a similar weighting procedure, see Reardon & Yun, 2001). Prior research on trends in segregation has generally employed unweighted measures (e.g., Clotfelter, 1999; Logan, Oakley, & Stowell, 2008; Reardon et al., 2000), averaging levels of segregation across metropolitan areas. However, because of wide variability in the student population of metropolitan areas, weighted measures may provide a better estimate of the level of school segregation to which a typical student is exposed.
For example, in 2009, U.S. metropolitan areas had a mean student population of 49,200 students, with a standard deviation of 104,162 students. Metropolitan student populations ranged from 2,833 in Corvallis, Oregon, to over 1 million students in New York–Northern New Jersey–Long Island. The cases of Corvallis and New York provide a clear illustration of the differences between the population-weighted and unweighted segregation values. In 2009, the total segregation value for Corvallis was .142, while New York had a segregation level of .396. Thus, an unweighted average would suggest that these metropolitan areas had a mean total segregation value of .269. However, when considering the relative student populations of Corvallis and New York, the average student in these metropolitan areas experiences a level of segregation of .395. While both averages are valid, the latter gives a better estimate of the level of segregation to which students are typically exposed.
To ensure that our results were comparable with prior literature on the topic and that the trends presented in this article are not the result of the weighting procedure, we computed unweighted averages to ensure the comparability of trends. Consistent with the findings of Reardon and Yun (2001), unweighted values were generally slightly lower than the weighted values, reflecting the relatively lower segregation values of smaller metropolitan areas (Clotfelter, 1999). The overall trends in segregation for the unweighted and weighted values, however, were comparable across the various measure of segregation used in this study.
The Relationship Between Metropolitan Demographics and School Segregation
To examine how changes in metropolitan segregation over time are related to changes in metropolitan student population and demographics, we estimate a series of two-level longitudinal hierarchical models predicting change in total metropolitan multiracial, White/non-White, and among non-White segregation as a function of time-varying metropolitan characteristics. For each measure of segregation, we estimate separate models for each epoch identified in the study (i.e., 1993–1998 and 1998–2009, discussed at length below). For each epoch, we first estimate a time-unconditional model predicting change in segregation as a function of time (at Level 1). Second, we estimate a fully specified model adding time-varying annual measures of student population and racial/ethnic diversity at the metropolitan level (Level 2) to the time-unconditional models. 1
In each of the fully specified hierarchical models, changes in segregation within metropolitan areas over time are predicted as a function of within-metropolitan student population and demographic changes over time, controlling for all between-metropolitan area variation in segregation levels. As such, the coefficient for each demographic covariate may be interpreted as the average within-metropolitan association between changes in segregation and changes in metropolitan student population and demographics. This approach is advantageous because controlling for between-metropolitan variation in segregation allows for unbiased estimation of the relationship between metropolitan demographics and metropolitan segregation.
Sample and Data
Annual values of segregation for each metropolitan area were calculated using public school demographic data from the National Center for Education Statistics, Common Core of Data Public Elementary/Secondary School Universe Survey. Although NCES CCD data have been collected since 1986–1987, reporting compliance and response rates were problematic prior to 1993. Indeed, no racial/ethnic data were reported for the 1986–1987 school year. In 1987–1988, 17 states failed to report racial/ethnic data. By 1993–1994, however, only 1 state (i.e., Idaho) failed to report racial/ethnic data. As such, the study used annual data for the 17-year period between 1993–1994 and 2009–2010. We use annual measures of segregation rather than change scores between two time points, as has been the practice in the prior literature, to permit examination of nonlinearity in segregation trends.
Because the analysis focused on changes in between- and within-district segregation at the metropolitan level, the population of U.S. metropolitan areas was selected for analysis. Metropolitan statistical areas are defined as areas with at least one urbanized area with a population of 50,000 or more. Only the 366 metropolitan areas located in the 50 U.S. states and the District of Columbia were considered, excluding those in Puerto Rico and other U.S. territories.
Several exclusion criteria were applied to the population of metropolitan areas for the study analysis. Following the procedure employed by Reardon et al. (2000), we retained for analysis only those metropolitan areas for which over 90% of schools reported racial/ethnic data for both the first and last year of the study. Seven metropolitan areas were excluded on the basis of this criterion, six because more than 10% of their schools failed to report racial/ethnic data for 1993 and one because more than 10% of schools failed to report racial/ethnic data for 2009. In addition, we excluded three new metropolitan areas that were not recognized by the Census Bureau until 2008 (U.S. Office of Management and Budget, 2008). In addition, because the state of Tennessee did not report student racial/ethnic data for the 6 years between 1999 and 2004, we excluded the six metropolitan areas in Tennessee for the entirety of the study. On the basis of these criteria, 16 of the 366 current U.S. metropolitan areas were excluded from the analysis. As such, the final sample includes all 350 U.S. metropolitan areas that reported data for the entire study period. Each observation in the sample data set represents a Metropolitan Area × Year. Thus, the final sample of 350 metropolitan areas over the 17-year period from 1993 and 2009 comprised a total of 5,950 observations.
To address trends in public school segregation in states formerly subject to de jure segregation vis-à-vis the rest of the United States, we coded metropolitan areas in the following Southern states as having a history of de jure segregation: Alabama, Arkansas, Delaware, Florida, Georgia, Kentucky, Louisiana, Maryland, Mississippi, Missouri, North Carolina, Oklahoma, South Carolina, Tennessee, Texas, Virginia, and West Virginia (Raffel, 1998). Of the 350 metropolitan areas in the study sample, 151 are located in states that once had de jure segregation. Because prior research has focused on the reemergence of Black-White segregation in the South over the 1990s, and because desegregation orders in the South targeted the segregation of Blacks from Whites, we used measures of Black-White segregation, as well as multiracial segregation, to examine change in segregation in the formerly de jure segregated South versus the rest of the United States.
For each metropolitan area, the sample of schools and districts used to compute measures of metropolitan segregation were identified according to the following procedure. Schools and districts were matched to metropolitan areas by spatially merging the geographic location of each U.S. public school, which was obtained via the NCES CCD, and the boundaries of each school district, which were obtained from the U.S. Census TIGER/Line® system, with the boundaries of each metropolitan area. Allowing metropolitan boundaries to change over time (e.g., from the incorporation of outlying areas or the fragmentation into multiple metropolitan areas) would be problematic as it would confound changes in school segregation with changes attributable to geographic expansion or contraction or annexation of new populations. Thus, to permit more valid longitudinal inference, the geographic boundaries of each metropolitan area in the sample were held constant, using fixed 2010 U.S. Census boundary definitions across all 17 study years.
Several filters were applied to the population of schools within each metropolitan area for the computation of segregation. Following the procedure of Logan (2004), at the school level, the sample of schools in the NCES data set was restricted to elementary schools. This is particularly important to ensure that segregation values are calculated on schools of a single level to isolate segregation from cohort effects. For example, if a school district has only one elementary school and one secondary school, it may have a high segregation value; however, any segregation between these two schools is better conceptualized as a cohort effect reflecting the different demographic characteristics of older and younger students than actual segregation between schools. In addition, all nonoperational schools, schools with zero enrollment, Department of Defense schools, and Bureau of Indian Affairs/Tribal schools were excluded. Public charter schools were retained for analysis: School districts comprised of only charter schools were analyzed as separate districts within a metropolitan area, while charter schools operated by traditional public school districts were counted among the districts public schools. Magnet and alternative schools were also retained for analysis.
Results
After a Decade of Resegregation, a Return to Integration
We find that the “resegregation” phenomenon of the 1990s, which has been widely cited in the education literature (e.g., Clotfelter, 2004; Frankenberg et al., 2003; Frankenberg & Lee, 2002; Logan et al., 2002; Orfield, 2001; Orfield & Lee, 2006), has not continued into the 21st century. Our findings corroborate the slight increases in total multiracial segregation and segregation between Whites and non-Whites over the 1990s that have been documented by previous researchers. However, we find that the intervening decade has witnessed a period of modest reintegration for all racial/ethnic groups, as well as a continuation of the trend toward integration among non-White students that characterized the 1990s.
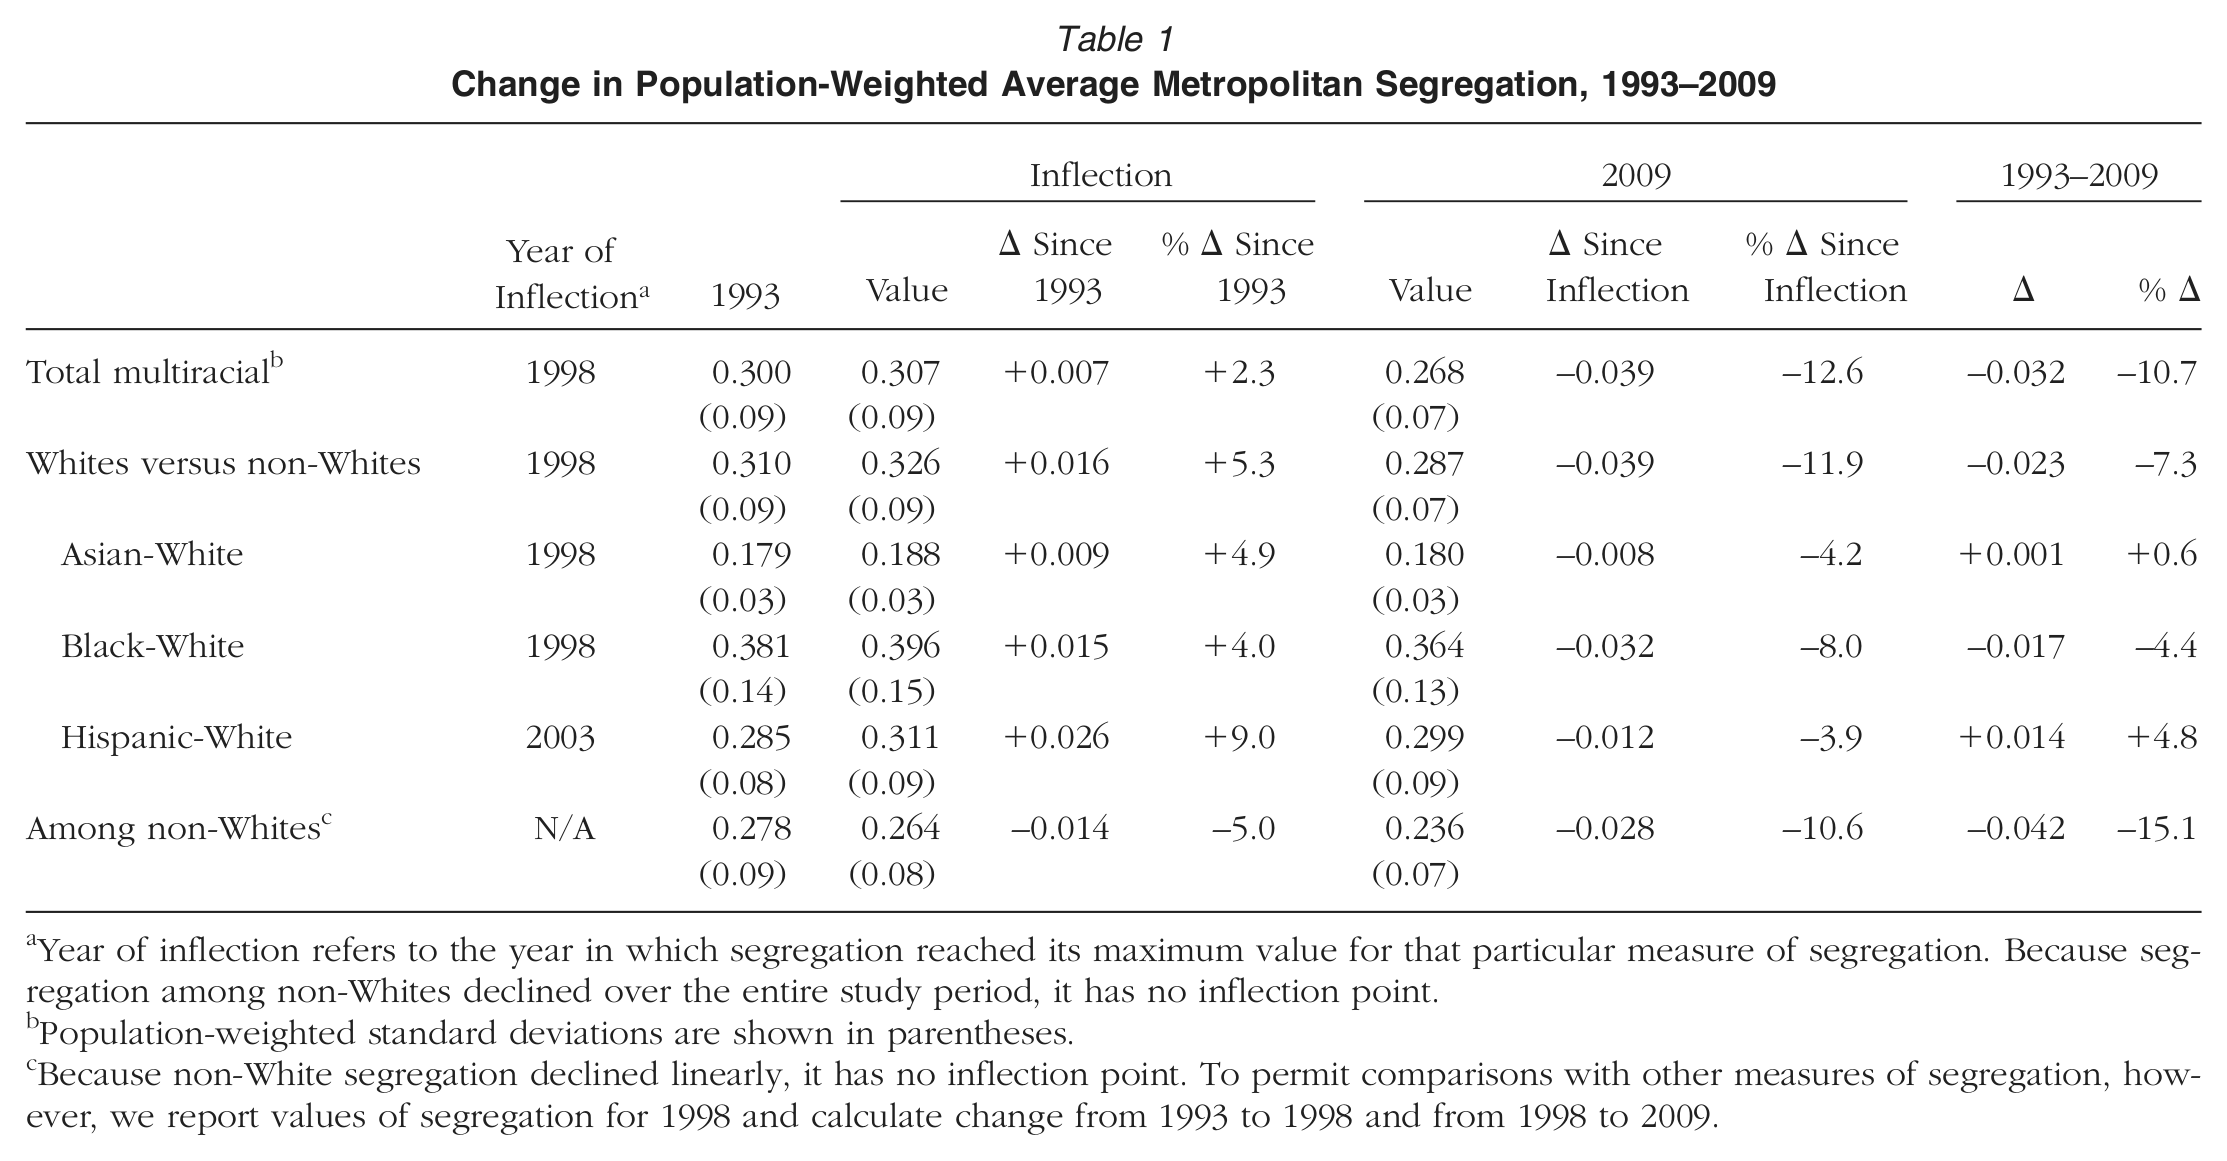
Figure 1 depicts change in total multiracial segregation, total segregation between Whites and non-Whites, and total segregation among non-Whites between 1993 and 2009. 2 As the graph illustrates, total multiracial segregation and total segregation between Whites and non-Whites exhibited concave curvilinear trends, reflecting worsening segregation through 1998 followed by decreases in segregation thereafter. Table 1 describes the magnitude of these effects, revealing that between 1993 and 1998 the level of multiracial segregation to which the typical student in a metropolitan area is exposed increased slightly, by 2.3%. However, since reaching its apogee in 1998, multiracial segregation has declined even more substantially, by 12.6%. As a result of this curvilinear trend, multiracial segregation was 10.7% lower in 2009 than it was in 1993. Patterns of segregation between Whites and non-Whites mirrored those of total multiracial segregation. Indeed, between 1993 and 1998, the level of White/non-White segregation to which the typical student in a metropolitan area is exposed increased by 5.3%. However, since peaking in 1998, segregation between Whites and non-Whites has declined by nearly 12%. As a result, segregation between Whites and non-Whites was 7.3% lower in 2009 than it was in 1993.

Change in population-weighted average multiracial segregation, segregation between Whites and non-Whites, segregation among non-Whites, 1993–2009.
Change in Population-Weighted Average Metropolitan Segregation, 1993–2009
Year of inflection refers to the year in which segregation reached its maximum value for that particular measure of segregation. Because segregation among non-Whites declined over the entire study period, it has no inflection point.
Population-weighted standard deviations are shown in parentheses.
Because non-White segregation declined linearly, it has no inflection point. To permit comparisons with other measures of segregation, however, we report values of segregation for 1998 and calculate change from 1993 to 1998 and from 1998 to 2009.
Contrary to the curvilinear trends for multiracial segregation and segregation between Whites and non-Whites, segregation among non-Whites exhibited a negative linear trajectory, with the decreases in segregation among non-Whites over the 1990s reported by Reardon et al. (2000) continuing steadily into the 21st century. As a result of this trend, segregation among non-White students decreased by 15.1% between 1993 and 2009.
Because prior research and policy has historically emphasized the segregation between Whites and other racial/ethnic groups, Table 1 also presents three specific dual-group comparisons capturing the degree of segregation between Whites and Asians, Blacks, and Hispanics, respectively. All three White/non-White comparisons exhibited concave curvilinear trends over the study period mirroring those of multiracial segregation, reflecting worsening segregation through the 1990s followed by decreases in segregation thereafter. Like multiracial segregation, Asian-White and Black-White segregation reached their peak in 1998, while Hispanic-White segregation continued to increase until 2003.
Since peaking in the late 1990s and, in the case of Hispanic-White segregation, in 2003, segregation between Whites and all non-White groups has declined. Black-White segregation experienced the most pronounced decline, decreasing by 8.0% since 1998. Declines for Hispanic-White and Asian-Whites segregation were more modest, with Hispanic segregation decreasing by 3.9% since 2003 and Asian-White segregation decreasing by 4.2% since 1998. Despite the downward trends in segregation across all racial/ethnic comparisons in recent years, only Black-White segregation was lower in 2009 than it was in 1993, having declined by 4.4% over the entire study period. As of 2009, declines in Hispanic-White and Asian-White segregation have failed to counterbalance the larger prior increases in segregation of the 1990s. As a result, Hispanics were 4.8% more segregated from Whites in 2009 than they were in 1993, while Asians were a negligible 0.5% more segregated from Whites than in 1993.
Regarding the relative severity of segregation for students of different racial/ethnic groups, the segregation of Blacks from Whites remains particularly acute, with Blacks still far more segregated from Whites than Asians or Hispanics and Hispanics substantially more segregated from Whites than Asians. However, the segregation of Blacks has declined at a faster pace than Asian and Hispanic segregation over the past decade. As a result, the gap between Black-White and Asian- and Hispanic-White segregation narrowed over the study period. In 1993, the average Black student was exposed to a level of segregation from Whites 2.13 times that of the average Asian student (0.381 vs. 0.179). By 2009, this ratio had dropped slightly, with the average Black student exposed to a level of segregation from Whites 2.02 times that of the average Asian student (0.364 vs. 0.180). Likewise, in 1993 the average Black student was exposed to a level of segregation from Whites that was 1.34 times that of the average Hispanic student (0.381 vs. 0.285). By 2009, however, the average Black student was exposed to a level of segregation from Whites 1.22 times that of the average Hispanic student (0.364 vs. 0.299).
Segregation in the Formerly de Jure Segregated South
Although our analyses reveal that segregation has declined nationally since 1998, this national trend masks important differences in segregation trajectories between the South and the rest of the United States. Segregation remains substantially lower in the South than in the states never subject to federal desegregation litigation; however, the past decades have substantially narrowed this gap, particularly for Black-White segregation. Consistent with previous research (e.g., Reardon & Yun, 2002), we find that Black-White segregation increased more rapidly in the South than in the rest of the United States over the 1990s. In addition, although Black-White segregation declined in the South since 1998, the declines have been smaller than those observed in the rest of the United States.
Table 2 presents the trends in segregation for metropolitan areas in the formerly de jure segregated South compared to the rest of the United States. As the table demonstrates, metropolitan areas in both regions exhibited concave curvilinear segregation trends over the study period mirroring national segregation trajectories, with increases until 1998 and decreases thereafter. While the South and the rest of the United States experienced roughly equivalent increases in multiracial segregation over the 1990s (2.3% for both the South and the rest of the United States), the South experienced larger increases in Black-White segregation than the rest of the United States (5.8% vs. 3.2%). This is consistent with prior research documenting the troubling trend toward Black-White resegregation in the South over the 1990s. Since 1998, both the South and the rest of the United States experienced decreases in both multiracial and Black-White segregation. Decreases in multiracial segregation were slightly larger in the South than the rest of the United States (13.1% vs. 11.8%). However, decreases in Black-White segregation in the South were considerably smaller than those in the rest of the United States (4.5% vs. 9.3%). Thus, the South has lagged behind the rest of the United States over the past decade in terms of integrating Blacks and Whites.
Change in Population-Weighted Average Metropolitan Segregation in the de Jure South Versus the Rest of United States, 1993–2009

Population-weighted standard deviations are shown in parentheses.
Despite exhibiting larger increases in segregation over the 1990s and smaller decreases since 1998, multiracial and Black-White segregation remain substantially lower in the South than in the rest of the United States, reflecting the legacy of integration efforts in the formerly de jure segregated South. However, the converging segregation trajectories between the South and the rest of the United States have significantly narrowed this segregation gap, particularly for Black-White segregation. Indeed, in 1993, Black-White segregation in the South was 14.6% lower than segregation in the rest of the United States. By 2009, however, segregation in the South was only 7.8% lower than the rest of the country.
Decomposing Segregation by Race/Ethnicity and Geography
In the following, we present results of analyses decomposing measures of segregation into their racial/ethnic and geographic components over time. First, total metropolitan multiracial segregation is decomposed by race/ethnicity to examine the relative contributions of segregation between Whites and non-Whites and segregation among non-Whites to levels of total multiracial segregation. We report decompositions for the years 1993, 1998, and 2009, allowing examination of trends for the two major epochs identified in the study, the period of “resegregation” from 1993 to 1998 and the period of “reintegration” from 1998 to 2009. Second, segregation is decomposed geographically to examine the relative contributions of segregation between districts and segregation between schools within districts to total metropolitan segregation over time. Finally, a two-way decomposition of segregation by race/ethnicity and geography is conducted to examine how the distribution of segregation between and within districts varies by racial components of segregation across time.
White/Non-White Versus Among Non-White Components of Multiracial Segregation
While the trends in average segregation between Whites and non-Whites and among non-Whites presented previously are declining, examination of the racial/ethnic components of multiracial segregation suggests that the relative importance of these components of segregation is changing over time. Although non-White students are still substantially more segregated from Whites than from their non-White peers, the share of multiracial segregation attributable to segregation between Whites and non-White groups, which has been the traditional focus of scholars and policymakers since Brown, has declined steadily in importance relative to segregation among students of color.
Table 3 demonstrates that although the average level of segregation among non-Whites decreased over the 1990s (see Table 1), the non-White component of total multiracial segregation and the share of total multiracial segregation attributable to segregation among non-Whites increased slightly (from 0.084 to 0.085 and from 27.9% to 28.1%, respectively). Although seemingly contradictory, this may be attributable to the fact that the components take into account the proportion of non-White students, 3 which increased from 37.2% in 1993 to 41.7% in 1998 (NCES CCD). Likewise, although segregation among non-Whites continued to decrease between 1998 and 2009, the non-White component of total multiracial segregation and the share of total multiracial segregation attributable to segregation among non-Whites continued to increase, from 28.1% to 34.4%. Again, this somewhat counterintuitive finding may be attributed to the fact that declines in among non-White segregation were offset by even larger declines in segregation between Whites and non-Whites and continued increases in the proportions of non-Whites (from 41.7% in 1998 to 49.5% in 2009, NCES CCD).
Decomposition of Multiracial Segregation Into Its White/Non-White and Among Non-White Components, 1993–2009
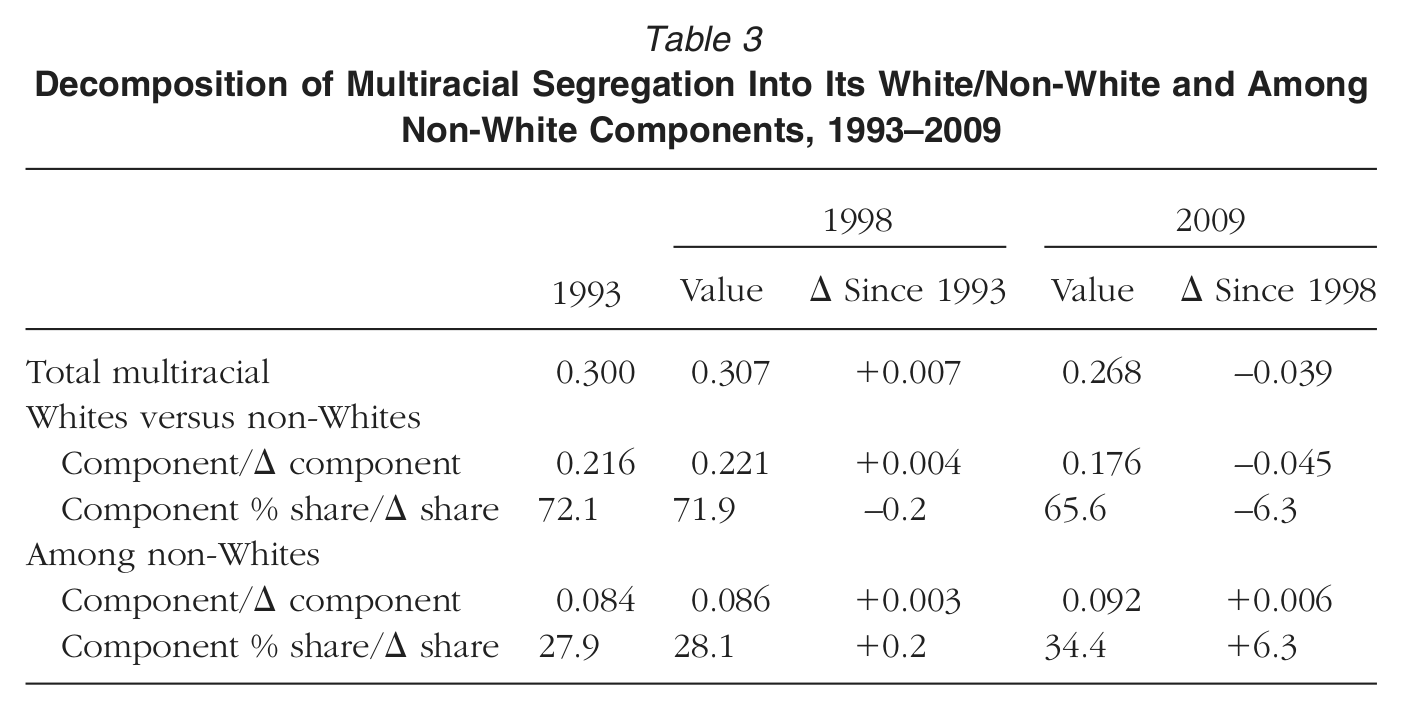
Table 3 also decomposes the changes in multiracial segregation from 1993 to 1998 and from 1998 to 2009 into their White vs. non-White and among non-White change components. The table demonstrates that growth in the White/non-White component of total multiracial segregation accounted for the majority (62.1% or 0.004 of 0.007) of the growth in multiracial segregation between 1993 and 1998, with segregation among non-Whites accounting for the remaining 37.9%. Because the among non-White component of multiracial segregation increased from 1998 to 2009, the declines in multiracial segregation observed since 1998 may be attributed exclusively to declines in the share of segregation between Whites and non-Whites, which were partially offset by increases in the among non-White segregation component.
Between- and Within-District Components of Metropolitan Segregation
Examination of the geographic components of segregation suggests that the geographic scale of segregation continues to evolve. While students are still considerably more segregated across district boundaries than they are among schools within districts, we find that the shift from segregation as a within-district phenomenon to a between-district phenomenon that characterized the post-Milliken era (Clotfelter, 2001; Reardon et al., 2000) has stabilized since the late 1990s. Whereas the increases in total metropolitan segregation observed over the 1990s were largely attributable to increasing segregation across district boundaries, the decreases in segregation since 1998 are attributable to declining segregation both within and between districts.
Table 4 documents the decomposition of total multiracial segregation into its between- and within-district components. Table 4 reveals that segregation between districts accounts for a majority share of metropolitan multiracial segregation and that the proportion of segregation between districts has continued to increase. Indeed, in 2009, between-district segregation accounted for over three-fifths (61.7%) of total metropolitan segregation. 4 Moreover, this proportion has increased slightly since 1993, from 60.6% to 61.7%. However, the shift to segregation across district boundaries has plateaued since the late 1990s. Although the share of between-district segregation increased by 0.8 percentage points between 1993 and 1998, it increased by just 0.3 percentage points in the subsequent 11 years.
Decomposition of Multiracial Segregation Into Its Between- and Within-District Components, 1993–2009
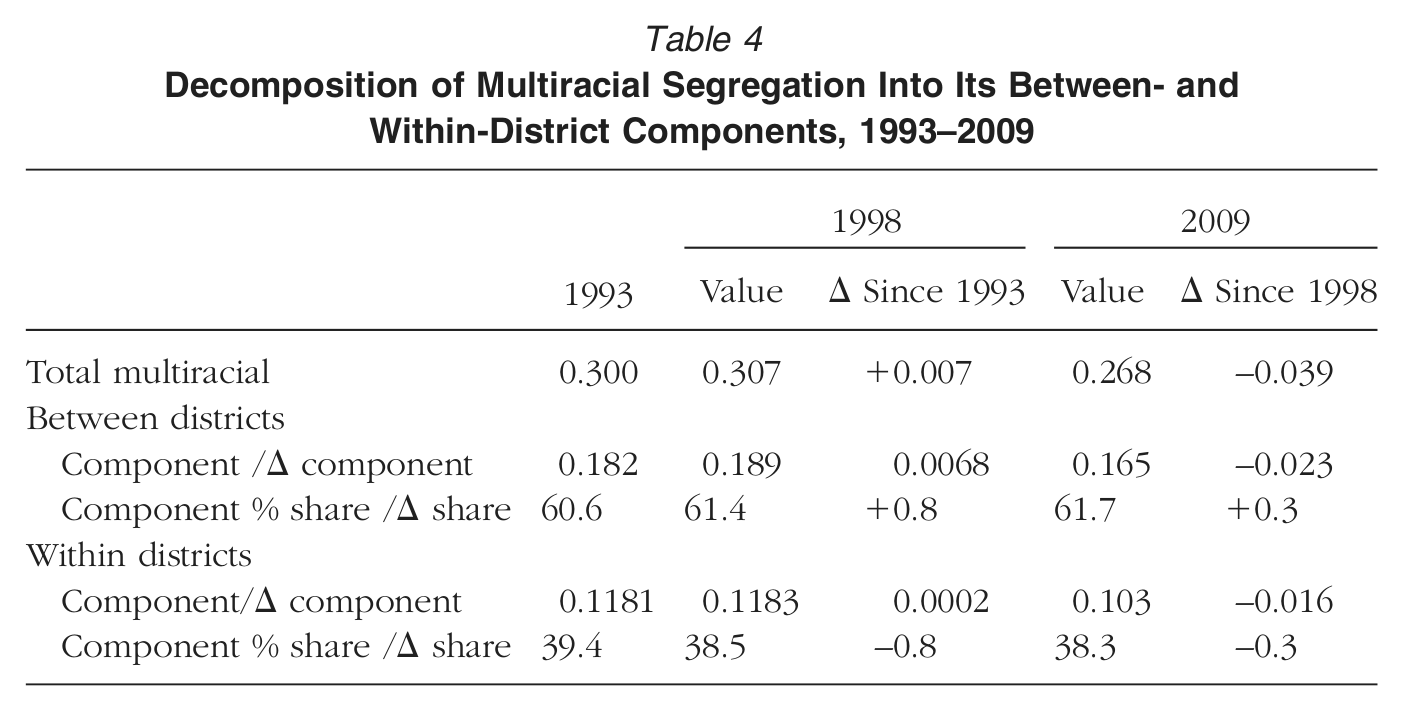
Table 4 also decomposes the changes in total metropolitan multiracial segregation between 1993 and 1998 and between 1998 and 2009 into their between- and within-district change components. Table 4 demonstrates that over the 1990s, both between-district and within-district components of segregation increased. However, the vast majority of the increases in total metropolitan multiracial segregation were attributable to growth in segregation between districts. Indeed, nearly 97% of the growth in segregation over the 1990s may be attributed to the observed increases in segregation across district boundaries (0.0068 of 0.007), with a negligible increase in the within-district component accounting for the remaining 3% (0.0002 of 0.007).
Since the late 1990s, however, declines in both within- and between-district components of total segregation have contributed to the observed decreases in total multiracial segregation. The between-district component of segregation declined by 12.3% (0.023 of 0.189), while segregation within districts declined by 13.3% (0.016 of 0.1183). Although declines in between-district segregation still account for a majority (59.4% or 0.023 of 0.039) of the overall decrease in total segregation, reductions in within-district segregation account for roughly 41% of the decreases since 1998 (0.016 of 0.039). Taken together, these findings suggest that while students are still considerably more segregated across district boundaries than among schools, the past decade has witnessed moderate reductions in segregation both within and between districts.
Two-Way Decomposition of Segregation by Race/Ethnicity and Geography
Two-way decomposition of total metropolitan multiracial segregation into its racial/ethnic (i.e., White/non-White vs. among non-White) and geographic (i.e., within and between districts) components for each of the study years revealed interesting interactions between student race/ethnicity and geography that are shifting over time. Although the majority of metropolitan segregation lies between districts, decomposition by race/ethnicity and geography reveals that district boundaries are a far more salient mechanism for segregating Whites from non-Whites than for segregating non-Whites from each other. However, racial differences in the geographic scale of segregation are converging over time, with between-district segregation among non-Whites accounting for an increasing proportion of total multiracial segregation and between-district segregation between Whites and non-Whites accounting for a decreasing proportion of all segregation. These findings highlight the increasing stratification of non-Whites across district boundaries in the context of the declining importance of between-district segregation between Whites and non-Whites.
Table 5 demonstrates that although the majority of total metropolitan multiracial segregation lies between districts, this effect varies by racial/ethnic comparison. Indeed, in 2009, a large majority of all segregation between Whites and non-Whites (66.9%, or 0.118 of 0.176) was between rather than within districts. Within-district segregation accounted for a somewhat higher proportion of segregation among non-Whites, with segregation between districts accounting for just over half of all segregation among non-Whites (51.8%, or 0.048 of 0.092).
Two-Way Decomposition of Multiracial Segregation Into Racial/Ethnic and Geographic Components, 1993–2009
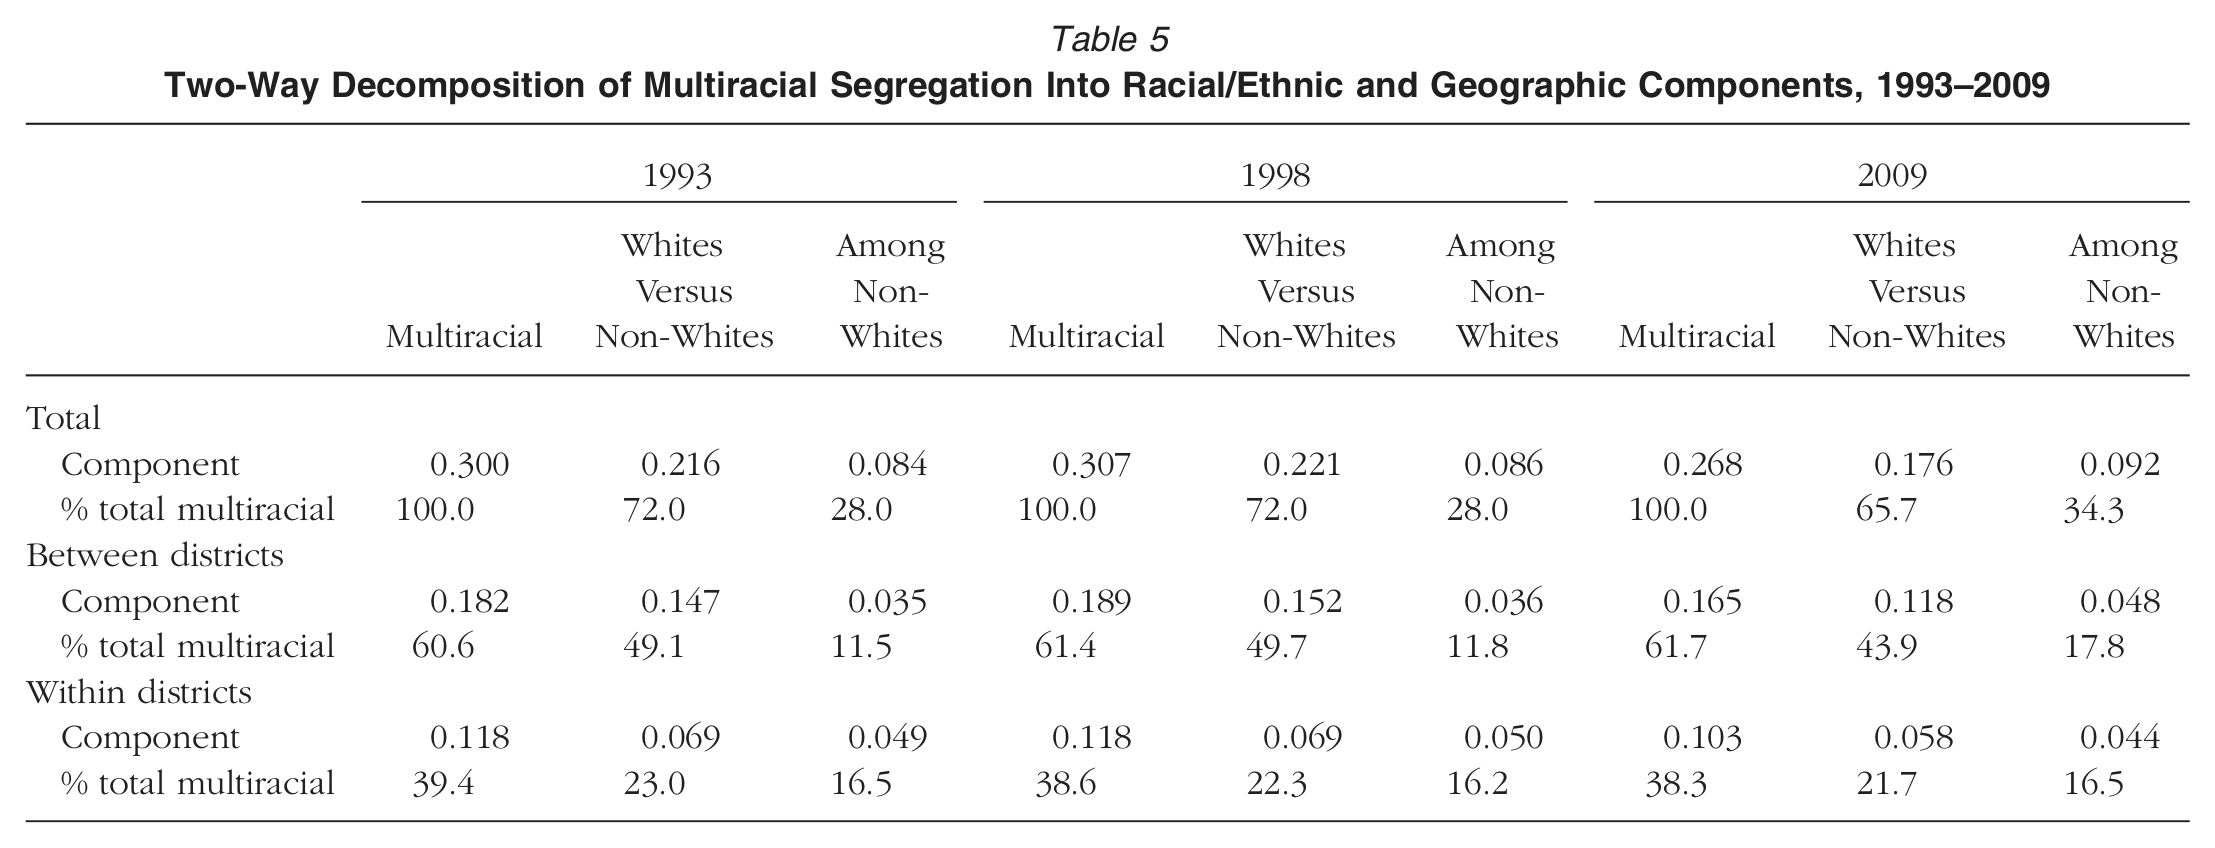
Table 5 also reveals that the role of district boundaries in segregating different racial/ethnic groups has changed over time, reflecting the growing importance of district boundaries in segregating non-Whites and the declining importance of district boundaries in segregating Whites from non-Whites. In particular, the segregation of non-White students across district boundaries has become an increasingly important component of total multiracial segregation since the late 1990s. In 1993, just 11.5% of all multiracial segregation was attributable to segregation among non-Whites across district boundaries (0.035 of 0.300). This share was fairly stable until 1998, increasing by just 0.3 percentage points to 11.8% (0.036 of 0.307). However, between 1998 and 2009, this proportion increased substantially, with between-district segregation among non-Whites accounting for 17.8% of all segregation in 2009 (0.048 of 0.268). As a result, while the majority of segregation among non-Whites was across schools within district boundaries in 1998 (58.9%, or 0.049 of 0.084), by 2009, a slight majority of segregation among non-Whites was across district boundaries (51.8%, or 0.048 of 0.092). This suggests an important shift in non-White segregation from a within-district to a between-district phenomenon.
There was also a significant, albeit less pronounced, shift in the geographic distribution of segregation between Whites and non-Whites, reflecting a decline in the contribution of between-district segregation between Whites and non-Whites to total multiracial segregation since the late 1990s. In 1993, 49.1% of all segregation was attributable to segregation between Whites and non-Whites across district boundaries (0.147 of 0.300). As with segregation among non-Whites, this proportion was relatively stable through 1998, increasing slightly to 49.7% (0.152 of 0.307). However, the proportion dropped nearly 6 percentage points between 1998 and 2009, with between-district segregation between Whites and non-Whites accounting for 43.9% of all segregation in 2009 (0.118 of 0.268). Thus, although between-district segregation between Whites and non-Whites still accounts for a plurality of all segregation, its relative importance has been diminished, particularly by increases in between-district segregation among non-Whites over the past decade.
Changes in Segregation and Metropolitan Population Dynamics
The findings presented previously reflect average metropolitan trends for the nation; as such, not all metropolitan areas in the United States experienced similar patterns. To illustrate the extent to which metropolitan areas varied in terms of their segregation trajectories, Table 6 describes the distribution of change in total multiracial segregation across metropolitan areas for the two major epochs identified in the study, 1993 to 1998 and 1998 to 2009, as well as the study period as a whole. Mirroring aggregate trends, the majority of metropolitan areas (60%, or 210 of 350) experienced increases in multiracial segregation between 1993 and 1998; however, segregation declined in a substantial minority of metropolitan areas (40%, or 140 of 350). Most changes in segregation between 1993 and 1998 were fairly small: Nearly three-fifths (58.5%) of metropolitan areas experienced relatively small changes in segregation, ranging from −10% to +10% over this period.
Number and Proportion of Metropolitan Areas by Magnitude of Change in Total Multiracial Segregation
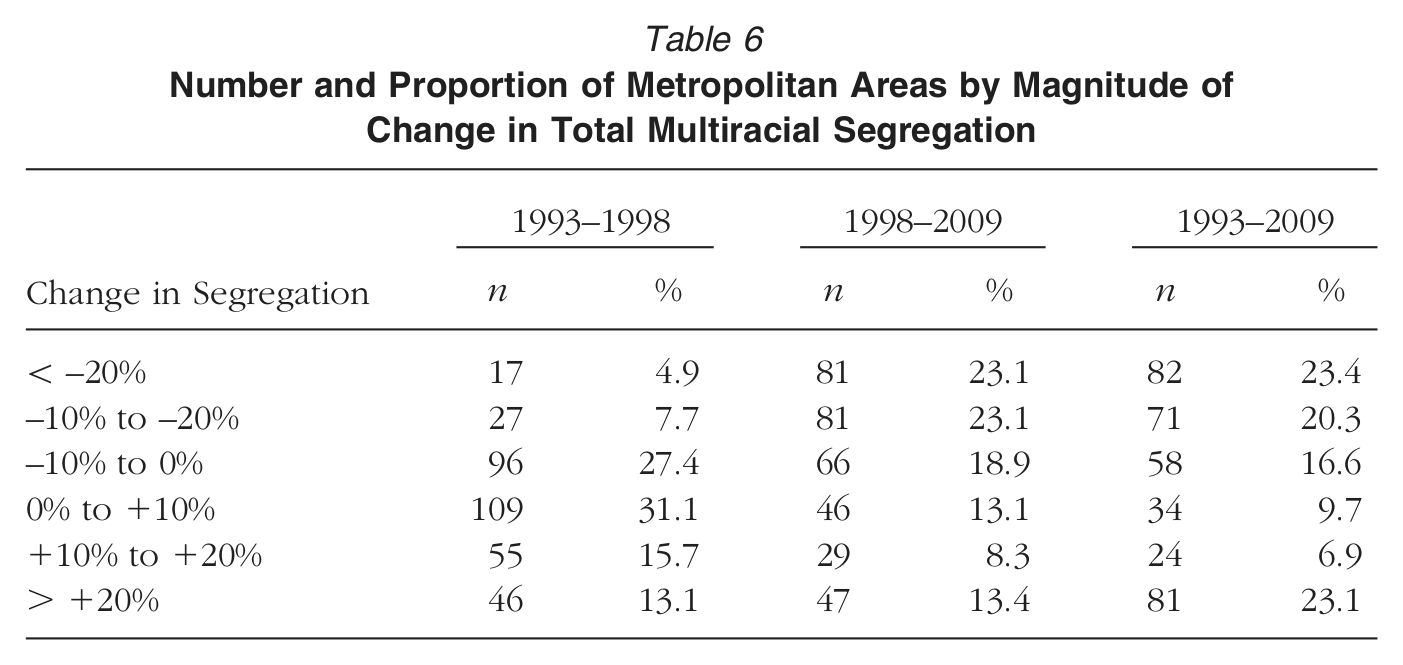
Conversely, between 1998 and 2009, segregation declined in 65.1% of all metropolitan areas (228 of 350), mirroring trends for the United States as a whole. However, segregation worsened in over a third of metropolitan areas (34.9%, or 122 of 350). Not surprisingly, given aggregate trends presented previously, changes in segregation from 1998 to 2009 were generally greater in magnitude than the changes from 1993 to 1998. Indeed, nearly half of all metropolitan areas (46.3%, or 162 of 350) experienced decreases in segregation in excess of 10% between 1998 and 2009. This suggests that the decreases in segregation observed since the late 1990s have been somewhat more widespread and less geographically concentrated than the increases between 1993 and 1998.
As a result of these trends, over the entire study period, the majority of metropolitan area experienced an overall decrease in metropolitan segregation (60.3%), with nearly a quarter (23.4%) experiencing decreases of 20% or more. Interestingly, however, a comparable proportion (23.1%) of metropolitan areas actually experienced increases in segregation of 20% or more over the study period. Supplemental analyses revealed that metropolitan areas experiencing large increases were generally less segregated initially than other metropolitan areas (0.138 vs. 0.243). Moreover, they were substantially less populous than metropolitan areas with smaller increases or declines in segregation (i.e., average population of 24,417 vs. 53,766 in 1993). Given this study’s population weighting procedure, these smaller metropolitan areas likely exerted a relatively weak effect on overall segregation trends.
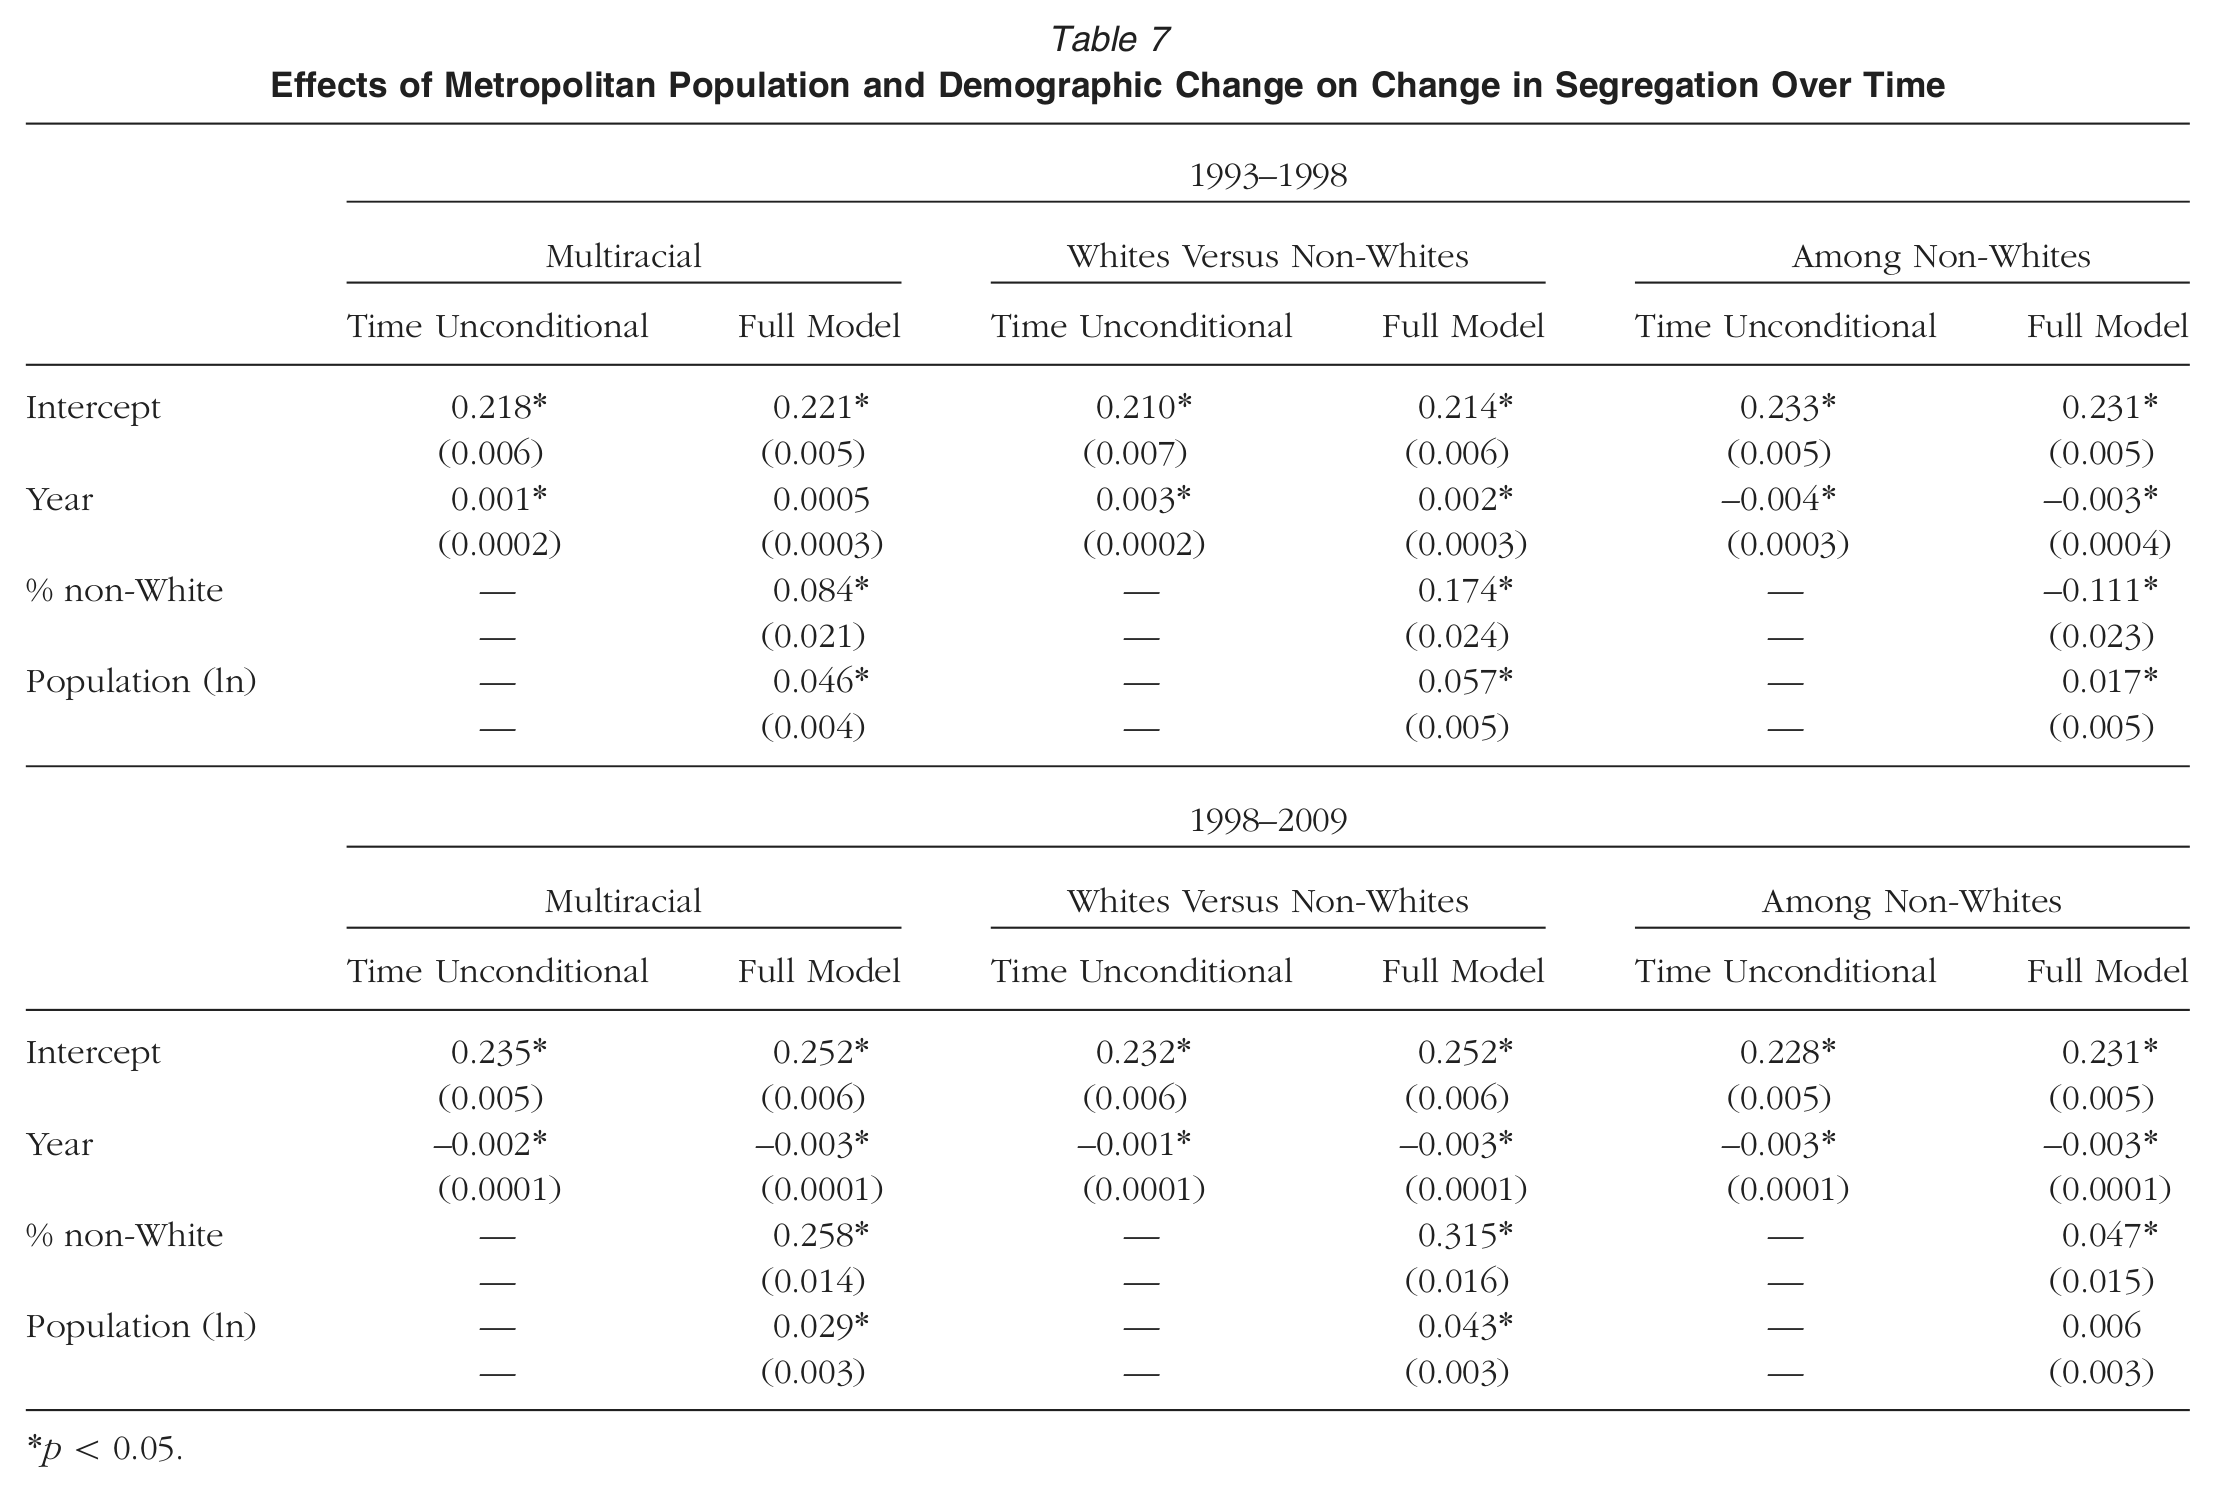
To explicate the sources of variability in segregation trajectories observed across metropolitan areas, we estimate longitudinal models predicting change in segregation as a function of changing metropolitan student demographics. Table 7 demonstrates that across both epochs, change in the proportion of non-White students in a metropolitan area was positively related to changes in multiracial and White/non-White segregation, after controlling for changes in the metropolitan student population. Thus, metropolitan areas with more rapid increases in racial/ethnic diversity experienced larger increases in multiracial and White/non-White segregation from 1993 to 1998 and smaller decreases from 1998 to 2009 than metropolitan areas with more stable or declining proportions of non-White students. Comparable effects were found for metropolitan student population across both epochs, consistent with previous research, which has found a robust relationship between metropolitan population and segregation (Clotfelter, 1999).
Effects of Metropolitan Population and Demographic Change on Change in Segregation Over Time
p < 0.05.
Comparison of the time coefficients in the time-unconditional models and the fully specified models revealed that the time coefficients for multiracial and White/non-White segregation remained positive for the first epoch and negative for the second epoch, even after inclusion of the metropolitan demographic and population predictors. This suggests that changes in the diversity and population of metropolitan areas contributed to some, but not all, of the observed changes in segregation over time. Although it remained positive in the full model, the slope coefficient for multiracial segregation for the first epoch became nonsignificant after including demographic predictors, suggesting that demographic changes may have been the primary driver behind the growth in multiracial segregation over the 1990s.
Segregation among non-White students, which declined steadily over the study period, exhibited slightly different trends from multiracial and White/non-White segregation. As with multiracial and White/non-White segregation, growth in the student population of metropolitan areas was positively related to changes in segregation among non-Whites across both epochs. This relationship was statistically significant in the first epoch but failed to achieve statistical significance in the second epoch. As with multiracial and White/non-White segregation, increases in the diversity of metropolitan areas were positively related to change in segregation among non-Whites since 1998. It should be noted, however, that the strength of the relationship between metropolitan diversity and segregation was much weaker for segregation among non-Whites than for multiracial or White/non-White segregation (0.047 vs. 0.258 and 0.315, respectively). Prior to 1998, however, increases in the diversity of metropolitan areas were negatively related to change in segregation among non-Whites.
The time coefficients for segregation among non-Whites also remained negative and significant even after including predictors capturing demographic and student population change, suggesting that although growth in racial/ethnic diversity and student enrollment contributed to declines in segregation among non-Whites, they are not entirely responsible for the observed trends. This suggests that the steady decreases in segregation among non-Whites since 1993 may also be attributed, in part, to processes independent of demographic change.
Summary of Findings
Analyses reveal that the racial/ethnic resegregation of public schools observed over the 1990s has given way to a period of modest reintegration. Since 1998, multiracial segregation as well as the segregation between Whites and all non-White groups has declined (with the exception of Hispanic-White segregation, which continued to increase until 2003). Segregation among non-Whites, which decreased over the 1990s, has continued its negative trajectory into the 21st century. As a result of these trends, the typical student residing in a metropolitan area is exposed to less segregation today than in 1993. Indeed, on average, students residing in metropolitan areas were exposed to 11% less multiracial segregation, 7% less segregation between Whites and non-Whites, and 15% less segregation among non-Whites in 2009 than in 1993. Although trends for Black-White segregation are promising—Black-White segregation experienced relatively small increases over the 1990s and relatively large increases since 1998—Blacks are still substantially more segregated from Whites than any other group.
Decomposition of total metropolitan segregation into its racial/ethnic and geographic components revealed significant changes in the structure of segregation since the 1990s. Although segregation among non-Whites has declined steadily over the past decades, there has been a significant increase in the share of multiracial segregation attributable to segregation among non-White students since 1998. This finding highlights the increasingly complex nature of spatial stratification by race. In terms of the geographic scale of segregation, a substantial majority of segregation still lies across district boundaries; however, this proportion has stabilized since 1998, halting a long-term shift in the scale of segregation from a within-district to between-district phenomenon. While the increases in segregation over the 1990s were largely a function of increasing segregation across district boundaries, we find that the decreases in segregation since 1998 may be attributed to declines in segregation both within and between districts. District boundaries are more relevant for segregating Whites from non-Whites than for segregating non-Whites from each other. However, non-Whites have become increasingly segregated across district boundaries over the past decades, with substantial increases in the proportion of total segregation attributable to between-district segregation among non-Whites.
Although in the aggregate trends in segregation since 1998 are promising, there was considerable variability among metropolitan areas. Indeed, although 65% of metropolitan areas experienced decreases in multiracial segregation since 1998, more than a third actually experienced increases in segregation. Results of longitudinal analyses assessing the effects of increases in metropolitan racial/ethnic diversity and growth in student enrollment provide insight into the sources of this variability. We find that metropolitan areas with more rapid population growth and, in particular, growth in their non-White student populations experienced larger increases in segregation over the 1990s and smaller decreases in segregation since 1998 than metropolitan areas with more stable populations. However, the segregation trajectories documented via descriptive analyses remained significant even after controlling for these demographic changes, suggesting that factors such as changes in residential sorting, school choice, and other mechanisms of racial/ethnic stratification independent of demographic change have also played a role in both the resegregation and reintegration of schools.
In addition, we find that promising national trends mask the more troubling patterns of Black-White segregation in the formerly de jure segregated South. Although Blacks remain substantially less segregated in the South than in the rest of the United States, the South experienced relatively larger increases in Black-White segregation over the 1990s and smaller decreases in Black-White segregation over the past decade. Consequently, the Black-White segregation gap between the South and the rest of the United States has narrowed significantly.
Discussion
Recent research has painted a bleak picture of the state of racial/ethnic segregation of American schools, arguing that resegregation is steadily eroding the hard-fought victories of the post-Brown era, despite sustained gains in residential segregation by race/ethnicity over the past decades. Moreover, researchers have cited concerns that the current educational climate, including the demise of de jure desegregation policies and the proliferation of school choice options, coupled with the rapid growth in non-White student populations is facilitating the continued de facto segregation of students by race/ethnicity beyond residential patterns. Our analyses provide a somewhat more optimistic view of racial/ethnic segregation trends. Indeed, we find that the past decade has witnessed modest reductions in multiracial segregation and the segregation between Whites and all non-White groups, as well as continued declines in segregation among non-Whites. As a result of these trends, students are less segregated today than they were in 1993.
While we have not found evidence supporting continued widespread resegregation, several important caveats should be noted. First, although our findings suggest that American schools have made incremental progress toward integration over the past decade, especially between Whites and non-Whites, they still fall far short of an equitable realization of the goals of Brown. Although trends for Black-White segregation are particularly encouraging, Blacks remain substantially more segregated from Whites than other racial/ethnic groups, despite the legacy of integration efforts targeted at Blacks. Indeed, Blacks are still more than twice as segregated from Whites as Asians and 1.2 times as segregated as Hispanics.
Second, it is possible that the adverse effects of the educational policies and social and demographic changes discussed earlier may have a longer term effect that is not immediately apparent in rates of segregation. Given the decentralized structures of education, it often takes considerable time for the effects of specific policy or legal developments to filter down to local educational agencies. Thus, it is conceivable that the effects of policies, such as the dismantling of desegregation orders and expanded school choice, may ultimately have adverse effects that have not yet been fully realized. Conversely, it is possible that the gains of the past decade may be a delayed result of the legacy of aggressive legal interventions from prior decades.
Third, although overall metropolitan school segregation has declined since 1998, it should be emphasized that not all metropolitan areas experienced such encouraging trends. While roughly two-thirds of metropolitan areas in the study experienced overall decreases in multiracial segregation since 1998, 35% of the metropolitan areas experienced increases in segregation over the same period. Trends in the South provide a troubling contrast to the trends in the rest of the United States. Indeed, despite the historical emphasis on the desegregation of Blacks and Whites in the formerly de jure segregated South, we find that the South experienced larger increases in Black-White segregation than the rest of the United States over the 1990s as well as smaller decreases since 1998 (albeit in the context of larger increases in multiracial segregation). Previous researchers (e.g., Frankenberg et al., 2003; Orfield & Yun, 1999) have expressed concern regarding the potential for the end of desegregation policies and the proliferation of unitary status declarations over the past decades to facilitate resegregation in the formerly de jure segregated South. These concerns have been substantiated by recent evidence directly examining the link between the release from court-ordered desegregation and subsequent segregation rates (e.g., An & Gamoran, 2009; Clotfelter, Ladd, & Vigdor, 2006; Lutz, 2011; Reardon, Grewal, Kalgorides, & Greenberg, 2012). While this study cannot directly link unitary status declarations at the local level to global rates of segregation, our findings are consistent with the argument that the erosion of desegregation policies has served to attenuate, but not reverse, the progress toward integration in the South.
In addition, metropolitan areas with more rapid population growth and greater increases in racial/ethnic diversity generally experienced smaller declines in segregation than metropolitan areas with more stable compositions. Given that the United States is projected to experience continued growth in non-White populations over the next decades, these demographic shifts may serve to attenuate gains in integration and facilitate global increases in segregation in the longer term. Unfortunately, however, this research cannot provide insight into the specific causal mechanisms by which increases in diversity exacerbate segregation. Because the measure of segregation used in this study is generally not biased by racial composition, the segregation resulting from increases in diversity is not merely an artifact of increasing diversity, but suggests that demographic changes are being accompanied by a process of stratification, such as differential birthrates and geographically concentrated residential in-migration. However, additional research is warranted to explicate the causal link between increases in racial/ethnic diversity and increases in segregation.
Although our analyses do not provide direct evidence as to why segregation is declining, the finding that it is generally improving despite the stratifying effects of waning school desegregation in the South and sustained growth in racial/ethnic diversity, in the context of proliferating school choice options, highlights the need for alternative narratives of school segregation. In particular, explaining the shift from resegregation to reintegration may require explanations that are less narrowly focused on educational policies and more broadly attentive to the multifactorial contexts in which schools are situated.
For example, the curvilinear form of the change in school segregation over time may reflect the confluence of the erosion of desegregation policies and improvements in residential segregation. Thus, while retrenchment on desegregation may have yielded small increases in Black school segregation over the 1990s, these may have been offset by larger sustained decreases in the residential segregation of Blacks over the past decade (Charles, 2003; Iceland et al., 2002; Timberlake & Iceland, 2007). Consistent with this interpretation, Ong and Rickles (2004) found that increases in Black school segregation over the 1990s outpaced changes in residential segregation, a finding that may be attributed to reductions in the enforcement of desegregation. Further research addressing current residential segregation trends is warranted to disentangle the effects of legal decisions and changing residential patterns on school segregation.
Another potential explanation for the curvilinear trends in segregation is the shifting importance of race/ethnicity vis-à-vis social class as a mechanism of residential and educational stratification. An emerging body of research on residential segregation has suggested that reductions in segregation by race/ethnicity have been accompanied by growth in segregation by socioeconomic status. While race and ethnicity remain important dimensions of segregation, they are being partially supplanted by socioeconomic status as a mechanism of residential stratification (e.g., Iceland & Wilkes, 2006; Massey & Fischer, 1999; Massey, Rothwell, & Domina, 2009; M. J. Fischer, 2003; Reardon & Bischoff, 2011; Rothwell & Massey, 2010). Likewise, it is possible that the declines in racial/ethnic segregation of schools may be attributable to the increasing salience of class as a mechanism of segregation over the past decade. However, further research is necessary to directly examine the relationship between racial/ethnic and socioeconomic segregation in American schools. Unfortunately, evidence on socioeconomic segregation in schools is relatively limited, often undermined by the lack of large-scale, valid data on student socioeconomic status (Harwell & LeBeau, 2010).
That the proportion of multiracial segregation attributable to segregation among non-White students is increasing even as rates of non-White segregation are decreasing underscores the need for research and policy that considers the increasingly multiethnic character of segregation. This suggests that policies seeking to desegregate Whites from non-Whites and, in particular, Whites from Blacks—historically, the central focus of most desegregation policies—may fail to address the increasingly important dimension of segregation among non-White students. Sensitive to this shift, researchers are increasingly reporting multiracial indices of segregation in addition to traditional dichotomous indices; in addition, a number of researchers have called attention to the problem of segregation of Asians and Hispanics (e.g., Orfield & Glass, 1994). However, research still often relies on dual-group measures capturing the segregation of minorities from Whites and may therefore neglect important interactions among different minority racial/ethnic groups. Although an examination of the segregation among different minority groups (e.g., Black-Hispanic segregation or Hispanic-Asian segregation) falls outside the purview of this study, further research should examine dynamics between specific racial/ethnic groups to determine what is driving this effect. Moreover, future research should seek to explore the troubling finding that non-Whites are becoming increasingly segregated from other non-Whites across district boundaries, such as through racial differences in patterns of suburbanization or growth in ethnic enclaves.
The finding that the majority of segregation continues to lie between districts, especially for Black-White segregation, highlights the importance of integration solutions transcending district boundaries. Indeed, more than 60% of segregation lies between districts, meaning that overall metropolitan segregation could only be reduced by 40% even if students were perfectly integrated across the schools in their districts. As others have noted (e.g., Reardon et al., 2000), while this would certainly yield a substantial reduction in segregation, a more complete realization of the goals of integration would seem to require interdistrict solutions to mitigate the effect of district boundaries on the sorting of students by race/ethnicity. Unfortunately, in the absence of any legal means of compelling integration across district boundaries (the legacy of the Milliken ruling), such interdistrict arrangements must be undertaken voluntarily. Although interdistrict integration policies have been heralded by many reformers as a promising avenue for integration efforts (Holme & Wells, 2008; Kahlenberg, 2006), they are yet to gain much policy traction and are exceedingly rare in practice.
Footnotes
Notes
K
M