
Abstract
Recent evidence on the large variance in teacher effectiveness has spurred interest in teacher labor markets. Research documents that better qualified teachers typically work in more advantaged schools but cannot determine the relative importance of supply versus demand. To isolate teacher preferences, we document which schools prospective teachers interviewed at during job fairs in Chicago. We find substantial variation in the number of applicants per school, ranging from under five to over 300. Schools serving more advantaged students have more applicants per vacancy, on average, and teacher preferences vary systematically by their own demographic characteristics. School geographic location is highly predictive of applications, even after controlling for distance from applicants’ home addresses and a host of school and neighborhood characteristics.
Keywords
Interest in the distribution of teachers across schools has grown in recent years. Race to the Top, President Obama’s $4 billion state-level grant competition aimed at school improvement, emphasizes recruiting and retaining effective teachers, particularly in disadvantaged schools and districts. This renewed focus on teachers as a key element of education reform stems, at least in part, from a substantial body of research indicating that teachers make an important contribution to student achievement and that teacher quality varies substantially (Aaronson, Barrow, & Sander, 2007; Hanushek, Kain, O’Brien, & Rivkin, 2005; Nye, Konstantopoulos, & Hedges, 2004; Rockoff, 2004).
The knowledge that teachers matter has been accompanied by an increased interest in understanding teacher labor markets. Studies examining the distribution of teachers across both districts and schools have found that teachers in urban schools serving large concentrations of low-income and minority children are more likely to be inexperienced (Clotfelter, Ladd, & Vigdor, 2005, 2006; Lankford, Loeb, & Wyckoff, 2002; Rockoff, 2004), teaching out-of-field (Ingersoll, 2003), and uncertified. Urban teachers serving disadvantaged students also have lower standardized test scores, on average, and tend to have graduated from less competitive colleges and universities than their suburban counterparts (Lankford et al., 2002).
A substantial body of research has also examined teacher mobility. Teachers who switch schools generally move to schools with lower concentrations of minority and disadvantaged students and higher levels of student achievement (Boyd, Lankford, Loeb, & Wyckoff, 2005b; Hanushek, Kain, & Rivkin, 2004; Hanushek & Rivkin, 2007; Scafidi, Stinebrickner, & Sjoquist, 2007). Further, teachers who transfer schools or exit the profession often have better qualifications (e.g., higher certification exam scores) than those who remain (Boyd et al., 2005b; Goldhaber, Gross, & Player, 2007). Thus, evidence indicates that both teacher mobility and exits exacerbate observed inequities in the distribution of teachers across schools and districts.
It is important to note that while, on average, teachers who transfer schools move to schools serving more students who are nonminority, higher achieving, and from higher income households, this is not the case among all teachers. Specifically, White teachers typically transfer to schools serving more nonminority students, while African American teachers move to schools serving more African American students (Hanushek et al., 2004; Hanushek & Rivkin, 2007).
Another factor that appears to strongly influence where teachers choose to teach is geography (Boyd et al., 2005a, 2005b; Reininger, 2012). Boyd and colleagues (2005a) found teacher labor markets to be surprisingly small. In New York State, teachers tend to teach close to where they grew up or in areas similar to where they are from. Reininger (2012) replicated these findings using nationally representative data, finding teachers to be more likely to remain near their place of origin than the vast majority of other professionals. The fact that teacher labor markets are small and that teachers appear to have stronger preferences for remaining close to home than other professionals is particularly concerning for geographically isolated urban neighborhoods with large concentrations of poverty. These areas may experience a shortage of qualified applicants, in part, because of the unique locational preferences of teachers and the fact that geographically isolated urban neighborhoods are likely to house fewer qualified residents (Boyd et al., 2005a).
While we know that disadvantaged students are more likely to be taught by less qualified teachers, we know little about whether this disparity is caused by decisions on the part of teachers or school administrators. The distribution of teachers across schools is a product of both supply and demand. Thus, it is difficult to parse out the extent to which this distribution results from supply- (teachers’ decisions to apply to jobs in particular districts or schools) versus demand-related factors (principals’ hiring preferences or district rules and regulations). Further, studies of teacher mobility generally cannot tell us whether a teacher’s exit from a particular school resulted from a decision made by the teacher or an administrator.
One important exception is a recent analysis that isolated teacher and administrator preferences using data on teacher applications to transfer schools in New York City (Boyd, Lankford, Loeb, Ronfeldt, & Wyckoff, 2011). The authors found teachers with better preservice qualifications to be more likely to apply to transfer. Teachers with higher estimated value-added, however, were less likely to do so. While this study makes an important contribution, it is unclear whether we can generalize its findings beyond experienced teachers seeking to transfer schools.
A recent study of prospective teachers’ reported preferences for school characteristics in one metropolitan area used both surveys and interviews to examine what qualities they look for in schools (Cannata, 2010). On surveys, prospective teachers emphasized school characteristics such as high-quality leadership and strong mentoring and support for new teachers. However, when interviewed about the job search, candidates frequently reported making decisions based on district characteristics. These prospective teachers used information on student demographic characteristics when determining where to apply (i.e., racial/ethnic composition, proportion of free lunch–eligible students) and described seeking familiar contexts that were geographically close to where they lived and/or compositionally similar to where they were from.
Theoretical Framework
As we note previously, prior research finds that teachers have strong preferences for “staying local” (Boyd et al., 2005a; Reininger, 2012). Research and theory in urban geography suggest that preferences in female-dominant professions such as teaching (approximately three-quarters of the Chicago Public Schools applicant pool were women in 2006) might result in teachers preferring to teach close to where they reside. Further, research in urban geography may also help us understand teachers’ preferences in Chicago in particular, a city that is highly racially segregated (Glaeser & Vigdor, 2012) and contains geographically isolated neighborhoods with large concentrations of African American residents living in extreme poverty (Massey, Gross, & Shibuya, 1994).
Originally, scholarship in urban geography conceptualized the relationship between residential and occupational location as one where choices regarding where to live were driven by the location of an individual’s work (Alonso, 1964). However, more recent theoretical and empirical work has found that many people, particularly women, make decisions regarding where to work based on their residential location (Hanson & Pratt, 1988). Women are more likely to work closer to home, work within their local communities, and minimize commuting time (Clark, Huang, & Withers, 2003; Hanson & Johnston, 1985; Hanson & Pratt, 1988; Madden, 1981). Interestingly, employment opportunities in occupations in which women comprise the majority of the workforce, such as teaching, tend to be distributed evenly within a labor market (Metropolitan Statistical Area), whereas male-dominated fields tend to be clustered within certain neighborhoods (Hanson & Johnston, 1985). Thus, we might expect teachers to exhibit a strong preference to teach close to where they live.
When teachers transfer schools they tend to move to schools serving larger concentrations of students with whom they share race/ethnicity (Hanushek et al., 2004; Hanushek & Rivkin, 2007). Recent research also finds that teachers report higher job satisfaction and are less likely to leave their jobs when they work for a same-race principal (Grissom & Keiser, 2011). Evidence also indicates higher levels of student achievement (Dee, 2004) among African American students who are taught by same-race teachers.
More generally, a large body of research in sociology finds that homophily tends to dominate social networks. People are more likely to engage with others who are similar to them, resulting in homogeneity in social and professional networks. Homophily in race and ethnicity has been found to create the strongest societal divides, with education and occupation also playing an important role (McPherson, Smith-Lovin, & Cook, 2001). Homophily in terms of race/ethnicity is evidenced in studies of teacher sorting and the effect of racial congruence between principals and teachers (Grissom & Kaiser, 2011; Hanushek et al., 2004; Hanushek & Rivkin, 2007) and has also been observed in terms of educational background among principals and teachers (Baker & Cooper, 2005).
The Current Study
The current study is the first to provide evidence on prospective teachers’ revealed, as opposed to reported (survey or interview), preferences. We present analyses of a unique data set that contains information on which schools prospective teachers chose to do initial interviews with at Chicago Public Schools (CPS) job fairs to explore the distribution of the teacher applicant pool within a large urban district. Many school districts maintain teacher applicant files centrally. However, in most cases, like CPS, the schools to which prospective teachers apply remain unknown, making it impossible to examine variation in the characteristics and qualifications of candidates applying to different types of schools within a district.
In the summer of 2006, we attended three large job fairs hosted by CPS. At the job fairs, we compiled extensive data on the schools that job fair attendees expressed interest in. We link these data to administrative files containing candidates’ demographic information, allowing us to examine differences in applicant qualifications across schools. These data allow us to describe the preferences of an entire district’s applicant pool, 1 expanding on recent contributions to understanding teacher preferences made by Boyd and colleagues (2011) and building on research aimed at understanding prospective teachers’ reported preferences for school characteristics (Cannata, 2010). We explore variation in the number of job fair applicants across schools. Specifically, we seek to answer the following questions:
Research Question 1: How does the number of prospective teacher applicants per school vary by school and neighborhood characteristics?
Research Question 2: Which school and neighborhood characteristics are the most important predictors of where prospective teachers apply?
Research Question 3: How do preferences vary across subgroups of prospective teachers?
Research Question 4: How important is distance from school, net of other factors, in predicting whether a prospective teacher will apply to a particular school?
We anticipate that teacher preferences for schools in the application process will reflect preferences suggested in previous research on teacher mobility (Boyd et al., 2005b; Hanushek et al., 2004; Scafidi et al., 2007). We hypothesize that teachers, on average, will be more likely to apply to schools serving more economically advantaged students, students who are higher achieving, and students who are White, conditional on the number of vacancies in the school and other variables.
Based on the large body of evidence documenting homophily, particularly with regard to race/ethnicity (McPherson et al., 2001), prior research on teacher mobility (e.g., Hanushek et al., 2004), as well as recent research on teachers’ reported preferences (Cannata, 2010) and evidence that principals treat same-race teachers differently (Grissom & Keiser, 2011), we hypothesize that teacher preferences—expressed by which schools they apply to at job fairs—will vary systematically by teacher race and ethnicity. Specifically, we expect that African American and Hispanic teachers will be more likely to apply to schools serving larger proportions of racial and ethnic minority students.
We hypothesize, based on both prior research on teacher applications to transfer (Boyd et al., 2011) and evidence regarding homophily in occupation, education, and social class in society in general (McPherson et al., 2001) and among educators in particular (Baker & Cooper, 2005; Hanushek et al., 2004; Hanushek & Rivkin, 2007), that teachers with better preservice qualifications (i.e., those who attended more selective undergraduate institutions) will apply to schools serving larger proportions of high-achieving and more advantaged students. Finally, based on theory and research in urban geography, we hypothesize that teachers will express a strong preference to teach near their current residence (Hanson & Johnston, 1985; Hanson & Pratt, 1988). Thus, we anticipate that job fair applicants will be more likely to apply to schools that are closer to where they live.
To our knowledge, this is the first study using data on prospective teachers’ revealed preferences—the schools to which they actually applied at job fairs—to understand teacher preferences for school characteristics. Thus, our findings provide new information about applicants’ actions as they look for jobs, expanding on the work of Boyd et al. (2011) who used data on within-district applications to transfer in New York City, by using data on the preferences of a large pool of prospective teachers in Chicago, and building on Cannata’s (2010) study of prospective teachers' reported preferences. It is the first study to document variation in the number of applicants across schools.
Background on CPS Teacher Recruitment and Hiring
CPS principals interview and select the teachers for their schools autonomously. The CPS Department of Human Resources (HR) provides extensive support and resources to principals for the hiring process. The district maintains a large database of job applicants for principals who are hiring, as well as a database of open positions for applicants. Principals, however, are not required to hire from this database. HR is also charged with processing new teachers into the system and completing the hiring process once a teacher accepts an offer.
Over the past decade, CPS HR has implemented a comprehensive array of events and services aimed at recruiting teachers into the district. Efforts have been made to go beyond what has traditionally been a highly localized recruitment and hiring process to search regionally and even nationally for qualified teachers. CPS provides information sessions, both virtual and in person, to answer potential teaching candidates’ questions about CPS, Chicago, and the hiring process. HR also participates in numerous college and university job fairs throughout the Midwest and invites qualified candidates to participate in “bus tours” that provide direct contact with school personnel and the opportunity to see Chicago neighborhoods firsthand. Job candidates and school principals also have access to an extensive online database that holds information about teaching vacancies and provides principals with the opportunity to search for applicants and view their information and resumes.
Perhaps the most intensive recruitment effort on the part of CPS has been the development of large-scale job fairs, exclusively for qualified teachers, hosted by the district. In 2006, the district held two smaller fairs during late winter/early spring and then hosted three large-scale job fairs during late spring and summer. The larger job fairs were held at the largest venues in Chicago (Navy Pier, Soldier Field, and The United Center) and hosted over 200 schools and 2,000 to 3,000 teacher candidates per event. During the fairs candidates had the opportunity to drop off resumes and participate in preliminary interviews with school principals and administrators.
Table 1 provides basic information on teachers who applied to CPS for the 2006–2007 school year. Nearly 20,000 individuals applied to the district in 2006. Almost three-quarters of applicants were women and the majority was White (roughly 20% of the applicant pool reported to be African American). Of applicants for whom we were able to obtain degree information (two-thirds of the total sample), over 60% majored in education in college. Approximately 40% attended undergraduate institutions ranked as very competitive or higher by Barron’s. Approximately 60% of applicants report prior teaching experience. Some individuals applied online while others submitted applications by mail and HR personnel entered their information into the electronic teacher applicant database.
Characteristics of All Teacher Applicants, Applicants Who Attended Job Fairs, and Job Fair Applicants Who Were Hired in 2006–2007
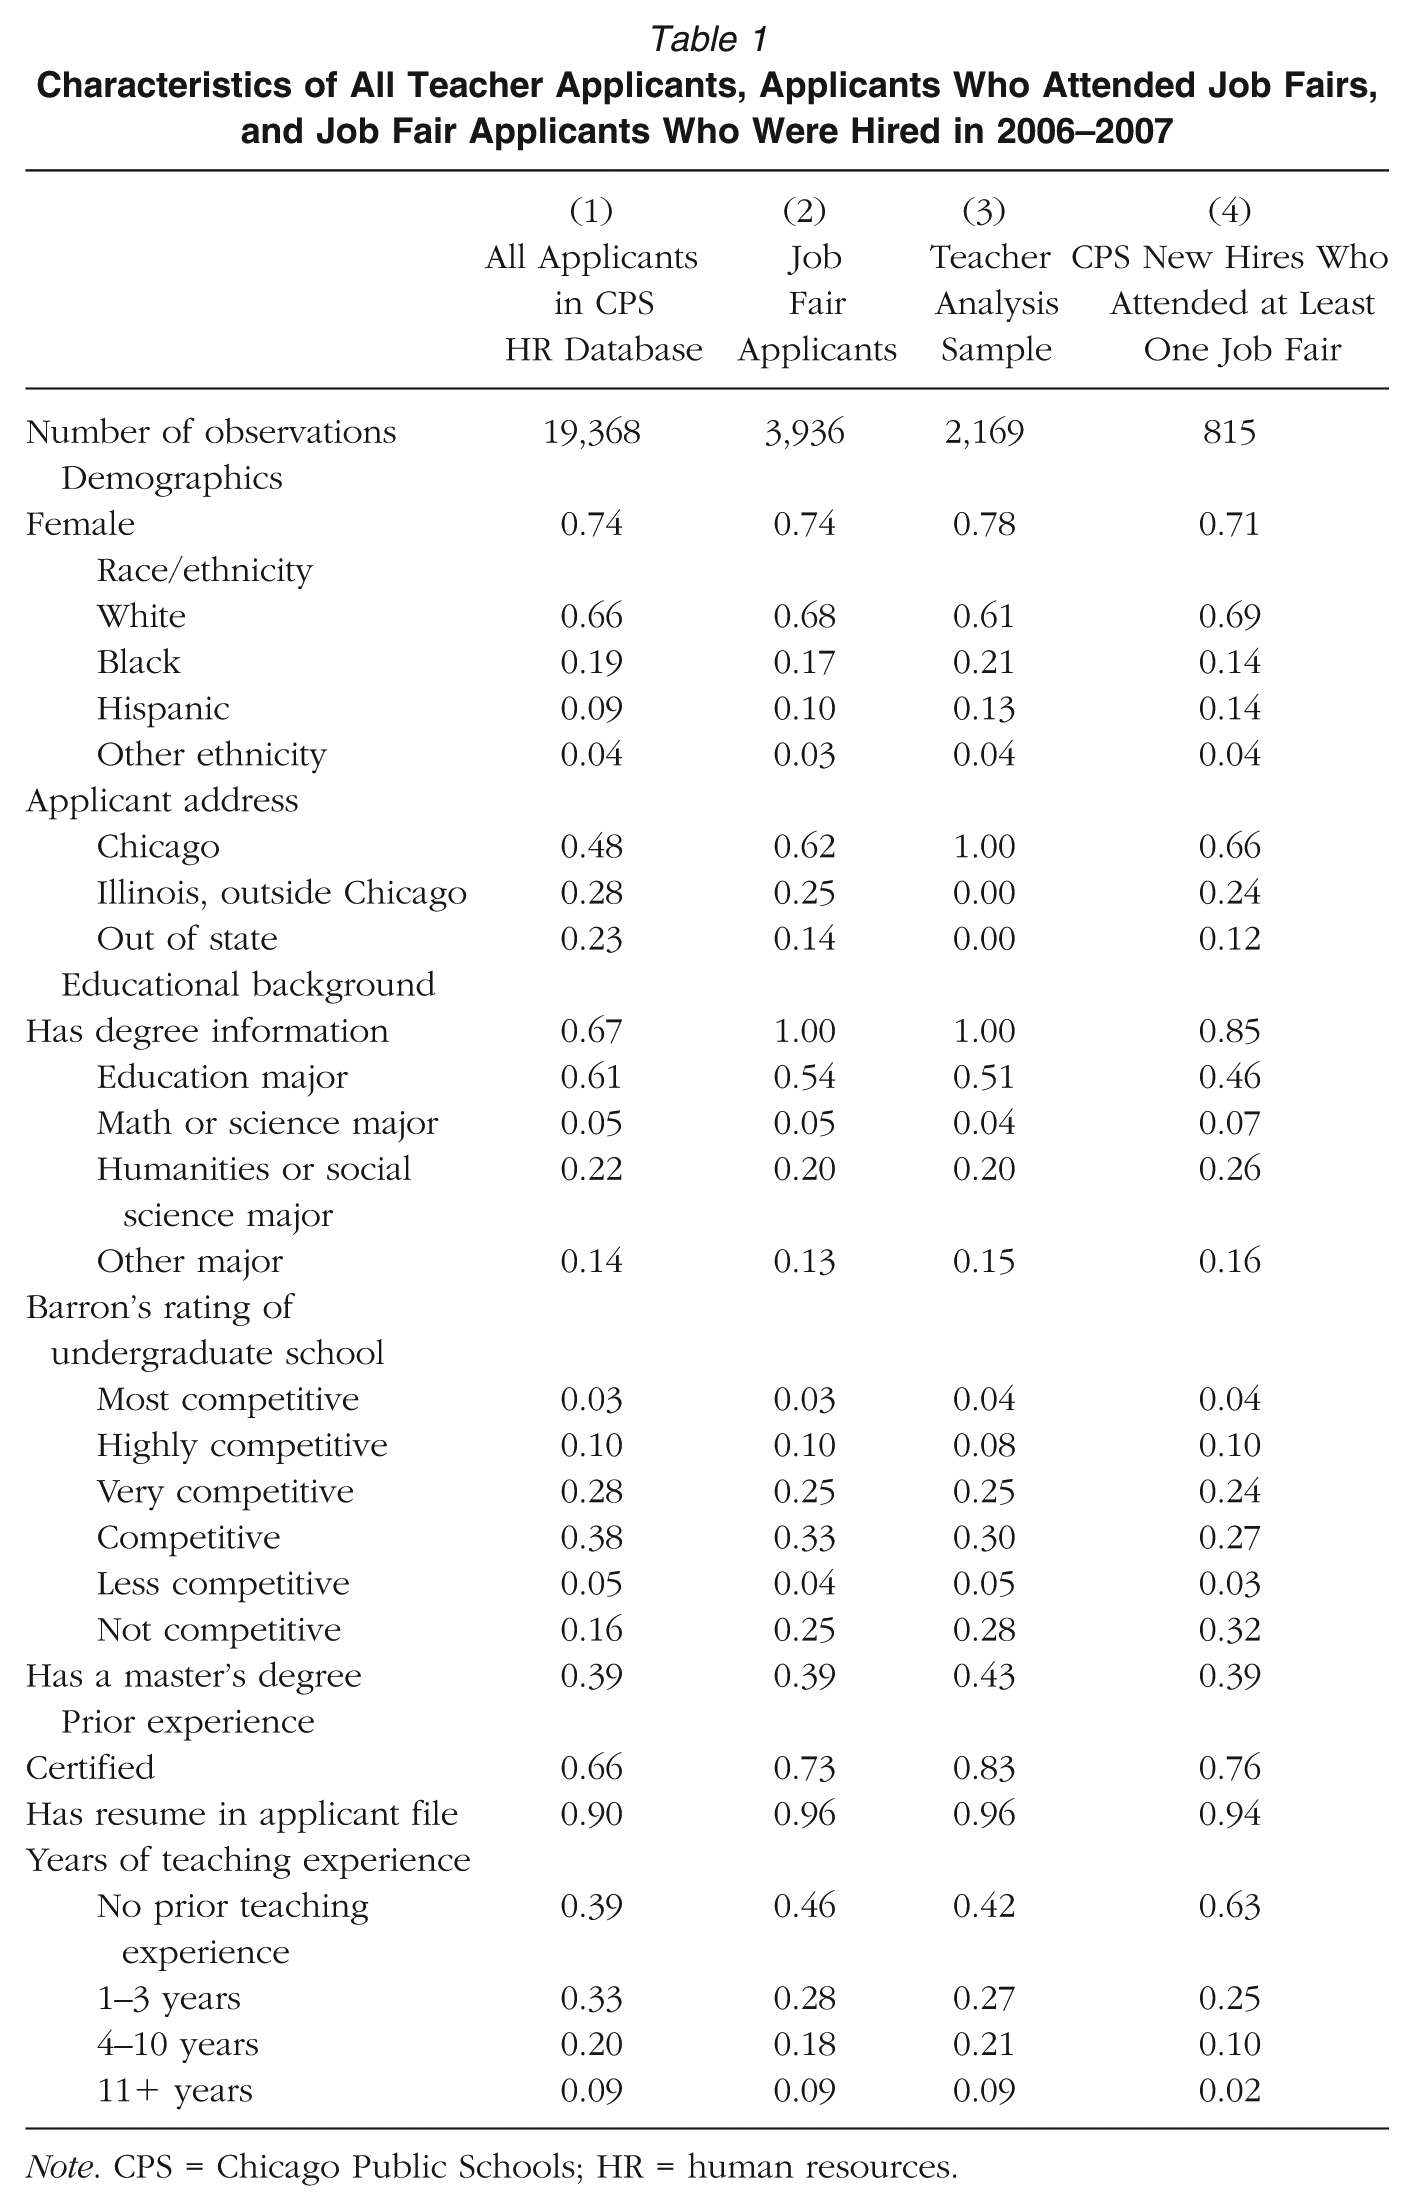
Note. CPS = Chicago Public Schools; HR = human resources.
Column 2 provides comparable information for the nearly 4,000 job fair applicants whom we were able to match to the central database of applicants. Thus, the job fair applicants described in Column 2 are a subgroup of the applicants in Column 1. Job fair applicants, overall, are quite similar to the population of prospective teachers who applied to the CPS in 2006. They are more likely to reside in Chicago (and less likely to reside out of state) than applicants as a whole. They are also somewhat less experienced and more likely to be certified. Column 3 provides the same descriptive statistics for the analysis sample used for the results reported in Table 7. These are applicants who attended at least one job fair, had valid address data in the applicant database, and resided in the city of Chicago when they applied. This subset of job fair applicants is somewhat more likely to be female and less likely to be White than the larger group of job fair applicants. As Columns 2 and 3 indicate, applicants who attended job fairs are more likely to have bachelor’s degrees from institutions with Barron’s ratings that are considered noncompetitive.
Column 4 provides comparable information on teachers who attended at least one job fair and were newly hired by CPS for the 2006–2007 school year. The 815 job fair attendees who were hired are generally similar to the applicant pool as a whole. Interestingly, approximately one-third of the new hires attended undergraduate institutions with noncompetitive Barron’s ratings compared with 16% of all applicants in the HR database and 25% of applicants who attended job fairs. New hires are similar to the larger applicant pool in terms of the proportion that hold a master’s degree and are more likely to be certified than full applicant pool. 2
CPS new hires were also less experienced, on average, than the applicant pool as a whole. Sixty-three percent of new hires had no prior teaching experience, compared with 39% of applicants. It is important to recognize that new hires reflect both demand factors (which applicants were offered positions) and supply factors (which candidates accepted the offers). The numbers in Table 1 do not explain whether differences between CPS applicants and eventual hires result from decisions on the part of principals or on the part of applicants themselves. However, the descriptive information in Column 2 indicates that job fair applicants are more similar to eventual CPS hires (Column 4) than are the larger pool of applicants (Column 1).
Data and Methods
The data for the analyses that follow are drawn from a number of sources, including electronic teacher applications to the district, school-level information about the number of vacancies and the needs of individual schools in various subject areas, and information about the schools to which each candidate applied.
During the summer of 2006, we collected data at the three large CPS job fairs. The goal of this data collection effort was to gather information detailing each of the individual schools that job candidates applied to at the fairs. To obtain this information, prior to each job fair we acquired the list of schools registered to attend the fair from staff in CPS HR. Each school that attends a CPS job fair has an individual table at the fair where the school principal and/or administrators sit, place relevant literature and information, accept resumes, and interview candidates. We used the list provided by CPS HR to generate school-level sign-in sheets for every school that attended each of the three job fairs. With the support of HR staff, during a meeting at the job fair venue immediately before each job fair began, we informed all participating principals about the process, explaining that the sign-in sheets were being provided so that every job candidate who visited the schools’ table would sign the sheet and provide the last four digits of his or her social security number. Sign-in sheets were placed on each school’s table directly in front of the principal and other administrators who were available to talk with and interview applicants as they circulated through the fair and approached individual schools.
The CPS job fairs are large, chaotic, and crowded. To improve our chances of collecting complete and accurate data, the authors and several research assistants attended each fair and circulated throughout the room during the event. We reminded principals and school personnel to ask all applicants to sign the sign-in sheets when they approached the schools’ tables. To encourage principals to use the sign-in sheets, we offered to provide them with copies after each fair to help them keep track of applicants. Throughout each fair, we circulated and answered principals’ questions, provided additional sign-in sheets, and worked to ensure that sign-in sheets were being used by all schools and signed by all applicants. As school administrators prepared to leave the fair, we collected their sign-in sheets.
Our sign-in data generally indicate that a teacher stopped at a school’s table, signed his or her name, and spoke with the principal (or another administrator representing the school at the fair) for 5 to 10 minutes about themselves and the open positions at the school. We obtained sign-in data for approximately 87% of the 371 schools that attended job fairs during the summer of 2006. The sign-in data for the remaining schools were incomplete or problematic, most often because these schools arrived at the fair very late or left very early. Among schools whose administrators departed early, a number left sign-in sheets on their tables after they left and teacher candidates frequently listed their names on these sheets to receive additional information about the school. While this does indicate some interest on the part of the candidate, it is different from waiting in line and interviewing with a school’s principal. Thus, we exclude this information from our analysis. In other cases, we observed some schools that did not utilize the sign-in sheets, and a handful of schools refused to participate in the study. Other schools with problematic data had so many applicants lined up at their tables or had such a loosely organized means for interviewing and screening candidates that they failed to use the sign-in sheets consistently.
Table 2 provides summary statistics for CPS schools, comparing schools that participated in 2006 job fairs with those that did not. Participating schools were more likely to serve a predominately African American student population and less likely to serve predominately Hispanic students. Job fair schools were larger and lower achieving, on average, than schools that did not participate. Not surprisingly, schools that participated in job fairs reported more job openings in May of 2006 than those that did not, nearly six openings on average versus four, respectively. Although charter schools are allowed to participate in CPS job fairs, they are excluded from descriptive tables and from the analysis sample because the majority of charter schools attending the job fairs were part of charter organizations that interviewed candidates centrally for position openings in multiple schools. Thus, we are unable to disaggregate applications for individual charter schools.
Demographic Characteristics of Chicago Public Schools (CPS) That Participated in Job Fairs, Schools That Did Not, and by Quality of Sign-In Data (n = 583)

Note. Actual sample size varies due to missing data for individual variables. Table and results that follow do not include charter schools, special education schools, or alternative schools. The coefficients in Columns 3 and 7 are estimates from bivariate regressions predicting the variable from that row using whether schools attended at least one job fair (3) or whether job fair schools had problematic sign in data (7). Columns 4 and 8 are the p-values for coefficients in Columns 3 and 7, respectively.
Columns 5 through 8 compare the schools attending job fairs that had usable sign-in data (our analysis sample, n = 321) to schools attending the job fairs with incomplete or problematic data. Schools with problematic sign-in data were more likely to be predominately African American and were lower achieving than schools with usable sign-in data. Schools that are excluded from our analyses because of poor sign-in data also had an average of two more open positions in May 2006.
The number of candidates that interviewed at each school (the sign-in count) serves as the outcome measure in our analyses. We view this measure—number of job fair applications—as a measure of teacher interest in the school. However, it has several important limitations. First, it contains some measurement error, as not every teacher who interviewed at the school signed the sheet. To the extent that this is classical measurement error in a dependent variable, however, it will merely make our regression estimates less precise without introducing bias. Second, we observed that in some cases candidates were not willing to wait in very long lines to interview with particular schools. Wait time across schools varied from no wait to over an hour for schools with long lines. Typical wait times were about 10 to 15 minutes. From our observations at the job fairs, the handful of schools with unusually long lines were typically elementary schools that were widely known as particularly “good” schools as measured by average student achievement levels. We observed a number of instances where prospective teachers would exit the long line prior to signing in and interviewing at the school. For this reason, our measure may actually understate teacher interest in the most popular schools. This will tend to bias our regression estimates toward zero, suggesting that our results may underestimate the relationship between school characteristics and teacher labor supply.
With these limitations in mind, it is important to note that there is still substantial variation in the number of job fair applications across schools. Figure 1 shows a histogram of the number of applications per school using the total number of applications to the school across all three fairs. Table 3 provides participation and vacancy information reported by schools. The number of applicants per school varies substantially, with an average of 55 job fair applicants per school per fair and a standard deviation of 37. Schools at the 10th percentile had 18 applicants per fair, compared with 102 applicants for schools at the 90th percentile.
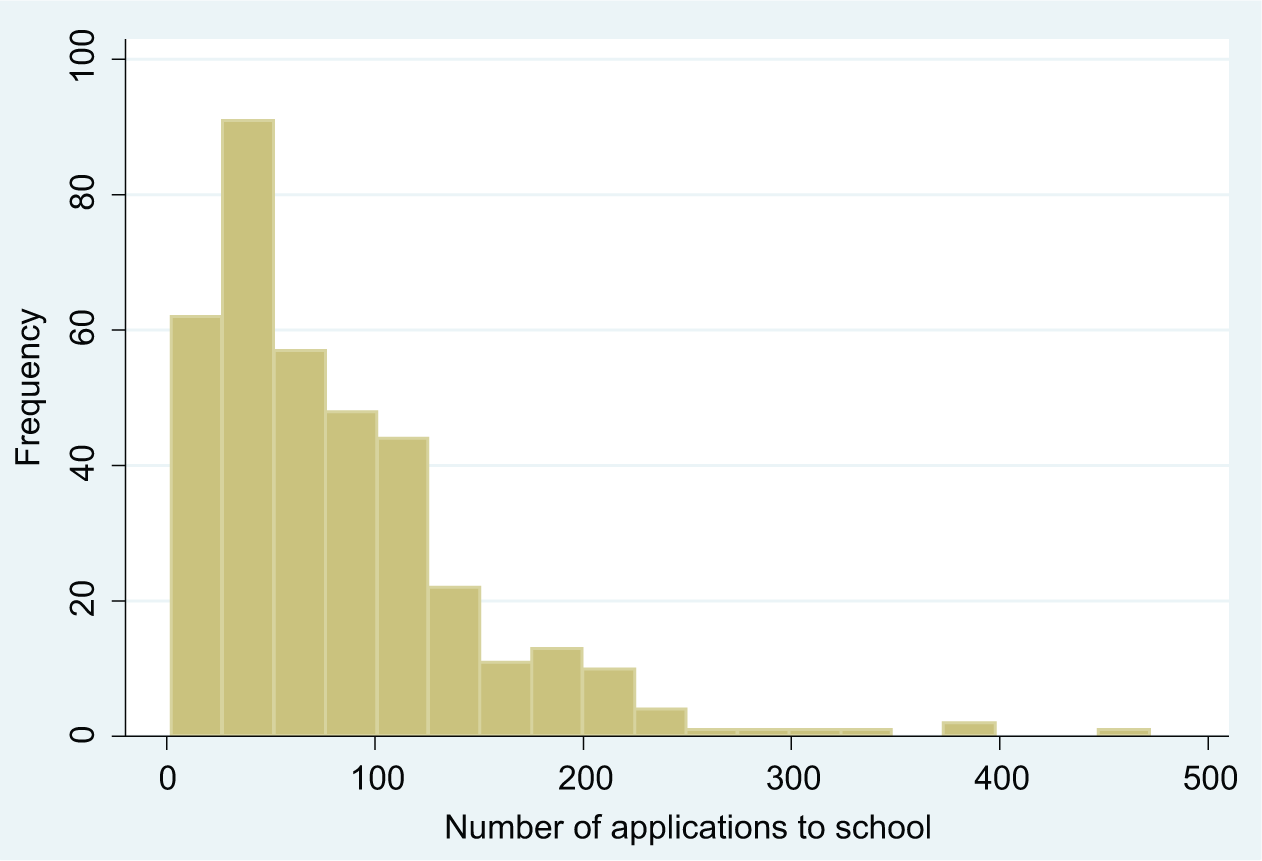
Histogram of applicants per school for all summer 2006 job fairs.
Summary Statistics for Chicago Public Schools Participating in the Summer 2006 Job Fairs
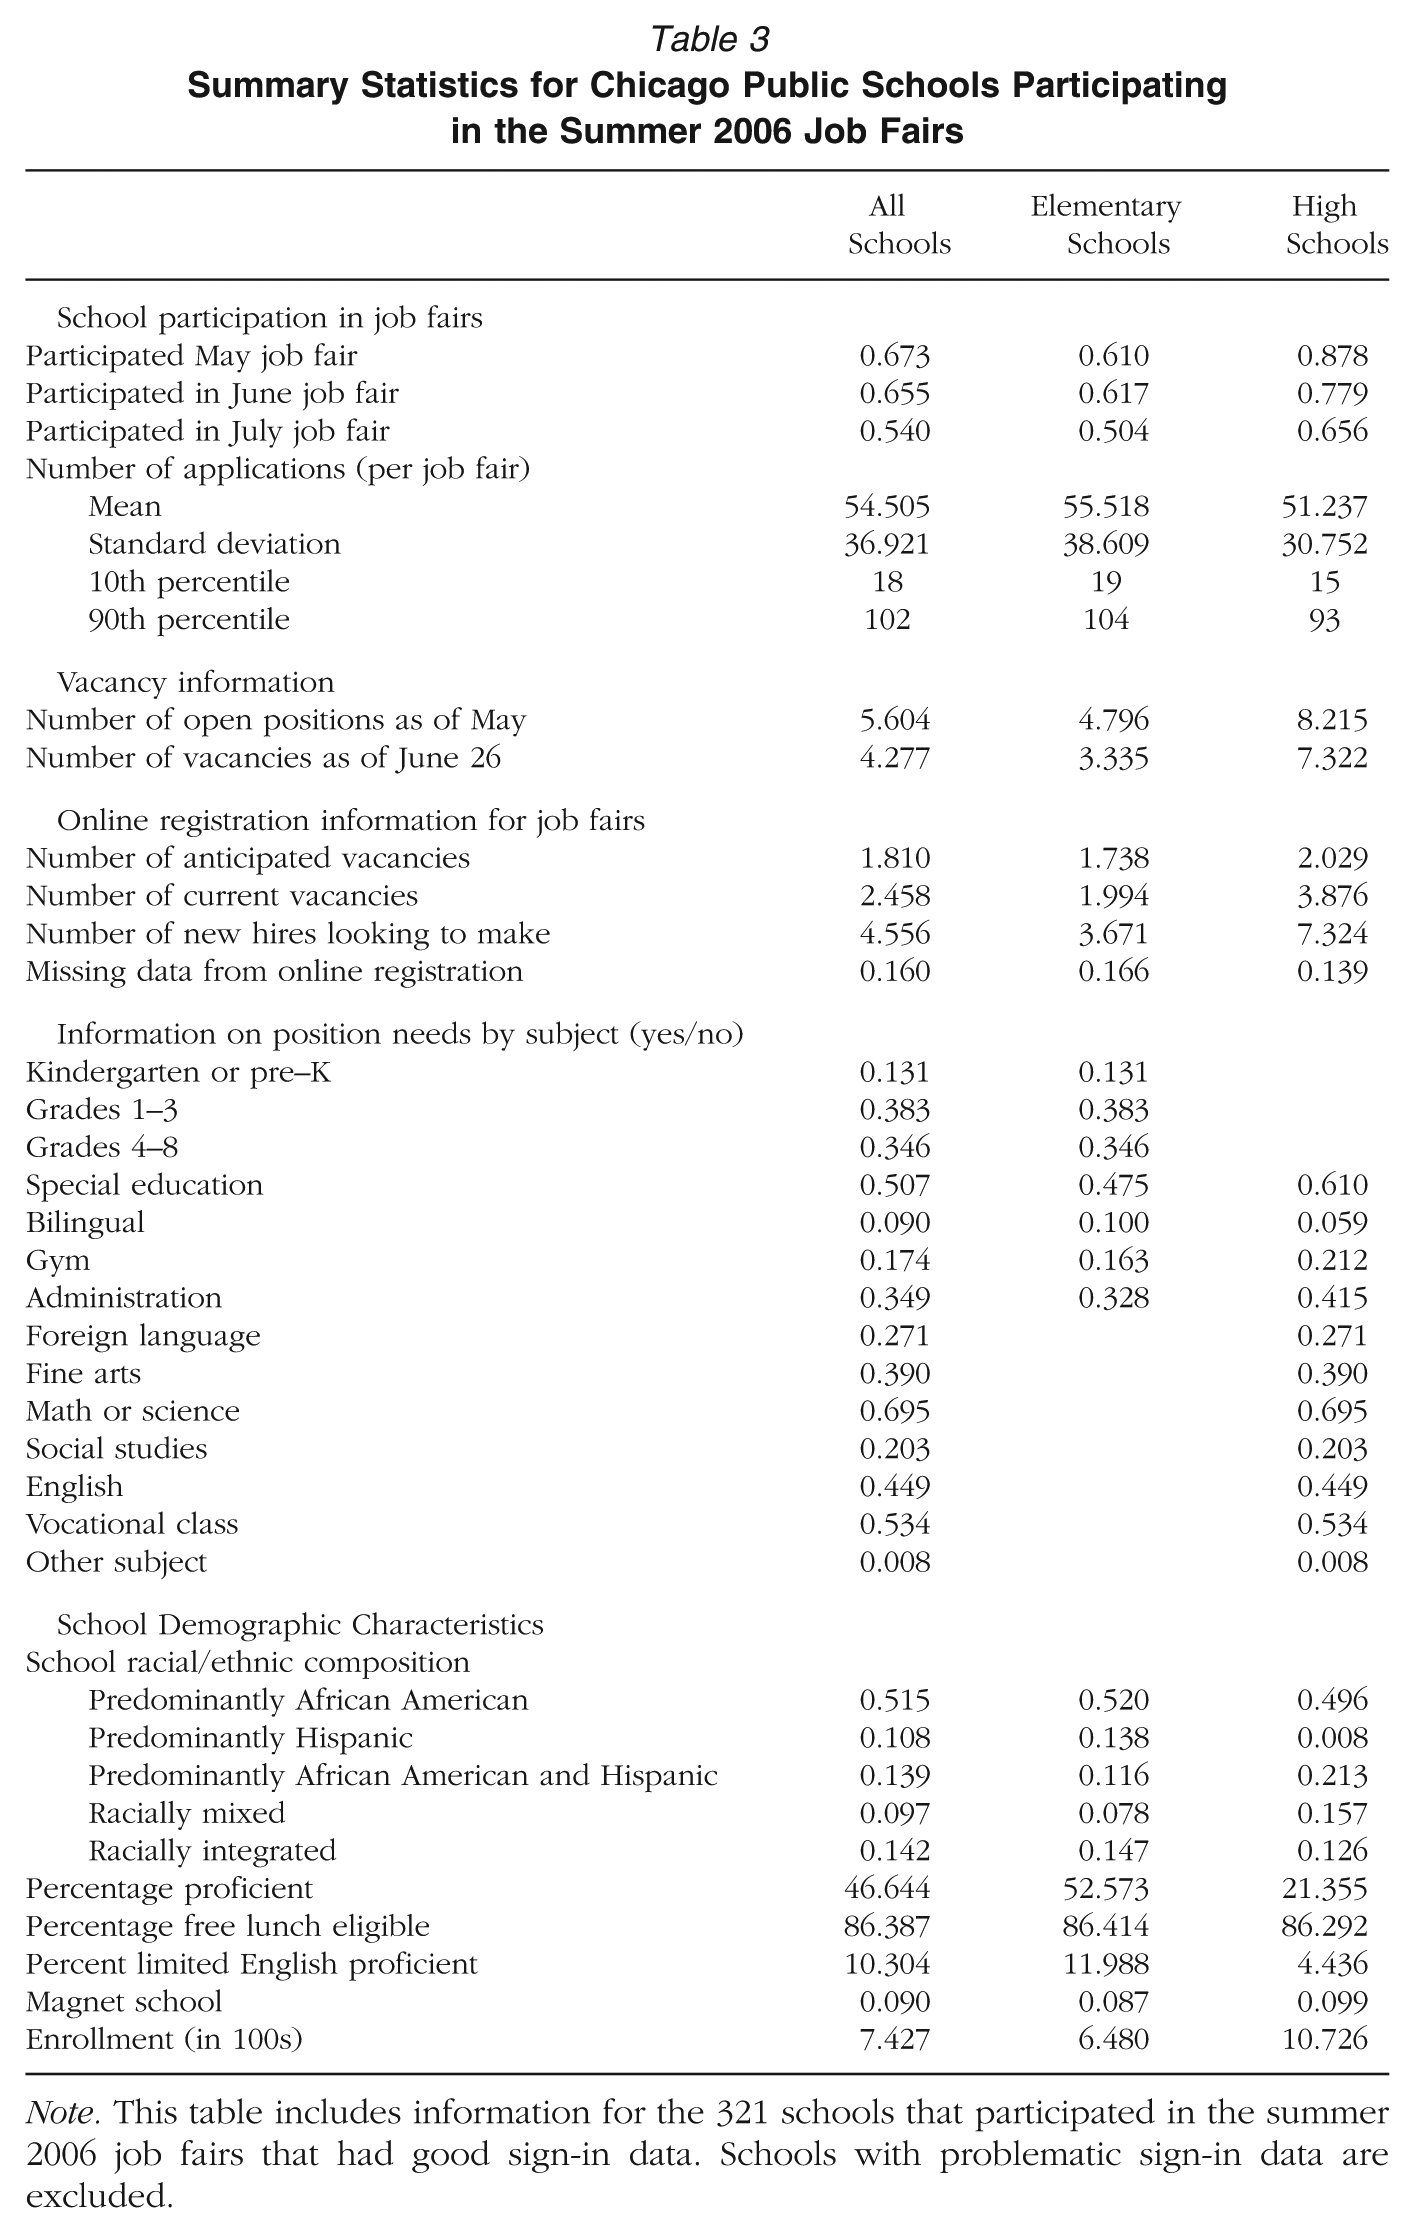
Note. This table includes information for the 321 schools that participated in the summer 2006 job fairs that had good sign-in data. Schools with problematic sign-in data are excluded.
We match the job fair application data to school-level data we obtained from the CPS. These data include not only school demographics that might be relevant to job applicants (e.g., racial composition, poverty, and achievement levels in the school) but also information on the number of open positions in the school as of May 2006 (prior to the first large job fair).
Finally, we have information about the specific needs of each school taken from online registration forms that schools completed prior to each fair. This information includes the number of current vacancies, the number of anticipated vacancies, and the number of new hires the school was looking to make at the fair. In addition, the school indicated whether it was looking to make one or more hires in a number of different fields (e.g., elementary education, special education, bilingual education, math, and science).
Table 3 shows summary statistics for our sample overall and separately for elementary and secondary schools. High schools were more likely to participate in job fairs than elementary schools, likely reflecting the fact that they were typically looking to make over seven hires (7.3) compared with an average of less than four (3.7) for elementary schools. Despite the fact that they had more vacancies, high schools typically had fewer job fair applicants than elementary schools, with an average of 51 applicants per school compared with 56 for elementary schools. Schools attending job fairs were frequently looking to fill positions in areas that are often considered harder to staff such as special education and mathematics or science. Over half of schools reported needing to find candidates to teach special education classes. Fully 70% of schools reported vacancies in math or science compared with 65% of schools looking to hire in English or social studies.
Finally, we used geocoding to map the addresses of prospective teachers and schools that attended at least one job fair. First, we matched job fair applicants to the CPS applicant files that contained home addresses. We were able to match 3,596 job fair applicants to centrally stored applicant files containing a home address. Then, home and school addresses were geocoded using the Google Maps API accessed through Stata. The geocodes allowed us to calculate the distance between job fair applicants’ home addresses and the schools to which they applied. This was calculated using the formula for distance between two points on the Earth or “Great-circle distance” and, consequently, represents distance “as the crow flies.” While this approach does not provide an exact estimate of the routes that teachers must travel, the measurement error should be random and therefore will not bias estimates. Finally, for the purposes of the results reported in Table 7 the sample was limited to teachers residing in Chicago at the time of application and to schools with complete data, resulting in a final analysis sample of 2,169 teachers.
Analysis Plan
Our primary objective is to examine whether prospective teachers’ preferences are correlated with observable school characteristics. In particular, prior literature on teacher mobility suggests that teachers are more likely to leave disadvantaged schools as measured by student demographic composition including race/ethnicity, socioeconomic status, and academic achievement. To explore whether these preferences are reflected in where prospective teachers choose to apply during the job search, we regress the number of applications in school s at fair f on a variety of school and school neighborhood demographic characteristics controlling for indicators for the number and type of vacancies in the school. The ordinary least squares (OLS) model takes the form shown in Equation 1:

where Y is the number of applicants to school s at fair f, SC are the school demographic characteristics of school s, NC are the neighborhood characteristics of school s, SVC are the school vacancy controls of school s, and e is a stochastic error term. Note that none of the school characteristics vary across job fairs. In all cases, we present robust standard errors clustered by school. We include a variable to indicate whether schools preregistered online for job fairs—24% of schools did not and thus do not have information that was reported by principals when they registered online including information on current vacancies. We use listwise deletion to exclude schools that are missing basic demographic (typically less than 1% to 2% of schools) and achievement (6% of schools) information (Allison, 2002). 3 We repeat our analyses including various sets of independent variables in the model before showing results for the fully saturated model.
In addition to examining variation in the number of applicants per school, we explored the relationship between where candidates lived and what schools they chose to apply to as well as the extent to which prospective teachers’ preferences vary by characteristics such as race/ethnicity and prior academic preparation. To do so, we matched applicants from school-level job fair sign-in sheet data to their centrally stored CPS applications using first and last names and the last four digits of applicant social security numbers. Figure 2 shows a histogram describing the fraction of job fair applicants per school who were matched to CPS application files. In the average school, we matched 80% of individuals who signed in at the school during a job fair to their application files. Matching rates ranged from 50% to 100%, and we were able to match over two-thirds (68%) of teachers for 90% of schools. Since we are only able to conduct the subgroup analysis that follows on those job fair applicants who matched to the central CPS application data, a concern is whether the match probability is correlated with any factors that might be related to applicant preferences for school type. Fortunately, an analysis of the predictors of matching (shown in the Appendix in the online journal) suggests that observable school characteristics are not systematically associated with match probability, providing reassurance that our estimates on the sample of matched job fair applicants will provide reasonable estimates for the full population.
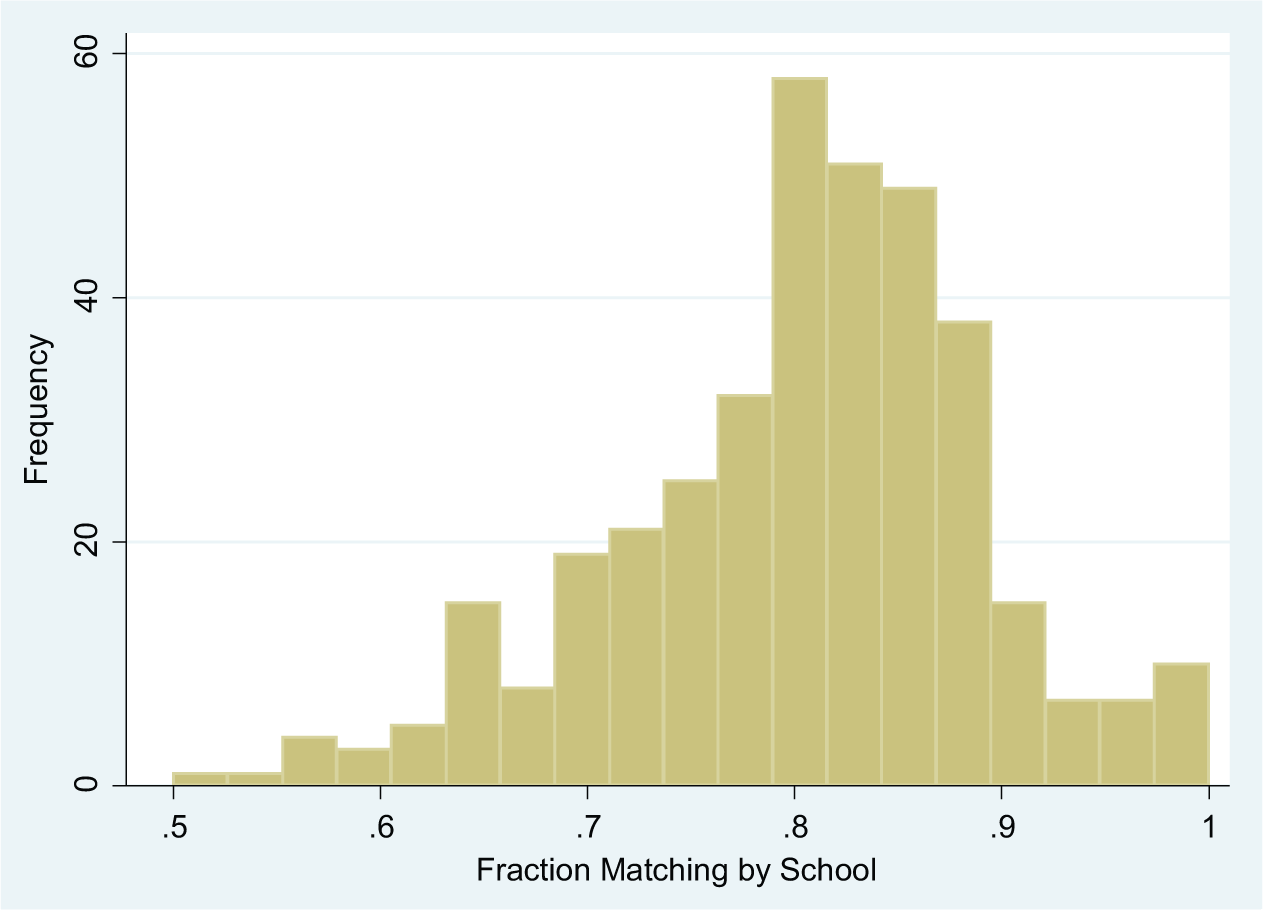
Histogram of fraction of applicants matching by school.
To explore the effect of distance, we estimate a series of logistic regressions. The outcome in these analyses is whether or not a teacher applied to a particular school. The model takes the form shown in Equation 2:

where μ = E(Yi | Xs ) = exp(β0 + β1 SCs + β2 NCs + β3 SVCs ), Y indicates whether or not teacher i applied to school s, SC are the school demographic characteristics of school s, NC are the neighborhood characteristics of school s, SVC are the school vacancy controls for school s, and Distance is the distance of teacher i’s home address to school s. Standard errors for all teacher-level models are clustered by teacher to adjust for nonindependence among the set of schools to which an individual teacher applies.
Results
Table 4 provides our main results. In all columns, we show results from OLS regressions where the dependent variable is number of job fair applicants per school. The various specifications show changes in the number of applicants as school characteristics are added to the model. Column 1 shows coefficients from different regressions that estimate number of job fair applicants using either single variables or clusters of similar variables. In other words, the results shown in Column 1 reflect many different regression specifications. The horizontal lines indicate the different specifications.
Coefficients and Standard Errors From Various Ordinary Least Squares Regressions Estimating the Relationship Between School and Neighborhood Characteristics and Number of Summer 2006 Job Fair Applicants Applying to Individual Chicago Public Schools

Note. Mean number of job applicants per school per fair was 55, with a standard deviation of 37. Robust standard errors, clustered by school, in parentheses. Column 1 shows coefficients from regressions that estimate number of job fair applicants using either single variables or clusters of similar variables. Coefficients from separate regressions are denoted by horizontal lines. Controls include school enrollment, number of anticipated vacancies, dummies for elementary school, magnet school, indicators for specific number of hires school was trying to make at job fairs, indicators for types of positions school had openings in, and which job fairs school attended. Observations in these analyses are school by job fair, meaning that schools that attended multiple job fairs have separate observations for each fair they participated in. Observations with poor sign-in data (schools that had poor quality sign-in data for a particular job fair or multiple fairs) are excluded for those months.
p < .10. **p < .05. ***p < .01.
In terms of school racial/ethnic composition, we see that schools with a larger proportion of White or Asian students had more job fair applicants. A 10 percentage point increase in White or Asian students is associated, on average, with nearly four more applicants per school, an effect that remains largely unchanged with the inclusion of various school and neighborhood characteristics, as well as number of vacancies per school. The size of this effect is particularly important when we consider that on average, principals attending a CPS job fair reported that they were looking to hire approximately five new teachers (see Table 3) and that the 10% of schools that received the smallest number of applications at job fairs (approximately 34 schools) received 21 or fewer job fair applications in total across all fairs they attended. Free lunch eligibility is correlated with number of job applicants per fair in the expected direction, with a 10 percentage point increase in free lunch–eligible students associated with four fewer applicants per school per job fair. Academic achievement, measured by percentage of tested students who score at the proficient level or higher on standardized achievement tests, is positively associated with number of applicants, as is percentage limited English proficient (LEP).
Interestingly, indicators for region suggest that geography may play an important part in candidates’ school preferences. The omitted region, Region 1, encompasses Chicago’s northernmost and northwest neighborhoods. Regions 2 and 3 encompass the areas closest to and west of the city center. Regions 4 through 6 move progressively southward, with Region 6 including Chicago’s southernmost neighborhoods. The regressions including only CPS region show a preference for schools in neighborhoods on Chicago’s North Side, with far South Side schools in Region 6 having an average of 29 fewer applicants per fair than schools on the far North Side. The schools in Region 6 typically have a much larger fraction of African American students than the schools in Region 1, suggesting that on average, teachers are less likely to apply to schools serving large concentrations of minority students. It is also possible that these strong regional/geographic preferences reflect teacher preferences in terms of neighborhood desirability or proximity to the teacher’s own neighborhood, which we explore in more detail in the analyses that follow.
As would be expected, schools reporting a larger number of anticipated vacancies and those looking to fill more positions typically had more applicants. Column 2 shows coefficients on school-level racial/ethnic composition controlling for number and type of vacancies, school enrollment, and grade level. Including controls does not alter the relationship substantially, with more teachers still applying to schools serving fewer minority students.
Columns 3 through 5 show the relationship between school racial/ethnic composition and number of applicants adding percentage who are free lunch eligible, school-level academic achievement–percentage proficient or higher, and percentage LEP, respectively. When the percentage of free lunch–eligible students is included with racial composition, both free lunch eligibility and percentage of White and Asian students remain statistically significant, although the magnitude of each coefficient is reduced. The pattern is similar when percentage proficient is included in the model, although percentage proficient is not statistically significant in this model. When percentage LEP is added to the model including indicators for race/ethnicity, its magnitude drops to near zero, and it becomes statistically insignificant. Column 6 provides coefficients from a model that includes racial/ethnic composition indicators as well as percentage proficient, percentage free lunch eligible, and percentage LEP. Interestingly, when all of these variables are included, only free lunch eligibility remains statistically significant.
Column 7 adds the region indicators to the model. Free lunch eligibility, again, remains statistically significant. Although not all region indicators are statically significant, the pattern of results indicates that teachers’ preferences for geography remain remarkably unchanged when included in the same model as school-level student demographic characteristics. Column 8 adds school neighborhood information by zip code including percentage poverty, percentage African American, percentage Hispanic, miles to central business district, and prevalence of both property and violent crimes. While the magnitude of the region indicators drops, these variables remain statistically significant and substantively large. This suggests that there may be some unobservable (to the researcher) characteristics associated with certain regions within CPS that are correlated with desirability on the part of teachers. Such factors could include reputation or perceived safety of the school or surrounding area.
Table 5 shows additional specifications of the baseline model (Column 8 of Table 4) in order to assess the robustness of the results discussed previously. Interestingly, we see that percentage of students who are free lunch eligible remains a statistically significant predictor of the number of applicants to a school across a number of different specifications. The region indicators remain important determinants of teacher applications, although in models with only one observation per school (as opposed to observations for each School × Job Fair), precision declines substantially.
Coefficients and Standard Errors From Additional Ordinary Least Squares Regressions Estimating the Relationship Between School Characteristics and Number of Job Fair Applicants Applying to Chicago Public Schools That Participated in the Summer 2006 Job Fairs

Note. Robust standard errors, clustered by school, in parentheses. Controls include school enrollment, number of anticipated vacancies, dummies for elementary school, magnet school, indicators for specific number of hires school was trying to make at job fairs, indicators for types of positions school had openings in, and which job fairs school attended. Columns 5 and 7 show coefficients from regressions that estimate number of job fair applicants using either single variables or clusters of similar variables. Coefficients from separate regressions are denoted by horizontal lines in these columns. Observations in these analyses, unless otherwise noted, are school by job fair, meaning that schools that attended multiple job fairs have separate observations for each fair they participated in. Observations with poor sign-in data (schools that had poor quality sign-in data for a particular job fair or multiple fairs are excluded for those months).
p < .10. **p < .05. ***p < .01.
Columns 5 through 8 in Table 5 show results separately for elementary and high schools. The first column for each level shows bivariate results or results for groups of similar variables, and Columns 6 and 8 show the results for the preferred model for elementary and high schools, respectively. While we lose considerable precision when we split the sample, several interesting findings emerge. First, the region indicators are important determinants of applications for both elementary and high schools. The fully specified models (Columns 6 and 8) indicate that region appears to play an important role for applicants to elementary schools. The number of applicants per school varies substantially by region, with far South Side schools having an average of 16 fewer job fair applicants per school than far North Side schools. Among high schools, coefficients range from 22 to 48 fewer applicants per school in high schools not located on the city’s far North Side. These estimates are substantially larger in magnitude than coefficients in the elementary school model. Further, student academic proficiency (conditional on other variables) appears to be a more important determinant of high school applications.
Table 6 shows results from models that regress the natural log of the number of job fair applicants to a school on school demographics, separately for various applicant subgroups. We use the log specification here to allow easier comparison across the groups since group sizes (and thus the mean number of applications per group) differ substantially. The subgroups of interest include Black, Hispanic, and White/Asian applicants; applicants with undergraduate degrees in mathematics or science; and applicants from the most competitive undergraduate institutions (about 13% of the total sample). We show models that include all of the school-composition and demographic variables of interest as well as controls (similar to the specification shown in Table 5, Column 4). Importantly, Column 2 shows that results for matched applicants are virtually identical to results for the full sample (Column 1), indicating that the 80% of job fair applicants that we were able to match to their centrally stored application files appear to have similar preferences to the full pool of job fair applicants.
Coefficients and Standard Errors from Ordinary Least Squares Regressions Estimating the Relationship Between School and Neighborhood Characteristics and the Natural Log of the Number of Job Fair Applicants Applying to Chicago Public Schools That Participated in the Summer 2006 Job Fairs for Various Applicant Subgroups

Note. Robust standard errors, clustered by school, in parentheses. Controls include school enrollment, number of anticipated vacancies, dummies for elementary school, magnet school, indicators for specific number of hires school was trying to make at job fairs, indicators for types of positions school had openings in, and which job fairs school attended. Observations in these analyses are school by job fair. Schools that attended multiple job fairs have separate observations for each fair they participated in. Observations with poor sign-in data (schools that had poor quality sign-in data for a particular job fair or multiple fairs) are excluded for those months.
p < .10. **p < .05. ***p < .01.
Results indicate that job fair applicant preferences for school characteristics vary substantially by applicant race/ethnicity. African American applicants are less likely to apply to schools with larger proportions of White or Asian students and more likely to apply to schools in Regions 3 through 6 than they are to schools in CPS region 1. For example, the coefficient 1.037 for Region 6 indicates that schools in Region 6 receive nearly twice as many (107% more) applications from African American candidates than schools in Region 1. Schools in Regions 4 and 5 receive 44% and 55% more applications from African Americans than Region 1 schools. Regions 3 through 6 are located on the South Side of Chicago, which has a larger percentage of African American residents than other areas of the city. Notably, the region indicators are still large and significant in these models, which control for zip code racial composition.
Not surprisingly, Hispanic job fair applicants are more likely to be interested in schools serving larger percentages of LEP students. They are also less likely to apply to schools with larger proportions of White or Asian students (all else equal).
In addition, we find that the preferences of applicants with undergraduate degrees in mathematics or science differ notably from those of other job fair applicants. As Column 6 indicates, these candidates were statistically significantly more likely to apply to schools with larger proportions of students meeting basic levels of academic proficiency. Interestingly, controlling for other school demographic and composition indicators, applicants with mathematics or science degrees also show no geographic or regional preferences. The pattern of results for applicants who attended the most selective undergraduate institutions (Column 7) is very similar to results for the full sample (Column 1).
In addition to examining which school characteristics predict the number of applicants per school, we explored whether the distance between job fair applicants’ home addresses and the schools predicted whether they would apply to a given school at the job fairs. We model this relationship with logistic regression using a teacher-level data set containing observations for every possible teacher-school pair. The analysis sample for exploring the effect of distance is limited to job fair applicants for whom we had valid home addresses within the city of Chicago, including a total of 2,169 teachers. This restriction reflects the CPS residency requirement— that CPS teachers live within the Chicago city limits—and also reflects the fact that distance between out-of-state applicants’ home addresses and the schools to which they applied would not result in meaningful estimates.
The results of the logistic regressions are presented in Table 7 and reflect models that replicate a number of the specifications reported in Table 4 (Columns 1, 7, and 8) using teacher as opposed to school-level data. For all estimates, odds ratios are shown to the right of coefficients for ease of interpretation. Column 1 shows results from bivariate regressions estimating the effect of distance and other independent variables on whether or not a prospective teacher applied to a school. Bivariate results indicate that distance to the school is a significant predictor of whether a teacher chooses to apply. A 1 kilometer increase in the distance between a teacher’s home address and the school is associated with an 8% decrease in the likelihood that a prospective teacher will apply to that school. Columns 2 through 4 report results for models including various combinations of school-level demographic characteristics. Results are generally similar to those reported in Table 4. Column 3 shows results for the same model that is shown in Column 2 but with distance included as a covariate. Interestingly, once distance is added, the regional effects for the regions that are closer to Region 1—Regions 2 and 3—are largely unchanged. However, estimates for Regions 5 and 6 drop dramatically and become statistically insignificant. The final model adds controls for school zip code–level independent variables. We can see that these do little to change the estimates shown in Column 3. Interestingly, the relationship between applicant distance from school and the likelihood that a teacher will apply remains virtually unchanged with the addition of covariates. A 1 kilometer increase in the distance between a teacher’s home address and the school is associated with an 8% decrease in the likelihood that a prospective teacher will apply to that school, conditional on school-level demographic information, region, and school neighborhood characteristics.
Coefficients, Standard Errors, and Odds Ratios From Various Specifications of Logistic Regressions Predicting Whether Prospective Teachers Applied to Particular Types of Schools at the 2006 Chicago Public Schools (CPS) Job Fairs

Note. Robust standard errors, clustered by teacher, in parentheses. Column 1 shows coefficients from regressions that estimate number of job fair applicants using either single variables or clusters of similar variables. Coefficients from separate regressions are denoted by horizontal lines in this column. Odds ratios are shown to the right of coefficients. Controls include school enrollment, number of anticipated vacancies, dummies for elementary school, magnet school, indicators for specific number of hires school was trying to make at job fairs, indicators for types of positions school had openings in, and which job fairs school attended.
p < .10. **p < .05. ***p < .01.
In addition to the results displayed in Table 7, we examined the effect of distance and school demographic characteristics separately by the applicant subgroups shown in Table 6 (results not shown). The effect of distance did not vary across subgroups. Interestingly, some regional preferences that were diminished by the inclusion of distance in the main models remained among particular subgroups. Specifically, African American teachers were nearly two times more likely to apply to schools in Region 6, even controlling for distance, and Hispanic and White/Asian teachers remained significantly less likely to apply to schools in the regions located on Chicago’s far South Side.
Discussion and Conclusion
The distribution of teachers across schools results from a two-sided matching process in which both teacher and school administrator preferences play a role. The current study is the first to examine the revealed preferences of prospective teachers in a large urban district. Using data on job fair applications to public schools in Chicago, we isolate applicant preferences and are able to identify the relative importance of various school characteristics to prospective teachers in the early stages of the job search process.
As we anticipated, we find that teachers are substantially less likely to apply to higher poverty schools. Interestingly, we find that there is little aggregate relationship between the number of teacher job fair applications and school racial composition or achievement level once we control for school poverty rate. We find that CPS schools serving fewer disadvantaged students (as measured by the percentage of students eligible for free lunch) have larger numbers of initial applicants per vacancy and that this measure of disadvantage is more consistently predictive of number of applicants than are other school demographic characteristics such as student racial/ethnic composition, academic achievement, and percentage of students with limited English proficiency.
Interestingly, we find the geographic location of the school to be an important predictor of applications. Schools on the city’s north and northwest sides, which are generally more affluent with a smaller fraction of African American and Latino households, receive substantially more applications than those on the far south or far west sides. This relationship is robust to the inclusion of a variety of school demographic characteristics such as student poverty, racial composition, and achievement as well as the number and types of positions available at the school. In fact, geography remains an important predictor when we control for several potentially important neighborhood-level characteristics such as poverty, racial composition, and crime rates.
Results from applicant-level logistic regressions including distance between home address and school as an independent variable allowed us to examine the extent to which physical proximity to the school might account for teachers’ geographic preferences. Research and theory in urban geography suggest the possibility that teachers might have particularly strong preferences with regard to finding a job that is close to their residential location (Hanson & Johnston, 1985; Hanson & Pratt, 1988). As might be expected, as distance from a prospective teacher’s home to a given school increases, the likelihood of the teacher applying to that school decreases. This result is robust across all specifications of our model, indicating that the desire to teach close to where one lives holds, even after controlling for the racial/ethnic and economic composition of the schools and their surrounding neighborhoods. The inclusion of distance in models predicting whether prospective teachers will apply to particular schools reduces the region effects observed in other models, particularly for schools on Chicago’s South Side.
Thus, the geographic region indicators are, in part, picking up applicant preferences in terms of proximity to their own neighborhoods, reduced commute time, or ease of access using public transportation. The inclusion of distance, however, does not totally eliminate the region effects we observe. It is likely that geographic region indicators serve as proxies for a number of hard-to-observe school and/or neighborhood characteristics, such as perceived safety, community attitudes toward education, and school leadership.
We also find that preferences for school characteristics vary by applicant characteristics, with African American candidates more likely to apply to schools on the city’s South Side (a predominately African American area of Chicago) and Hispanic candidates more likely to be interested in schools serving larger proportions of LEP students. It is possible that African American teacher applicants are more likely to be living in South Side neighborhoods, or have friends and family in these neighborhoods, which could make the areas more familiar and thus more appealing. Finally, we find that applicants with undergraduate degrees in mathematics or science (5% of the applicant sample) are more likely to apply to schools serving more academically proficient students. All of these findings reinforce the notion that homophily may play an important role in the job search process among prospective teachers.
Studies of prospective (Cannata, 2010) and newly hired (Liu & Johnson, 2006) teachers’ reported preferences for school characteristics find that teachers report making decisions about where to apply and where to teach using limited information (i.e., district- and school-level student demographic characteristics) and that new and prospective teachers often have little information about the school characteristics that they report are most important such as school leadership and the quality of available mentoring and support (Cannata, 2010).
Our study builds and expands on previous research on teacher preferences in several important ways. As Cannata’s (2010) study of applicants’ reported preferences suggests, prospective teachers’ revealed preferences indicate that they select the schools they will apply to based on student demographic characteristics. Further we find that school location and proximity to candidates’ homes is indeed very important; candidates are more likely to apply to schools that are close to where they live. In fact candidates are 40% less likely to apply to a school that is 5 kilometers—just over 3 miles—further from their homes. Cannata found that proximity to home was among the most important school characteristics reported by prospective teachers both on surveys and in interviews. Thus, our study provides empirical evidence indicating that prospective teachers in Chicago have strong preferences in the job search regarding residential proximity, findings that are supported by prior research in urban geography (Hanson & Johnston, 1985; Hanson & Pratt, 1988).
Studies examining the distribution of teachers across schools consistently find that teachers are sorted systematically across schools (e.g., Lankford et al., 2002). Further, research on teacher mobility finds that when teachers transfer schools, they are more likely to transfer to schools that serve larger proportions of students that match their own race/ethnicity. For example, Hanushek and colleagues (2004) find that African American teachers are more likely to transfer to schools serving larger proportions of African American students and that a similar pattern is observed among White teachers. Relatedly, qualitative research finds that prospective teachers report that fit and familiarity are very important determinants of where they apply during the job search (Cannata, 2010). Thus, homophily appears to play an important role in the job search process among prospective teachers.
The current study provides new evidence indicating that this sorting is evident in teachers’ revealed preferences early in the job search process. Indeed, prospective teachers who attended CPS job fairs were more likely to apply to schools close to their homes and schools that served more students who matched their own race or ethnicity. Importantly, this systematic sorting results in there being far fewer applicants to some schools than others. Cannata (2010) notes that teachers’ reported preferences indicate that they prefer to teach in schools and neighborhoods that are both geographically close and socially familiar. This finding may help to explain our results indicating that teachers prefer to teach not only close to where they live but also in particular CPS regions. While teachers’ preferences for distance were consistent across subgroups, teachers’ regional preferences were not. Controlling for school and neighborhood characteristics as well as distance, African American, White or Asian, and Hispanic teachers all expressed distinct preferences in terms of the CPS regions to which they were most likely to apply.
All else equal, teachers with a bachelor’s degree in mathematics or science seemed to value student achievement more than other prospective teachers, and for this small group of teachers region appeared to be a less important determinant of where they chose to apply. This may have been due to the fact that many of these teachers were exclusively interested in high schools and perhaps were more focused on the particular content (e.g., algebra vs. calculus or biology vs. chemistry) that they would be expected to teach than other teachers. If so, we might expect these teachers to focus more on school-level academic achievement than on school location and other student demographic characteristics. And, in fact, they do.
Cannata (2010) notes that applicant preferences for familiarity and proximity will likely lead to some districts suffering from chronic staffing difficulties. The current study provides evidence that in large urban districts such as Chicago, the extent to which school leaders encounter staffing difficulties is likely to be highly variable within a single district. The number of applicants per school varies dramatically by school characteristics and across CPS regions. This insight into within-district variation in applicants across schools is important. However, it is also important to consider the generalizability of our estimates. While results from this study may generalize to other large urban districts serving student populations with similar demographic characteristics, it is unclear whether our findings would be replicated in other types of school districts (i.e., smaller districts, suburban or rural districts). Future research should examine the relationship between applicant and school characteristics in other contexts.
It is interesting to consider these findings in light of recent CPS recruitment efforts. Over the past decade, the CPS office of human resources has substantially increased its efforts to recruit more widely, soliciting applicants from out of state and holding broadly publicized large-scale job fairs to bring in more candidates. While the 2006 applicant pool contained over 11 potential candidates for each eventual hire, our analyses suggest that the vast majority of those prospective teachers—including many of the most highly qualified applicants—will not apply to the schools serving the most disadvantaged students. With job fair applications ranging across schools from the single digits to nearly 500, it is clear that despite an abundance of applicants to the district as a whole, many schools—whether because they are situated in less geographically desirable locations, because they serve the most disadvantaged student populations, or a combination of these factors—are likely to experience a shortage of applicants. This suggests that targeted efforts to direct a larger number of qualified applicants to hard-to-staff schools could have important benefits.
The complexity of this educational policy problem—staffing schools located in Chicago’s most isolated urban neighborhoods—should not be understated. Research in urban geography has found that the geographic concentration of extremely disadvantaged African Americans is caused by residential segregation in urban areas (Massey et al., 1994). Further, recent research finds that Chicago remains the most racially segregated city in the United States (Glaeser & Vigdor, 2012). With citywide average ACT score among CPS students barely over 17 (the national average is 21) in 2012, the city’s educational infrastructure, which serves large numbers of youth raised in extreme poverty, is failing to produce many students who will be qualified to teach. These problems are exacerbated in the isolated neighborhoods on Chicago’s South and West sides, where school-level average ACT scores can be 14 or lower.
We offer two suggestions for means that the district can use to try to improve the supply of qualified teachers to the schools serving its most disadvantaged and geographically isolated students. First, the district should consider adopting a teacher residency program. Teacher residency programs are a fairly new method of training and acclimating new teachers to the demands of teaching in high-needs schools and districts. Modeled after medical residency programs, they combine coursework with mentoring and extensive field practice to better facilitate and support entry to the profession and teachers in disadvantaged urban contexts. Recent evidence indicates that teacher residency participants in Boston were more racially diverse and more likely to remain in the district than their peers who did not participate in the residency program (Papay, West, Fullerton, & Kane, 2011).
Second, the district should seriously consider eliminating its residency requirement—currently all CPS employees are required to live within the Chicago city limits. Teachers in the nation’s two largest school districts—the New York City Department of Education (NYC DoE) and the Los Angeles Unified School District are not subject to a residency requirement. In fact, on its website, the NYC DoE notes that many teachers choose to live in “nearby communities” outside of the five boroughs. In an extension of our analysis of the relationship between residential proximity and job fair applications, we find that nearly 800 job fair applicants (20% of the total number of job fair applicants included in our analyses) live outside of Chicago but within 50 miles of the city’s central business district. One-third of these applicants live less than 5 miles from a CPS school. In fact, the average distance to a CPS school among African American and Hispanic job fair applicants who were not Chicago residents was just over 7 miles. It seems likely that teachers who live in suburbs that are in close proximity to the city would be much more likely to consider teaching in the CPS if the residency requirement were lifted.
Our results indicate that teachers are much more likely to apply to schools that are closer to their homes and are also more likely to apply to schools serving larger proportions of students with whom they share race/ethnicity. Thus, district policies aimed at addressing the shortage of applicants in the most disadvantaged schools should experiment with means for increasing the pool of applicants for these schools by implementing and expanding programs aimed at recruiting, training, and retaining those teachers who might not typically apply to teach in more disadvantaged schools. Results presented here indicate that recruitment at the district level alone is unlikely to provide sufficient applicants to the most disadvantaged and geographically isolated schools.
Footnotes
Notes
M
B
F. C
References
Supplementary Material
Please find the following supplemental material available below.
For Open Access articles published under a Creative Commons License, all supplemental material carries the same license as the article it is associated with.
For non-Open Access articles published, all supplemental material carries a non-exclusive license, and permission requests for re-use of supplemental material or any part of supplemental material shall be sent directly to the copyright owner as specified in the copyright notice associated with the article.