



Abstract
This randomized controlled field trial examined the efficacy of the Responsive Classroom (RC) approach on student achievement. Schools (n = 24) were randomized into intervention and control conditions; 2,904 children were studied from end of second to fifth grade. Students at schools assigned to the RC condition did not outperform students at schools assigned to the control condition in math or reading achievement. Use of RC practices mediated the relation between treatment assignment and improved math and reading achievement. Effect sizes (ES) were calculated as standardized coefficients. ES relations between use of RC practices and achievement were .26 for math and .30 for reading. The RC practices and math achievement relation was greater for students with low initial math achievement (ES = .89). Results emphasize fidelity of implementation.
Social and emotional learning (SEL) interventions are designed to teach students social and emotional skills considered foundational to academic learning in school and beyond (Durlak, Weissberg, Dymnicki, Taylor, & Schellinger, 2011). Universal school-based SEL programs that teachers deliver to students in classrooms have been viewed as levers for creating school improvement. SEL skills have been included into state learning standards (Dusenbury, Zadrazil, Mart, & Weissberg, 2011). There have been recent efforts to include the Academic, Social and Emotional Learning Act (HR 1875, 2013) in revisions of the Elementary and Secondary Education Act.
Although research on SEL interventions has accumulated in past decades (e.g., Durlak et al., 2011; Social and Character Development Research Consortium [SACD], 2010), many SEL interventions have not been subject to rigorous efficacy trials examining their impact on student achievement. As a result, policymakers and school decision makers are left with too little information upon which to make decisions. Decision makers question: Will we diminish children’s academic achievement if we place increased emphasis on (and allocate more time toward) children’s social and emotional learning? This question is worth asking. Classrooms that provide nurturance but do not emphasize academic growth fail to produce student achievement gains (Lee & Smith, 1999; Shouse, 1996). Further, work in developmental psychology calls into question the assumption that improvements in social skills cross over and benefit students’ academic skills (Duncan et al., 2007).
The Responsive Classroom® (RC) approach is a widely used professional development intervention comprised of a set of practical teaching strategies designed to support children’s social, academic, and self-regulatory skills. The RC approach is designed to enhance teachers’ capacity to create a caring, well-managed classroom environment characterized by respectful social interactions and academically engaging instruction (Northeast Foundation for Children, 2007, 2009, 2014a). The RC approach was recently endorsed as one of 21 recommended programs by the Collaborative for Academic, Social and Emotional Learning (CASEL, 2013) for its high-quality design, support for implementation, and evidential basis. As a result, school decision makers are particularly interested in the extent to which the RC approach relates to academic outcomes.
The present study, Responsive Classroom Efficacy Study (RCES), builds upon existing research (Elliott, 1999; Rimm-Kaufman, Fan, Chiu, & You, 2007) and represents the first randomized controlled trial of the approach. We randomized elementary schools to intervention versus control conditions and followed a cohort of students and their teachers from the end of second grade through fifth grade. Three research questions pertaining to student achievement were addressed:
Research Question 1: What is the impact of the RC approach on students’ reading and math achievement over 3 years?
Research Question 2: To what extent does fidelity of implementation mediate the relation between treatment assignment (intervention vs. control) and reading and math achievement over 3 years?
Research Question 3: To what extent is the mediational relation affected by whether or not students are qualified for free and reduced priced lunch (FRPL) and by students’ initial achievement?
Recent synthesis work on SEL interventions describes the need for randomized controlled trials that examine the impact of SEL interventions on achievement outcomes, attend to issues of fidelity of implementation, and consider the moderators of intervention effectiveness (Durlak et al., 2011; Greenberg, 2010). The present study contributes to a critical area of need.
School-Based Social and Emotional Learning
Randomized controlled trials examining links from SEL interventions to achievement outcomes reveal mixed results. A cluster-randomized controlled trial on Positive Action, an intervention with explicit lessons on self-concept, self-management, peer social behaviors, and self-improvement, produced gains in elementary school math and reading (Hedge’s g effect size [ES] = .50–.72) after 3 years of implementation (Snyder et al., 2009). Findings from the 4Rs (“Reading, Writing, Respect and Resolution”), a program that integrates SEL skills into language arts instruction, demonstrated the presence of gains in reading and math achievement (measured by test scores and teacher report) over 2 years of implementation. Findings were evident only for children whose teachers identified them as showing signs of initial behavioral risk (above a clinical cut-off in conduct problems and aggression) (Jones, Brown, & Aber, 2011). Findings from the Child Development Project, a program designed to promote children’s prosocial skills and give children opportunities to experience relatedness, competency, and autonomy, related to enhanced sense of community and improved achievement and behavioral outcomes (Battistich, Schaps, & Wilson, 2004), particularly when schools implemented the intervention as intended (Battistich, Solomon, Kim, Watson, & Schaps, 1995). Research on the Good Behavior Game, a group game designed to decrease disruptive behaviors, combined with an enriched academic curriculum implemented in first grade showed long-term gains in achievement to the end of high school (Bradshaw, Zmuda, Kellam, & Ialongo, 2009). The state of research suggests positive outcomes are more likely in conditions of high implementation and when outcomes align with the theory of change (SACD, 2010). SEL interventions show stronger relations to social than achievement outcomes (Durlak et al., 2011).
Quasi-experimental research links SEL interventions to student achievement. For instance, findings from a nonrandomized field trial of a multicomponent intervention administered to fifth and sixth graders designed to foster bonding toward school was associated with math and reading achievement gains (Abbott et al., 1998). A quasi-experimental study of the RULER Feelings Words Curriculum, an intervention designed to teach children how to interpret and communicate emotions, demonstrated that fifth and sixth graders in classrooms using the intervention outperformed students in the control group on language arts grades, albeit a small effect (Brackett, Rivers, Reyes, & Salovey, 2010). A meta-analysis reviewing 213 SEL interventions (including a range of designs) showed a positive contribution of SEL programming on student behavioral and emotional skills as well as academic performance. Effect sizes (Hedge’s g) were .57 for gains in social and emotional skills and .27 for gains in achievement (Durlak et al., 2011).
The Responsive Classroom Approach
The RC approach was developed by the Northeast Foundation for Children (NEFC); more than 120,000 teachers have been trained in the approach. According to NEFC (2014a), the RC approach is an “approach to elementary education that gives teachers the tools they need to be highly effective instructors” (p. 2). Like many professional development interventions, the RC approach continues to develop to match contemporary needs. In this paper, we describe the RC approach based on the version available in 2008-2011. The RC approach offers principles including: “The social curriculum is as important as the academic curriculum; How children learn is as important as what they learn: Process and content go hand in hand; Knowing the children we teach—individually, culturally, and developmentally—is as important as knowing the content we teach” (NEFC, 2014b, “Guiding Principles”). Ten practices emanate from the principles. Teachers and children gather together daily for a Morning Meeting to create a sense of community among teachers and students and instill curiosity about the learning ahead. Teachers use Academic Choice to structure lessons to provide students autonomy and choice. The practices are described briefly in the appendix in the online journal and extensively in manuals and books (NEFC, 2007, 2009). Training in the RC approach involves two 1-week workshops, each lasting 35 hours, typically taken in consecutive summers. In-school coaching follows each workshop.
The RC approach differs from prevalent approaches to SEL. For example, the RC approach emphasizes how to teach rather than what to teach. Instead of establishing a set curriculum for teaching SEL skills (i.e., those in RULER or Promoting Alternative Thinking Strategies [PATHS]), the RC approach embeds modeling of prosocial behavior, collaboration, and self-control into instructional practices. RC practices are designed to align with existing curricula in the school rather than introducing content with an SEL focus (e.g., in 4Rs).
Figure 1 presents a logic model that describes a theory of change for the RC approach (Knowlton & Phillips, 2008). In theory, training and coaching in the RC approach leads to teacher change (use of RC practices), which leads to enhanced emotional support, proactive classroom management, and in turn, student motivation and engagement followed by improved student achievement. Two hallmark characteristics stand out. First, RC practices are designed to create emotionally supportive classroom relationships. RC practices are intended to improve teacher-student and peer relationships within classrooms so children develop prosocial skills, cooperate with one another, and perceive that their teachers and peers care about them. Second, RC practices offer a proactive approach to classroom management. Using RC classroom practices early in the year and early in each day is key to their use. Teachers set expectations for behavior and learning with the goal that children will internalize expectations over time, develop self-regulatory skills, and behave more autonomously.

Logic model describing the theory of change for the Responsive Classroom approach.
Small-scale studies suggest the positive contribution of the RC approach. Research examining schoolwide implementation of the RC approach using a pre-post design showed gains in social skills (d = .34–.41) (Elliott, 1999). A quasi-experimental study compared students at intervention versus control schools. Teachers’ use of RC practices related positively to teachers’ perception of children’s reading achievement, teachers’ perception of closeness toward their students, children’s assertiveness, and children’s prosocial behavior (Rimm-Kaufman & Chiu 2007). Analyses compared student test scores of children at RC versus control schools for three cohorts of elementary school students exposed to the RC approach for 1, 2, and 3 years. Findings showed that the RC approach contributed to the gains in both reading and math after controlling for poverty and previous years’ test scores (d = .16–.21 for reading; d = .16–.39 for math; Rimm-Kaufman et al., 2007). The magnitude of the findings is comparable to those found for SEL interventions in meta-analytic work (Durlak et al., 2011). The state of existing work indicates the need for a randomized controlled trial to assess efficacy. Thus, the first research question addressed in the present study asks: What is the impact of 3 years of the RC approach on student achievement? We hypothesize higher achievement among children in intervention than control schools, demonstrating the positive impact of the RC approach.
Fidelity of Implementation
The RC approach is a fully developed, manualized intervention with a well-documented training process (NEFC, 2007, 2009). Despite efforts to create consistency among teachers using the RC approach, existing work on fidelity of implementation on the RC approach (Abry, Rimm-Kaufman, Larsen, & Brewer, 2013) as well as other SEL interventions (Reyes, Brackett, Rivers, Elbertson, & Salovey, 2012) suggests that uptake of the intervention varies across schools and teachers. The process of adopting SEL interventions involves a complex process as teachers change their practices and beliefs to align with the intervention (Evans, 2001; Rimm-Kaufman, Storm, Sawyer, Pianta, & La Paro, 2006). Teachers may receive training but not use the RC practices, adopt some RC practices but not others, or adopt superficial elements of RC practices but disregard underlying principles. Because the RC logic model rests upon the assumption that teachers implement RC practices with fidelity, fidelity of implementation needs to be measured carefully. Century (2010) defines fidelity of implementation as “the extent to which the critical components of an intended program are present when that program is enacted” (p. 202). We operationalize fidelity of implementation to the RC approach as frequency and adherence to the 10 critical RC practices (e.g., Morning Meeting, Academic Choice, Interactive Modeling, etc. as described in the appendix in the online journal).
Two challenges stand out in relation to measuring fidelity in the RC approach. First, the RC approach is designed to modify how teachers interact with students in their classrooms instead of what students are learning. Many SEL interventions are comprised of a sequenced curriculum (CASEL, 2013), and measuring fidelity involves assessing the presence/absence of curricular activities and time spent delivering content (Bickman et al., 2009). In contrast, measuring fidelity of the RC approach requires assessment of the frequency of use of RC practices (e.g., Do teachers use Morning Meeting once a day, once a week, or once a month?) as well as the extent to which implementation adheres to RC principles and practices (e.g., Do teachers provide students choices about what kind of work to do and/or how to do the work?)
The RC approach presents yet another challenge in measuring fidelity (Cordray & Pion, 2006). RC practices were derived from well-known educational and developmental theories (e.g., Piaget, Vygotsky, Dewey), and therefore, some RC practices resemble teaching practices used in classrooms by teachers who have not been trained in the RC approach. Further, the intervention is described and characterized in a series of books published and distributed widely by NEFC, resulting in widespread adoption of intervention components (e.g., Denton, 2005; Denton & Kriete, 2000; Kriete, 2002). RC practices share common qualities with what is considered typical elementary school practices. Many teachers use a class meeting to start the school day, and features of those class meetings (e.g., student sharing, fun group activities) resemble the RC Morning Meeting. Many teachers incorporate differentiated instruction into their classrooms, a practice that shares common elements with Academic Choice. To address this issue, we assessed use of RC practices in both intervention and control schools using measures free from RC terminology. The measures of RC practices reflect fidelity of implementation in intervention schools and use of practices that resemble RC practices in the control condition. (We use the terms fidelity and use of RC practices interchangeably.)
Thus, the second research question addressed examines fidelity of implementation. To what degree does teachers’ fidelity of implementation (in third, fourth, and fifth grade) mediate the relation between assignment to the RC condition and fifth-grade achievement? We hypothesized that teachers’ fidelity of implementation will mediate the relation between the RC approach and reading and mathematics achievement.
Student Subgroups
SEL interventions may not relate equivalently to outcomes for all students. Some students come to school with more advanced academic skills than others (Li-Grining, Votruba-Drzal, Maldonado-Carreño, & Haas, 2010). To understand the extent to which findings about teachers’ use of RC practices can be generalized, research needs to examine for whom the intervention is effective (Bloom & Michalopoulos, 2010). The present study examines potential moderated mediation effects, 1 testing the extent to which use of RC practices mediates the relation between RC training and achievement more for some children compared to others. Poverty (eligibility for FRPL) and low initial achievement (performance below 25th percentile in math achievement at the end of second grade) were potential moderators.
Students living in poverty tend to show lower achievement than their non-poor counterparts, an association that has been attributed to less predictable living situations and reduced access to social, material, and learning resources at home (Gershoff, Aber, Raver, & Lennon, 2007; Yoshikawa, Aber, & Beardslee, 2012). Links between poverty and lower student achievement raise questions about the degree to which supportive classroom experiences can partially ameliorate risk associated with poverty. Emotionally and instructionally supportive school experiences appear to be particularly important for children from poor families (Crosnoe et al., 2010; Hughes & Kwok, 2007).
Low-achieving children are the focus of national efforts to decrease the achievement gap, and there is a critical need for improved understanding of the instructional practices that support learning for children low in math achievement (National Mathematics Advisory Panel, 2008). Although low achievement in early elementary school tends to persist into the middle and upper elementary school grades (Claessens, Duncan, & Engel, 2009), students’ course of achievement is not firmly established and classroom experiences can shift students toward more positive growth trajectories. Exposure to high-quality classroom environments characterized by social and emotional supportiveness (Pianta, Belsky, Vandergrift, Houts, & Morrison, 2008), nonconflictual relationships with teachers, and instruction requiring analysis and inference partially offsets the effects of initial low achievement (Crosnoe et al., 2010).
Efforts to improve schooling for poor and low-achieving children demand research that examines whether teaching practices such as RC practices are more efficacious for some children than others. The third research question asks: To what extent is the mediated relation (i.e., RC condition to fifth-grade achievement via fidelity of implementation) moderated by child characteristics? We hypothesize that the mediated path will be stronger for children who qualify for FRPL and children with low initial achievement.
Other Contributing Factors
Existing research directs attention to other attributes of students, teachers, and schools that need to be considered as potential covariates in predicting achievement. Student gender is often linked to math and reading achievement (Robinson & Lubienski, 2011). Student poverty (Votruba-Drzal, 2006) and English language learner (ELL) status (Kieffer, 2008) needed to be considered given their relation to achievement. We also included test form administered (plain English versus standard) as a potential covariate. Student initial achievement was an important covariate to include because of the relative stability in achievement from third to fifth grade (Claessens et al., 2009); math achievement at the end of second grade served as a proxy for initial student achievement.
There are teacher- and school-level features that contribute to student achievement (Bradshaw, Mitchell, & Leaf, 2010) and warrant consideration as covariates. Teaching draws upon teachers’ experiences and educational background; teachers’ years of experience and educational attainment were selected to represent the presence of these resources (Crosnoe & Cooper, 2010). Further, school-level poverty and student achievement (aggregated to the school level) were included because of theory and empirical work linking these variables to student performance (Conduct Problems Prevention Research Group, 2010; Raver, 2012).
Method
Participants
This study included 24 elementary schools in a large ethnically and socioeconomically diverse school district located in a mid-Atlantic state. District policy required all elementary schools to select an approach to foster SEL or behavioral learning, a policy implemented over a 3-year period. When the district was invited to participate, 24 elementary schools had not made selections and/or initiated formal training and were willing to participate in a randomized controlled trial of the RC approach. Centralized district administrators collaborated with the research team to invite school principals to participate in the study; 100% of the schools invited agreed to participate.
Schools were assigned randomly to intervention or waitlist control condition. The methodologist generated random numbers for each of the 24 schools using the random number function in Excel. The random number values assigned to the schools were sorted; the top 12 schools were assigned to the treatment condition and the bottom 12 schools were assigned to the control condition. Tests were conducted to ensure treatment and control schools were comparable (on gender, FRPL, ethnic composition, ELL status). After random assignment, it became apparent from an informational survey that 2 schools in the control condition had received low-level exposure to the RC intervention. In each school, the principal reported that one of the third-, fourth-, or fifth-grade teachers (<15% of sampled teachers at each school) had received a 1-week RC training. For example, at one school, the principal and some teachers acquired two NEFC-published books and used them to self-teach RC practices. Because of the low-level contamination, one of the two schools was selected at random and placed into the intervention condition, resulting in 13 intervention and 11 control schools. Control schools were exempt from the district policy requiring selection of an SEL or behavioral learning approach for the study duration. Student initial math achievement (Stanford 10) was gathered after randomization. There were no statistically significant differences between treatment and control schools on gender, FRPL, ethnic composition, ELL status, and student initial math achievement based on independent t tests and logistic regressions at baseline. See Table 1.
Descriptive Statistics for Variables by Treatment and Control Condition (n = 24)

Note. ELL = English language learners.
Teacher participants (n = 276) were third-, fourth-, and fifth-grade teachers during the years of 2008–2009, 2009–2010, and 2010–2011, respectively. Teachers (95 third, 92 fourth, and 89 fifth) were primarily female (n = 248; 90%) and had, on average, 10 years of experience (range, 1–38). Teachers were mostly Caucasian (n = 232; 84%) with other ethnic groups represented (11 [4%] African American, 6 [2%] Asian, 10 [4%] Hispanic, and 17 [6%] Other).
All second graders attending the 24 study schools in spring 2008 were enrolled in the study. Students entering third grade in 2008–2009, fourth grade in 2009–2010, and fifth grade in 2010–2011 at the 24 schools were included as participants. Two rationales guided student participant decisions: (1) Randomization occurred at the school level, and thus, our model included typical patterns of school transience (including exit and entrance) to improve ecological validity; (2) school-level clustering reduced statistical power, and to compensate, full information maximum likelihood (FIML) techniques were used to handle missing data. (Additional information about missing data, school-level sampling, and analysis can be found in the analytic approach section.) In the final sample of students (n = 2,904) 1,422 (49%) were female and 929 (32%) were eligible for FRPL. The sample was ethnically diverse (1,191 [41%] Caucasian, 319 [11%] African American, 552 [19%] Asian, 697 [24%] Hispanic, 145 [5%] other). Schools identified 813 (28%) as ELL. See Table 1 for description by treatment condition.
Figure 2 describes the pattern of students’ entrance and attrition from the sample from 2008 to 2011. The magnitude of student attrition (intervention, n = 395; control, n = 350) and student entrance (intervention, n = 527; control, n = 444) was comparable (p > .05) between intervention and control conditions between end of second and fifth grades. Students (n = 109) in French and Spanish immersion classrooms were present only in the intervention group and were excluded from analyses. Logistic regressions conducted to examine differential entrance and attrition between intervention and control conditions by gender, FRPL, ethnicity, and ELL showed no statistically significant differences between intervention and control schools (p > .10).

Research design and attrition/addition flow through the Responsive Classroom Efficacy Study.
Intervention
Third-, fourth-, and fifth-grade teachers in the intervention condition received training in the RC approach, involving two 1-week long training sessions, RC 1 and RC 2, delivered in two consecutive summers. Third- and fourth-grade teachers received RC 1 in summer 2008 and RC 2 in summer 2009. Fifth-grade teachers received RC 1 in summer 2009 and RC 2 in summer 2010. Teachers received 3 days of school-based coaching and opportunities to engage in three RC workshops during each school year subsequent to training. Further, each teacher received RC manuals, two additional RC books, on-demand support (in person and via e-mail) from coaches, and articles on the RC website. School administrators at the 13 schools received RC 1 and RC 2 training and three sessions per year of administrator coaching led by NEFC consultants. In addition, NEFC consultants met with each school administrator for a planning meeting in fall and spring. Each school received a full set of RC books for their library. All training and coaching sessions were conducted by NEFC consultants who were trained and certified RC instructors.
In RC 1, participants learned strategies to implement key RC practices, including Morning Meeting, Rule Creation, Interactive Modeling, Positive Teacher Language, and Logical Consequences. Additional RC practices, Guided Discovery, Academic Choice, Classroom Organization, and Collaborative Problem-Solving, were emphasized in RC 2.
Teachers in the control group did not receive RC training and continued with “business as usual” approaches. Principal interviews and questionnaires were used to assess the social and emotional learning and classroom management practices among schools in the control condition. No principals reported use of the RC approach at the school level. Seven principals reported no schoolwide program, two reported schoolwide reward systems, one described schoolwide teams using the Kagan approach, and one described use of Positive Behavioral Support.
Procedures
Schools were recruited in November 2007 and randomized into condition. Baseline data collection was conducted in spring 2008 by administering the Stanford 10 mathematics test (described below) to all second graders at participating schools.
Classroom observations and teacher questionnaires to measure fidelity were conducted in 2008–2009 for third-grade teachers, 2009–2010 for fourth-grade teachers, and 2010–2011 for fifth-grade teachers. Thus, study year data were collected on third-grade teachers in the school year immediately following RC 1 training corresponding to their first year of implementation. Study year data were collected on fourth- and fifth-grade teachers in the year subsequent to RC 2 training in their second year of implementation. This decision was based on grant time constraints, but is consistent with existing patterns in RC training. NEFC states that more than one-half of teachers (nationally) who receive training in the RC approach attend RC 1 only.
Five classroom observations were conducted throughout the school year for each teacher to measure observed fidelity of implementation. For each teacher, two observations were conducted during the first hour in the morning and three observations were conducted for one hour during math lessons. Observations were scheduled following a set of decision rules to ensure evenness over the year and across schools and assignment condition. Observations corresponded to three windows (window 1: late September to late November; window 2: late November to mid February; and window 3: late February to late April). Morning observations were conducted in two of the three windows with no more than two-thirds of the teachers at each school receiving a morning observation per window. Math observations were conducted in each of the three windows. Research assistants conducted videotaping (for work beyond the scope of this article) and rated fidelity of implementation using the Classroom Practices Observational Measure (described below) for the full 60-minute observations. In April of each year, teachers were surveyed to gather information on teachers’ years of experience, teachers’ level of education, and two teacher-report measures of fidelity of implementation, the Classroom Practices Teacher Survey and Classroom Practices Frequency Survey (described below). Teachers received $100 upon completion.
In May 2011, all students present in the fifth grade at the 24 schools were given the fifth-grade state standardized test, the Standards of Learning (Virginia Department of Education [VDOE], 2010). Students who were not English proficient took the plain English math assessment, an equivalent, alternative form of the Standards of Learning math test. Student demographic and standardized test score data were gathered from school records.
Measures
School assignment to treatment condition (intervention vs. control) was the key independent variable. Fidelity, aggregated to the school level, was assessed as a potential mediator. Student math and reading achievement in fifth grade were assessed as outcome variables. Students’ FRPL status and initial achievement were included as focal variables in analyses testing for moderated mediation. Child-level covariates included student demographic characteristics (gender, FRPL, ethnicity, ELL), test form (plain English vs. standard), and initial achievement. Four variables were aggregated to the school level and treated as covariates: teacher years of experience, teacher education, student FRPL, and initial math achievement.
Fidelity of Implementation
Observed fidelity of implementation
The Classroom Practices Observation Measure (CPOM) is a manualized observational measure of teachers’ use of RC practices (fidelity) developed by the research team with feedback from NEFC (Abry, Brewer, Nathanson, Sawyer, & Rimm-Kaufman, 2010). Raters observed and assessed teachers’ use of RC practices during a 60-minute period. Teachers were rated on 16 items during the morning observation (α = .87) and a subset of 10 items during math instruction (α = .65). (The six Morning Meeting items were relevant to morning observations only.) Each item was written without RC language so items could be rated by research assistants with no knowledge of the RC approach and could be used in control and intervention classrooms. Internal consistency was comparable in intervention and control conditions. CPOM was coded live, on site using the 3-point Likert scale (1 = not at all characteristic, 2 = moderately characteristic, 3 = very characteristic). The manual includes descriptions and examples of practices that exemplify values of 1, 2, or 3 for each item. One example item is, “Three to five general, positively worded rules are posted in the classroom.” The observer rating was based on three criteria: (a) number of rules (3 to 5 vs. less or more), (b) generalness of rules (“Be respectful” not “No talking during silent reading”), and (c) rule positivity (“Take turns” not “Don’t yell”). The observer coded 1 if there were no rules posted or if posted rules met one of the three criteria; 2 if two of the three criteria were met; and 3 if all criteria were met. Other items were: “Teacher asks questions or makes statements that invite students to remember expected behaviors” and “Students make individualized choices related to an academic lesson or goal.” CPOM scores were computed as the mean of all items across five observations.
Two-day CPOM trainings were conducted by research assistants following a written protocol. Initial reliability was established using eight 60-minute master-coded videos, at minimum. Each coder exceeded 80% exact agreement on eight 1-hour segments prior to initiating data collection (values were 84%, 80%, and 84% exact match for year 1, 2, and 3, respectively). Ongoing monthly drift meetings were conducted for calibration. Each coder viewed and individually coded a 60-minute classroom observation video prior to the meeting. Codes brought to meetings were used to calculate percentage agreement, resulting in an average of 85% exact match between coders and master coders over 3 years.
Teacher reported fidelity of implementation
Teachers reported on their fidelity of implementation using two measures. The Classroom Practices Teacher Survey (CPTS; Nathanson, Sawyer, & Rimm-Kaufman, 2007a) is a 46-item measure assessing adherence to RC practices (α = .91). CPTS items did not contain any RC terminology, and internal consistency was comparable in intervention and control conditions. Teachers rated each item on a 5-point Likert scale (1 = not at all characteristic, 2 = a little bit characteristic, 3 = moderately characteristic, 4 = very characteristic, 5 = extremely characteristic). Examples include: “In the morning we have a class meeting where we sit in a circle facing one another” and “When introducing new materials, I ask students to demonstrate ideas for how to use and care for the materials.” CPTS composite scores were computed as means of the 46 items.
The Classroom Practices Frequency Scale (CPFS; Nathanson et al., 2007b) is an 11-item measure assessing teachers’ perceived frequency of use of RC practices over the course of the school year (α = .88). Internal consistency was comparable in intervention and control conditions. Items were rated on an 8-point scale ranging from 1 = almost never used the practice, 2 = 1 × per month, 3 = 2–4 × per month, 4 = 1 × per week, 5 = 2–3 × per week, 6 = 4 × per week, 7 = 1 × per day, 8 = used the practice more than once a day. Items did not use RC terminology. Items include: “When a rule or procedure is introduced, I asked students to model what following the rule or procedure looks like” and “I provide opportunities for students to choose how to do work, what kind of work to do, or both.” Mean values were computed for the 11 items.
Fidelity factor score
Confirmatory factor analysis was used to combine the three fidelity measures (CPOM, CPTS, and CPFS) into a single fidelity variable that weighted each measure differentially according to its contribution to a single underlying latent variable. Resulting factor loadings exceeded .90. Cronbach’s alpha for the factor score equaled .94 and indicated unidimensionality. Factor scores were used in subsequent fidelity analyses.
Student Achievement Outcomes
Fifth-grade achievement
The paper version of the state standardized test, the Standard of Learning (SOL), was used to assess mathematics and reading achievement in May of students’ fifth-grade year (VDOE, 2008). The mathematics test comprised of 50 multiple choice items (α = .88) tapping students’ procedural knowledge and conceptual understanding of four skill categories: (a) number and number sense, (b) computation and estimation, (c) measurement and geometry, and (d) probability, statistics, patterns, functions, and algebra (VDOE, 2010). The reading test is comprised of 40 multiple choice items (α = .85–.87) to measure two skills: (a) students’ reading and print material comprehension and (b) use of word analysis strategies and information resources. A state data team summed the number of correct items, converted the value to a scaled score (ranging from 0 to 600), and transmitted data to the district. The research team garnered scores from the district.
VDOE (2008) describes test development, calibration, and validity. Test items were developed through collaboration among Virginia educators, VDOE, Educational Testing Service, Pearson, and content experts based upon test blueprints. Calibration was established using Rasch modeling and the Partial Credit model. Test validity was established by gathering empirical evidence supporting the face validity, intrinsic rational validity, content validity, and construct validity. VDOE (2008) offers the standard and plain English versions for math.
Covariates and Variables for Moderated Mediation
Student characteristics
Baseline student math achievement was gathered using the Stanford 10 abbreviated mathematics test (Harcourt Educational Measurement, 2003). Gender, FRPL, ethnicity, ELL status, and test form administered (regularly or plain English version of the math SOL test) were gathered from district data. Gender was coded as 1 = female, 0 = male. Qualification for FRPL (1 = yes, 0 = no) was defined as $40,793 for a family of four, roughly below 180% of the federal poverty guideline. Ethnicity was based upon parent report of ethnicity upon student matriculation. ELL status was based on a district-developed scale and cutpoint: students were assigned a value of 1 if they were receiving ELL services and a value of 0 if they were not receiving ELL services.
Students completed the plain English math version of the mathematics test if the student’s teacher designated that the student had a learning disability or limited English proficiency. The plain English math version used the same scoring system as the SOL and was designed to be equivalent to standard math assessment (VDOE, 2008). Test form data were garnered from the district and coded 1 = plain English, 0 = standard form.
Baseline student math achievement, gender, FRPL, ethnicity, ELL, and test form were included as student covariates. FRPL and low initial math achievement were used in moderated mediation analyses. The cutoff for low initial math achievement was below the 25th percentile on the Stanford 10, a decision reflecting review of comparable decisions (Baker, Gersten, & Lee, 2002).
School-level covariates
Data on teacher characteristics (years of teaching experience, level of education) were gathered in a teacher survey. Years of teaching experience referred to total years of teaching experience; level of education was coded as 1 = master’s degrees or higher. Years teaching experience and level of education were averaged across study years and aggregated to the school level for analysis. School characteristics were gathered from school record data and included gender, percentage of students eligible for FRPL, school ethnic composition, and percentage of ELL students. School-level achievement at baseline was based upon the Stanford 10 mathematics test aggregated up to the school level.
Analytic Approach
Structural equation modeling (SEM) analyses were conducted to test the (a) main effect of treatment on outcomes, (b) the mediated effect of treatment on outcomes through fidelity, and (c) moderated mediation, examining the extent to which the mediated effect of treatment on outcomes through fidelity varies with students’ eligibility for FRPL and initial ability level. Analyses were conducted using Mplus 6.12 (Muthén & Muthén, 1998–2010) using a maximum likelihood estimator with TYPE=COMPLEX to control for clustering. Clustering was conducted at the school level, corresponding to the level of randomization and consistent with Murray, Hannan, and Baker (1996). A Monte Carlo integration estimator was used to achieve convergence. (Note that this estimator does not produce traditional fit statistics.) Initially, math and reading achievement outcomes were included in the same model but the model did not converge. Therefore, separate models were conducted for each outcome. Ethnicity variables were included in SEM analyses but results are not reported in accordance with the district memorandum of agreement.
The decision to analyze fidelity of implementation data at the school level instead of the teacher level requires further explanation. Data were gathered on students over 3 years. The classroom composition changed over the 3 years; students nested in one classroom in third grade were often scattered among various classrooms in fourth grade and a different set of classrooms in fifth grade. Such nesting is difficult to model. In addition, some of the schools had students move among classrooms for reading, math, and other subjects, and therefore, students were exposed to two, three, or four teachers on any given day. For example, students may have been exposed to low level of RC practices in the morning in one classroom but a higher level of RC practices later in the day in another classroom. We were unable to gather data on which children were exposed to which teacher and for how long within each year. Thus, we aggregated fidelity to school level because it matched the level of randomization and addressed changes in the nesting structure across the 3 years and across typical schools days. Findings can be interpreted in relation to what schools comparable to those sampled could expect from adopting and implementing the RC approach over a 3-year period.
SEM assumes normality of the endogenous variables, linear relations between variables, independence of observations, and independent exogenous variables. Data were examined using histograms, bivariate correlation tables, QQ-plots, variance inflation factors, and other methods. The data met assumptions of normality, linearity, and independent exogenous variables.
As depicted in Figure 2, students entered and exited the 24 study schools over the 3 years. Student attrition from third to fifth grade was considerable with missing data of approximately 30% for both the fifth-grade math and reading achievement. As mentioned previously, there was no relation between any of the covariates/outcomes and missing data at the school level. Thus, the data were considered to be missing at random (MAR). Traditional missing data techniques such as listwise deletion, pairwise deletion, or mean imputation have been shown to have lower power and more bias of the parameters in the presence of MAR data (Allison, 2002; Enders & Bandalos, 2001; Schafer & Graham, 2002). Thus, missing data in this model were handled through FIML. FIML uses all available data to estimate parameters and thus leads to unbiased parameter and standard error estimates (Little & Rubin, 1987).
We observed substantial ceiling effects for the outcomes; 23.7% of the students scored the maximum math score, 5.9% scored the maximum reading score. Thus, outcomes showing ceiling effects were treated as censored variables (Klein & Moeschberger, 1997), a process involving the treatment of maximum scores as lower bounds for students’ true latent score. This approach to accounting for censored outcomes leads to less biased estimates (Long, 1997).
Standardized coefficients were calculated based on the unstandardized coefficients emanating from MPlus output in order to present a coefficient indicating effect size. In the case of a continuous covariate the following formula was used:

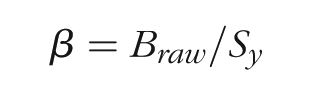
The second formula lacks
Results
Descriptive Statistics
Table 1 presents the means and SDs for all independent and dependent variables and covariates for intervention and control schools at the school and child levels. Table 2 shows school-level correlation coefficients. The correlation between treatment assignment and the fidelity of implementation factor was very high (r = .91, p < .01). Fifth-grade reading and math scores were correlated (r = .53, p < .01). Initial achievement levels (aggregated to the school level) correlated positively with fifth-grade achievement for reading (r = .78, p < .01) and math (r = .50, p < .05). Higher concentration of students at the school eligible for FRPL related to lower initial achievement (r = –.75, p < .01), fifth-grade math (r = –.65, p < .01), and reading achievement (r = –.89, p < .01).
Correlation Coefficients Between Pairs of School-Level Variables (n = 24)

Note: FRPL = free/reduced-price lunch.
p < .05. **p < .01.
Intraclass correlation (ICC) values were computed to determine the percentage of school-level versus child-level variance for fifth-grade math and reading achievement. ICC values were 0.04 and 0.14, indicating that 4% of the total math variance and 14% of the total reading variance could be attributed to the school level. Thus, analyses accounted for nested effects.
Intervention and control schools differed in fidelity of implementation (p < .001), as evidenced by t tests. See Table 3. Differences were large; effect size Cohen’s d values ranged from 2.47 to 3.88.
School-Level Descriptive Statistics and Differences in Fidelity of Implementation Between Intervention and Control Conditions

p < .001.
Research Question 1
The results for the two separate SEMs testing the effect of treatment on fifth-grade math and reading achievement are found in Table 4. Treatment was not significantly related to fifth-grade math or reading achievement (β = –.13 for math, β = –.06 for reading). Girls had significantly higher math and reading achievement scores than boys. FRPL eligibility was associated negatively to math and reading achievement. Both ELL status and completion of the plain English test related negatively to math and reading. Initial math achievement related positively to fifth-grade math and reading. The models accounted for a substantial portion of the variance in achievement outcomes (R2 = .35 for math, R2 =.45 for reading).
Main Effect Model of Treatment on Fifth-Grade Math and Reading Achievement

Note. R2 = 0.35 for math achievement. R2 = 0.45 for reading achievement. Child-level initial math achievement is group-mean centered. ELL = English language learner.
p < .05. **p < .01.
Research Question 2
SEM analyses were conducted to examine the extent to which fidelity of implementation (use of RC practices) mediated the relation between assignment to the RC approach condition and achievement outcomes. The same child- and school-level covariates described in Table 4 were included in models described in Table 5. Fidelity was positively related to fifth-grade math and reading (β = .26, p < .01; β = .30, p < .01, respectively). Treatment related positively to fidelity (β = 1.73, p < .01). School-level percentage FRPL related positively, and teachers’ years of experience related negatively to fidelity.
Mediation Model of Treatment on Fifth-Grade Math and Reading Achievement Through Fidelity

Note. R2 = .88 for fidelity of implementation. R2 = 0.35 for math achievement. R2 = 0.45 for reading achievement. Child-level initial math achievement is group-mean centered.
p < .05. **p < .01.
The direct effect of random assignment to treatment was negative for both outcomes (β = –.60, p < .01 for math; β = –.58, p < .01 for reading), indicating that, controlling for fidelity, students in RC schools showed lower math and reading achievement than those in the control schools. Overall tests of the indirect effects of treatment through fidelity on fifth-grade math and reading achievement were positive and significant (β = .44, p < .01; β = .52, p < .01, respectively), indicating that random assignment to the RC condition caused increased fidelity, which in turn was associated with improvements in both math and reading achievement. Examination of effect size gains (based on standardized coefficients) suggests that being in an RC school with one SD higher levels of fidelity related to a .44 SD gain in math scores and a .52 SD gain in reading scores. The presence of the positive indirect effect needs to be interpreted in the context of the negative direct effect (β = –.60 for math; –.58 for reading, p < .01). Therefore, the total effects of random assignment (indirect effects of treatment plus the direct effect of treatments) are small and nonsignificant for both outcomes.
Partial residual plots (Larsen & McCleary, 1972) were created to display results graphically. Figure 3 shows partial residual plots for fifth-grade achievement and fidelity. The figure shows that all intervention schools except one showed higher fidelity and fifth-grade math and reading achievement compared to control schools, after controlling for covariates.
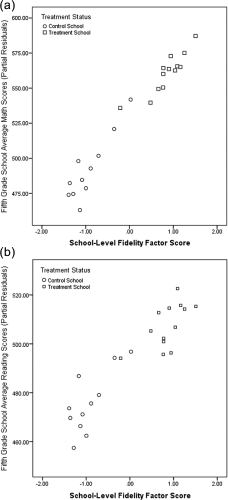
Partial residual plot of school average fifth-grade math (a) and reading (b) scores versus fidelity.
Research Question 3
Analyses were conducted to test the possibility of moderated mediation, such that the relation between treatment, fidelity, and the outcomes differed depending on students’ eligibility for FRPL and students’ initial math achievement (<25th percentile). Separate SEM models were conducted for each potential moderator for math and reading. Models allowed the paths from treatment status to fidelity, treatment status to achievement, and fidelity to achievement to vary depending on the moderators. Results showed no significant moderation effects for FRPL for either outcome. Initial achievement showed significant moderated mediation in relation to math achievement. The relation between fidelity and math achievement was stronger for students with low initial achievement. As a result, the overall mediation (RC to fidelity to math achievement) was significant for low-achieving students but not higher achieving students. Examination of effect size gains (based on standardized coefficients) suggests that being in an RC school with one SD higher levels of RC fidelity related to a .89 SD gain in math scores for students low in initial achievement but only a .25 SD gain in math scores for students higher in initial achievement. Initial achievement did not moderate any of the paths in the model predicting reading achievement. See Table 6.
Moderated Mediation Model of Treatment on Fifth-Grade Math and Reading Achievement Through Fidelity for Low (<25%-ile) versus Higher (>25%-ile) Initial Achievement

Note. R2 = 0.91 for fidelity. R2 = 0.29 for math achievement. R2 = 0.46 for reading achievement.
p < .10. *p < .05. **p < .01.
Discussion
We discuss findings from a clustered randomized controlled trial on the RC approach and achievement in relation to three foci: (a) the impact of the RC approach over 3 years on students’ reading and math achievement, (b) the extent to which fidelity of implementation mediated the relations of treatment assignment (intervention vs. control) with reading and math achievement, and (c) the extent to which paths in the mediation models were moderated by FRPL status and low initial math achievement.
Impact of the RC Approach
Random assignment to intervention versus control schools did not impact student achievement outcomes. Although the result was counter to our hypothesis, other RCT results linking SEL interventions to SEL outcomes are comparably lackluster (SACD, 2010). Several explanations are plausible. Treatment was randomized at the school level, and thus, analyses were also conducted at the school level. The a priori power analysis suggested sufficient statistical power to detect small to medium effects (.85 assuming ICC values of .10); however, this number of schools was far from ideal. The real effect size could be smaller than anticipated and the study conducted here may have lacked sufficient statistical power to detect effects. Second, other constructs believed to be integral to our logic model (e.g., student motivation and engagement) may not adequately translate into outcomes measured by state standardized achievement tests (Duckworth, Quinn, & Tsukayama, 2012). A third reason pertains to fidelity of implementation of the RC approach. We describe this point carefully because the explanation is consistent with accumulated research pointing to the importance of high-quality implementation of SEL interventions for predicting child outcomes (Domitrovich et al., 2008) and also because this point has the greatest relevance for practitioners making decisions about use of the RC approach.
Role of Fidelity of Implementation
Training in the RC approach produced large changes in teacher practices. Measures of both frequency and adherence to the RC approach indicate the presence of treatment differentiation between intervention and control schools (effect size d values: 2.47–3.88). We used teacher-report and observational fidelity measures to determine whether the intervention was delivered and to assess the quality of that delivery (O’Donnell, 2008). Fidelity results were consistent with the program logic model, permitting us to investigate fidelity as a mechanism for explaining potential outcomes. An important nuance emerged from fidelity analyses. Results revealed evidence of high but variable intervention uptake among intervention schools and low but variable RC practices in control schools. It is not surprising that RC practices were present in control schools given the common origins between RC practices and “best practices” in teaching and intervention diffusion (Hulleman & Cordray, 2009).
Receiving the RC training produced gains in RC practices, which in turn was associated with improvements in both math and reading achievement. The effect size (based on standardized coefficients) between use of RC practices and student achievement was .26 and .30 for math and reading, respectively. Findings from the Durlak et al. (2011) meta-analysis report effect sizes (Hedge’s g) of .27 for SEL interventions on achievement and describe lower effect sizes in the presence of fidelity problems. Results from a meta-analysis of 76 meta-analytic papers on educational interventions give benchmark effects for the elementary grades ranging from .22 to .23 (Hill, Bloom, Black, & Lipsey, 2008). The effect size values for the association from RC practices to achievement are comparable to those for SEL and other educational interventions for this age group.
The fidelity of implementation findings raises an enigma for practitioners and policymakers making decisions about the RC approach. On one hand, RC practices link positively to achievement. Randomization to the RC condition causes use of RC practices, which in turn relates to increased student achievement. On the other hand, the direct effect of RC training to achievement is negative in models that include fidelity of implementation. Hypothetically, what this means is that given two schools (one intervention and one control) with equivalent levels of RC practices, students in the control condition will outperform the intervention condition. Yet realistically, there are only 2 of 24 schools in the present sample that fits with this hypothetical example. In the remaining 22 cases, intervention schools use more RC practices than control schools, producing the exact conditions associated with student achievement gains.
The enigma here stems from the common problem of treatment heterogeneity in cluster randomized controlled trials (Cook, 2005). Schools vary in their use of RC practices, as shown in Figure 4. Such variability calls attention to factors that predict successful uptake of RC practices. As one example, mixed-methods research from RCES shows the importance of school leadership. Teachers’ perception of their principals’ “buy-in” to the intervention related to teachers’ use of RC practices. Teachers questioned using the RC practices if they thought their principals adopted the approach to acquire funds or prestige. Also, teachers used fewer practices if their principals adopted programs that conflicted with RC principles but used more practices if their principal made structural accommodations to engender their use (Wanless, Patton, Rimm-Kaufman, & Deutsch, 2013). Other SEL work (e.g., PATHS) shows the importance of administrative support in predicting higher quality of implementation of the intervention (Ransford, Greenberg, Domitrovich, Small, & Jacobson, 2009). Schools are social systems in which leadership decisions influence teachers, students, and psychological experiences within the school (Bryk, Sebring, Allensworth, Easton, & Luppescu, 2010). Administrators who convey clear support for the RC approach and indicate commitment to long-term adoption may enhance teachers’ use of RC practices.

Fidelity of implementation at intervention and comparison schools.
Other factors are likely to be important predictors of uptake of the RC approach. Teachers’ psychological state (e.g., burnout, self-efficacy) and their perceived value of the program have been implicated in schoolwide SEL adoption (Brackett, Reyes, Rivers, Elbertson, & Salovey, 2011; Ransford et al., 2009). Effective coaching supports implementation of SEL practices (Ransford et al., 2009). Teachers’ and administrators’ comfort, commitment, and culture to SEL (Brackett et al., 2011) and organizational health of the school community (Bradshaw, Koth, Thornton, & Leaf, 2009) related to higher implementation of practices or moderate the link between teachers’ psychological characteristics and use of practices. Teachers’ advice networks (i.e., access to intervention expertise, conversation with other teachers about practices, pressure from other teachers, common sources of mentorship among teachers) contribute to the adoption of new practices (Frank, Zhao, & Borman, 2004; Neal, Neal, Atkins, Henry, & Frazier, 2011).
Assignment to the intervention condition without use of RC practices relates lower student achievement, a finding requiring explanation. One possibility is that learning the RC practices disrupted typical high-quality instruction used before training in the RC approach. Critics of the RC approach suggest that time spent engaged in RC practices (e.g., Morning Meeting, which can take 20 minutes per day) detracts from instructional time. In contrast, developers of the RC approach suggest that time allocated to RC practices has benefits later in the day and year (Denton & Kriete, 2000). Other analyses on this data set examined the RC approach and quality and quantity of math instruction. RC and comparison schools did not differ in the amount of time spent in math instruction on three typical days during the year and third-grade math teachers at RC schools showed improved, not diminished, inquiry-based math instruction (Ottmar, Rimm-Kaufman, Berry, & Larsen, 2013). Although limited to math only, existing results on a subset of teachers in RCES do not show reduced time or quality.
Another possibility is that there are attributes of the schools that predict both decreased uptake of the intervention and lower student achievement. For example, if school leaders lack leadership skills, teacher may have difficulty creating priorities in the face of competing demands on their time. In turn, poor leadership may lead to both low intervention uptake and low achievement. It is not possible to determine the direction of causality—poor leadership may produce low RC implementation and low achievement or it may be harder to implement RC practices and lead effectively in conditions with very low student achievement.
Other explanations are also plausible. Within a single school, some teachers may show more uptake of the intervention than others. The positive indirect path would be due to the teachers who uptake the intervention more and the negative direct effects would be due to teachers who do not use RC practices. Yet another explanation is that the RC approach has both positive and negative components. The positive components may be well represented in the fidelity measure while the negative components were not. Further research using mixed-methods approaches will help explain these findings.
Subgroup Analysis
Findings showed that the relations among treatment assignment, fidelity of implementation, and reading and math achievement were equivalent regardless of whether students qualified for FRPL or not. This finding is evident after controlling for the poverty composition of the school. Replication of the work is needed to understand the generalizability of findings to other schools in different settings (e.g., extremely high poverty schools).
Enrollment at an RC school with high implementation conveyed greater advantages to students’ math achievement if students were initially in the bottom math achievement quartile. The differential contribution of RC practices draws attention to two possible mechanisms—student skill development and teacher capacity. In relation to student skills, the RC approach is designed to improve students’ self-regulatory and attentional skills, skills that may undergird student math achievement (Duncan et al., 2007; Li-Grining et al., 2010). Pertaining to teachers’ capacity, the RC approach is designed to improve a teacher’s ability to understand and meet students’ individual needs. One RC principle states “Knowing the children we teach—individually, culturally, and developmentally—is as important as knowing the content we teach” (NEFC, 2007, p. 3). Various RC practices such as Teacher Language and Academic Choice may improve teachers’ capacity to work with low-achieving students.
Limitations
Several limitations require mention. First, the quality of results may be limited by the selected outcome measure. The state standardized achievement test has been criticized because of the presence of ceiling effects and because reliability is higher near policy-relevant cut-points (e.g., those defining proficiency) compared to other points in the scale (May, Perez-Johnson, Haimson, Sattar, & Gleason, 2009). Further, the math standardized achievement tests, although critical to policy decisions, tap procedural understanding and test-taking ability, not conceptual understanding of mathematics. Statistical approaches, such as censored data techniques, were used to compensate for some test limitations. Second, timing and resource constraints influenced data collection decisions. Because of timing constraints, third-grade teachers were observed in their first year of implementation (after RC 1) whereas fourth- and fifth-grade teachers were observed in their second year of implementation (after RC 2). Although not ideal, NEFC states that many teachers trained in the RC approach only attend RC 1. Because of project priorities, math scores were used as indicators of low initial achievement and 60% of the observational fidelity measures were gathered during math instruction; thus, findings may be more precise for math than reading effects. This limitation must be considered in interpreting the RC practices to achievement link for students with low initial math achievement. However, this concern is partially ameliorated in that 40% of the observational measures and all of the teacher-report measures of fidelity of implementation were not gathered during math instruction. Third, adopting interventions such as the RC approach involves a long process of teacher change ranging from 3 to 5 years. Data collected in the present study were gathered during teachers’ first and second years of RC implementation, early in the process of RC adoption.
Implications and Future Directions
This study is among the few randomized controlled trials examining the effect of SEL interventions on student achievement. Findings indicate that student gains hinge on actual use of recommended classroom practices. This study considered a question school administrators and teachers ask: Will we diminish children’s academic achievement if we place increased emphasis on (and allocate more time toward) children’s social and emotional learning? Findings show that using the RC approach did not diminish achievement, and if the RC practices were used as intended, students showed achievement gains. Further, use of RC practices was linked to enhanced achievement in children who were initially low in math achievement, a point in need of replication given that the findings do not permit causal inference.
Results direct attention toward next steps. Treatment heterogeneity among the schools suggests the importance of examining teacher-level implementation in future work. Mixed-methods and qualitative work is needed. For instance, findings raise important questions about the supports and barriers that predict teacher and school implementation of RC practices as well as questions about the process of teacher change involved as teachers implement the RC approach. Yet another needed step is work that considers students’ exposure to RC practices. For instance, do the contributions of RC practices become more pronounced after 2 or 3 years of student exposure to RC compared to after only a single year? Do some students find RC practices more engaging than others and thus participate more actively and benefit more substantially compared to other students? Training in the RC approach appears to be very effective in producing teacher change. Other interventions that prove less effective at creating teacher change may consider referring to the NEFC training model. Following students into middle and high school years and expanding outcomes to include social and emotional constructs may provide insight into potential enduring contributions of RC practices.
Footnotes
Notes
S
R
A
T
M
J
E
T
J